TOP

AT&T Office@Hand

Learn how to use features from AT&T Office@Hand. Access our self-help options to set up and use this application to communicate with customers.

Back to Product Page
Use the dropdown to get support, or purchase this product

Analytics Portal – Tabs & Reports of the Analytics Portal | AT&T Office@Hand
Article #11110

Reports

You can generate a report from AT&T Office@Hand Analytics Portal using Company Numbers. Follow the steps below to know how to create a Company Numbers Report.

Create a Company Numbers Report+

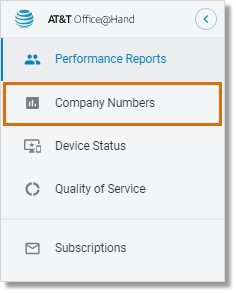
  1. Go to Admin Portal > Reports > Analytics Portal > Company Numbers.
  2. Click the Calendar to set the date. You can select preset time periods or select Custom Ranges. Click Done to set.

    Click the Calendar to set the date. You can select preset time periods or select Custom Ranges. Click Done to set.

  3. Select the preferred Company Numbers report — Numbers or Calls.
  4. Configure the settings for the selected report.
    • Set KPIs for the Numbers report
    • Configure a Calls report
      Set KPIs for the Numbers report
      – Set the filters for Company Numbers and/or Call Length, as needed. Click Select KPIs, then select the preferred KPIs from the list. Click Done.
      – Data will be shown under Trend and Company Numbers once set.
      TIP: Click Show KPIs description to learn more information about each metric on the list.
      Configure a Calls report
      – The Calls tab lets you search for calls, filter Company Numbers and Call Length. The search result will then display the following information:
    • the callers’ numbers
    • the numbers called
    • the result of the call
    • the length of the call
    • the handle time
    • the call’s start time
    • the call’s direction
    • the number of queues the call went through
    • the session map
  5. You can click Download or Save your report.

    You can click Download or Save your report.

    Note:

    • Reports can be downloaded in PDF or Excel formats.
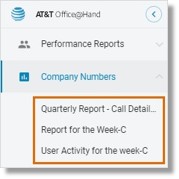
    • When saving a report, you can enter a name or overwrite the report using the same name. Saved reports can be accessed from the left pane by clicking Company Numbers.

       Saved reports can be accessed from the left pane by clicking Company Numbers.

    • You can also subscribe to reports. See Analytics Portal – Create Subscriptions – AT&T Office@Hand for more information.

Back to top

Company Numbers Report Overview+

You can generate a report from the Analytics Portal using Company Numbers. The are also a number of Key Performance Indicators (KPIs) available for this report.

Company Numbers KPIs Overview
Access Company Numbers Report
Company Numbers Report Tabs

Company Numbers KPIs Overview

  • The number or percentage of all inbound calls answered on a company number
  • The number or percentage of all calls to a company number in which a Voicemail was left.
  • The number or percentage of all calls that were missed (includes Voicemail).
  • The total amount of handle time the user spent on the calls on a company number. Handle time is all live talk time and all hold time.
  • The average duration of a company number call, from answered until terminated. This includes live talking plus time on hold.
  • The number of calls placed on hold for the numbers selected, the average hold time, or the number of abandoned calls put on hold.
  • The number of calls transferred, parked (or answered from park), total park time and the number of calls abandoned while the caller was put on park.

Access Company Numbers Report

Go to Admin Portal > Reports > Analytics Portal > Company Numbers.

Go to Admin Portal > Reports > Analytics Portal > Company Numbers.

Company Numbers Report Tabs

The Company Numbers Report is composed of 2 tabs.

The Company Numbers Report is composed of 2 tabs.

Numbers

This portion is composed of the KPIs, Trend, and the Company Numbers sections. The Numbers tab allows you to filter the report according to Company Numbers and Call Length.

  • KPIs section – This section lets you customize which metrics should be presented on the Trend section. Selected metrics appear as tabs that can be clicked.
  • Trend section – This part displays a graphical presentation of the selected data from the KPIs section. The selected metrics data is presented on an hourly basis. Click on a different metric from the KPIs section to switch to another graph.
  • Company Numbers section – This section displays a report with the following data:Company Number, the number of inbound, answered, missed calls, the average handle time, the number of holds, and the average hold time.

Calls

The Calls tab lets you search for calls, filter Company Numbers and Call Length. The search result will then display the following information:

  • the callers’ numbers
  • the numbers called
  • the result of the call
  • the length of the call
  • the handle time
  • the call’s start time
  • the call’s direction
  • the number of queues the call went through
  • the session map


Back to top

Device Status Report+

The Device Status Report allows the System Administrator to monitor the company’s hard phone network. It helps to track issues that impact the desk phones’ connectivity, network stability, and to troubleshoot desk phone problems reported by Users.

The Device Status Report allows the System Administrator to pro-actively monitor the company’s hard phone infrastructure, track issues impacting the users’ hard phone connectivity, network stability, as well as to troubleshoot problems reported by users regarding service availability on the hard phones.

The Device Status Report allows Users to access the status information of their desk phones. It also helps to drill down by phone specifics, in order to see which devices are offline. This is helpful when you need to debug the phones, especially when the system goes down.

It helps to answer the following questions:

  1. What is the overall health of the hard-phone infrastructure?
  2. How many hard phones are offline now?
  3. Is there a particular region or location that needs to be investigated?
  4. How many hard phones had trouble registering in the past 7 days?
  5. Is there a particular trend in the hard-phone registration behavior?

Note: The report does not provide information on other endpoints.

Click on links below for more information.

Access Device Status Report

Go to Admin Portal > Reports > Analytics Portal > Device Status.
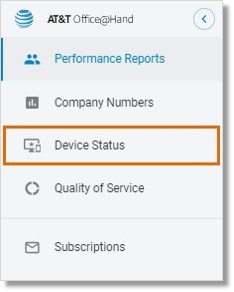
Go to Admin Portal > Reports > Analytics Portal > Device Status.

Sections

Overview

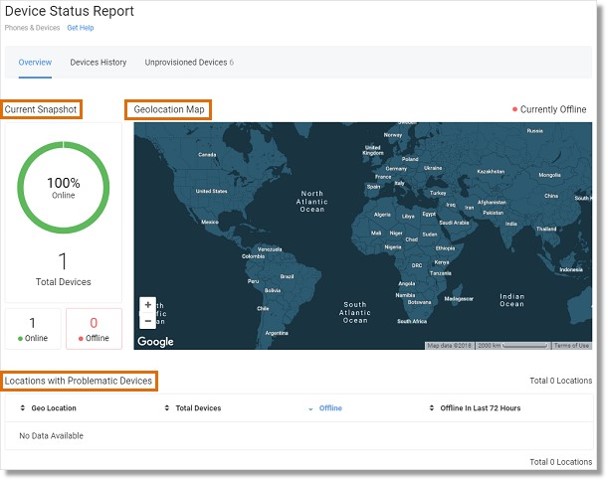
The Overview section displays the current state of the hard-phone network for proactive monitoring and investigation of the locations with devices that have registration issues. The data shows whether a device is Online, Offline, or unprovisioned. The report gets refreshed every 15 minutes and displays data according to the User’s timezone settings.

The section includes 3 main elements:

Current Snapshot

This section shows online and offline devices represented as percentages related to the total number of provisioned hard-phones. In addition, the total number of devices is represented to allow the administrator to monitor the number of provisioned devices in the system. The administrator can access details for the offline devices by clicking on the absolute numbers provided below. This action leads to the list of all offline devices across all locations.

Geolocation map

This section provides an overview of all locations with at least one offline device over the last 15 minutes. The
GeoIP Locations are defined by the IP addresses of the devices. One can drill down the map to see either a 360 view or to identify individual locations at risk. When several locations are situated close to each other, they become aggregated into one bubble when zooming out.

  • Clicking on an aggregated bubble automatically zooms in to analyze the region with offline devices.
  • Clicking on an individual; for example, non-aggregated bubble results in drilling down to the list of offline devices in the location.

AT&T Office@Hand uses the industry-leading IP intelligence services by MaxMind® to associate customers’ IP addresses with Geo Addresses. VPN IP addresses cannot be associated with the Geo Addresses and are displayed only as IP addresses that are identified by the internal network or system administrators.

Click here to submit a Geo IP data correction request.

Locations with Problematic Devices

This section tabulates all locations that have at least a single instance of a device that went offline over the past 72 hours, meaning the device can be online right now but was offline at least once over the last 72 hours.

The “Offline” column in the table shows the number of devices that are currently offline per location. For example, in the San Jose location, there are currently 19 devices offline, but 39 devices have gone offline in the past 72 hours.

By default, the table is sorted descending by the number of devices that are offline currently. Both the “Offline” and “Offline in Last 72 Hours” numbers are clickable and provide a hierarchical path to the list of problematic devices, allowing you to proactively investigate based on the location and the offline device state within the selected time interval.

Devices History

The Device History section provides a list of offline devices with detailed information now and in relation to a historic (within last 7 days) time period, to allow you to see the overall trending of offline events of the devices listed.

You can filter by location and offline period, or click to see specific results identified on the trend line. It helps you to investigate immediate anomalies with individual devices and also offers trend information for the selected location or for the company overall.

  • View the history of a particular location with registration issues to better understand the nature of the problem.
  • Review detailed information of individual devices with registration issues to determine a course of action.
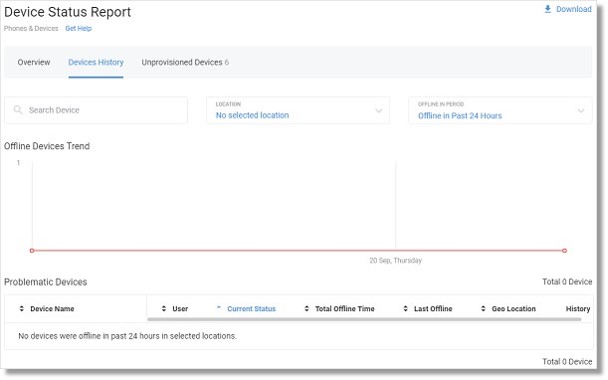
Review detailed information of individual devices with registration issues to determine a course of action.

Unprovisioned Devices

Devices that have not been provisioned can be found in this section. These are devices that were recorded in the AT&T Office@Hand system but have never been set up and have not been tied to any of the extensions, or were unconnected at some point and were never reassigned or removed from the system.

The table that appears has three columns to identify the devices:

  • Device Name and ID Number
  • Shipping Address, when available
  • Device Model

The Unprovisioned Devices page can be downloaded in a .CSV format. It collects the information for not currently provisioned devices.
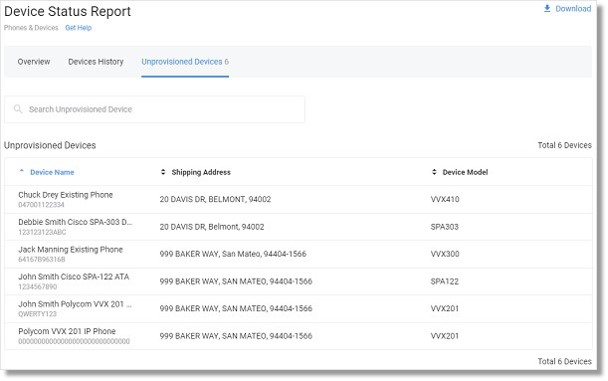
The Unprovisioned Devices page can be downloaded in a .csv format. It collects the information for not currently provisioned devices.


Back to top

Create Performance Report+

AT&T Office@Hand Performance Reports is an additional tool that enables you to research call records to determine your business unit performance. Performance Reports assists you in combining User, Queue, and Call Activity to evaluate performance using Key Performance Indicators (KPI) and targeted filters.

How to Create a Performance Report

  1. Go to Admin Portal > Reports > Analytics Portal > Performance Reports.
  2. Click the Calendar to set the date. You can select preset time periods or select Custom Ranges. Click Done to set.

    Click the Calendar to set the date. You can select preset time periods or select Custom Ranges. Click Done to set.

  3. Select the preferred Company Numbers report — Queues, Users, or Calls.
  4. Configure the settings for the selected report.
    Set KPIs for the Queues report
    Set KPIs for the Users report
    Configure a Calls report

    • Set KPIs for the Queues report
      Set the filters for Queues, Call Type, and Call Length, as needed. Click Select KPIs, then select the preferred KPIs from the list. Click Done.
      Data will be shown under the Trend and Queues sections once set.
      TIP: Click Show KPIs description to learn more information about each metric on the list.
    • Set KPIs for the Users report
      Set the filters for Queues, Call Type, and Call Length, as needed. Click Select KPIs, then select the preferred KPIs from the list. Click Done.
      Data will be shown under the Trend and Queues sections once set.
      TIP: Click Show KPIs description to learn more information about each metric on the list.
    • Configure a Calls report
      The Calls tab lets you search for calls, filter Users, Call Type, Queue Calls, and Call Length. The search result will then display the following information:

      • the callers’ numbers
      • the numbers called the
      • result of the call
      • the length of the call
      • the inbound handle time
      • the call’s start time
      • the call’s direction
      • the number of queues the call went through
      • the session map
  5. Download or Save your report.

    Download or Save your report.

    Note:

    • Reports can be downloaded in PDF or Excel formats.
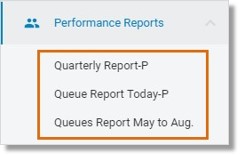
    • When saving a report, you can enter a new name or overwrite the report using the same name. Saved reports can be accessed from the left pane by clicking Performance Reports.

      When saving a report, you can enter a new name or overwrite the report using the same name.

    • You can also subscribe to reports. See Analytics Portal – Create Subscriptions – AT&T Office@Hand for more information.

Back to top

Meetings Performance Report+

This section will provide an overview of the AT&T Office @Hand Meetings Performance report on the AT&T Office@Hand Analytics portal.

The Meetings tabs in the Performance Reports section of the account allows Administrators to have a complete view of the of their team’s activities such as:

  • Meetings they have scheduled
  • Meetings they have participated in
  • The Topic or Meeting ID
  • The number of participants and participant’s names
  • Date and time of the meeting
  • How long the meetings lasted
  • Participant’s activities

This report can be downloaded as a .csv file.

To view Meetings Performance Reports, follow the steps below:

  1. Log in to AT&T Office @Hand online account.
  2. Click Reports > Analytics.
  3. On the Analytics page, hover on the buttons tab on the left and select Performance Report.
  4. Click the Meetings tab.
  5. Set the date and time range for the report that you want to view, then click Done.
    You can set a custom range up to 6 months or select from preset time frames – Today, Yesterday, Last 7 Days, Last Work Week, This Month and Last Month.
    OPTIONAL: You can view specific reports by searching for the Meeting ID, Topic and User name and filter the results by Users, Groups, and Departments.

    You can view specific reports by searching for the Meeting ID, Topic and User name and filter the results by Users, Groups, and Departments.

  6. Click the drop-down arrow to expand the result and view more details.

    Click the drop-down arrow to expand the result and view more details.

Back to top

Adoption and Usage Reports on the Analytics Portal+

This section describes the metrics you can use to measure your organization’s adoption and usage of AT&T Office@Hand products.

Adoption & Usage analytics gives visibility into AT&T Office@Hand usage and adoption across your organization. You can gain intelligent insights such as – if and how are ATT Office@Hand products being used (at org level or across sites and departments), who are the power users, trends and patterns of usage, who are the low/non users, which locations/departments could benefit from a training session, user preferences such as preferred devices, most used endpoints etc.

Availability and Requirements

Available on demand for AT&T Office@Hand accounts. Contact support to enable on your account.

View and access Adoption and Usage on the AT&T Office@Hand Analytics Portal

  1. Log in to your AT&T Office@Hand account as an administrator.
  2. Click Reports > Analytics.
  3. Go to Adoption & Usage tab.
  4. On the Adoption & Usage analytics, you can see the following tabs:
    • Overview – Dashboard covering Call and AT&T Office@Hand Meetings.
    • Message – AT&T Office@Hand app messaging feature
    • Phone – AT&T Office@Hand Telephony/PBX
    • Video – AT&T Office@Hand Video conferencing

Overview

The following is available with Adoption & Usage analytics:

  • An aggregated summary of usage
  • The number of enabled users & trends over time
  • The number of active users & trends at org level and org unit level
  • Usage frequency in a 6-month window
  • Calendar presets and custom date ranges to view data at different timeframes


  • Yesterday
  • Last 7 Days
  • Last Work Week
  • Last 30 Days
  • Last Month
  • Custom Date Range

Phone

  • Provides a detailed view of Call usage
  • Customizable KPI panel with breakdown of calls
  • Active user rate and trends
  • Top/bottom active users table sortable
  • Usage Frequency
  • Usage by Endpoints
  • Detailed user table with granular details of usage at user level

Video

  • Ability to drill down each widget at site or department level
  • Provides a detailed view of Meetings usage
  • Customizable KPI panel with breakdown of Meetings
  • Active user rate and trends
  • Top/bottom “Host” users and “Participant” users
  • Usage trend of Meeting features -% of meetings with video ON, Audio ON, Screen Share ON or Recording ON
  • Usage Frequency
  • Usage by Endpoints
  • Detailed user table with granular details of usage at user level
  • Ability to drill down each widget at Site or Department level

Back to top


See Also:
Analytics Portal – Overview | AT&T Office@Hand

Keywords: 11110, 17521, 17526, reports on company numbers, generate company numbers report, AT&T Office@Hand, Online account, Admin Portal, Analytics Portal, 11100, 11185, 11111, 11114, 11112, 11127, Meetings, Performance report, Meetings Performance Report, ATT Analytics