Navigating the Calls table in Quality of Service Analytics
After you have set filters, the Calls table populates with rows for each call that meets the filter criteria.
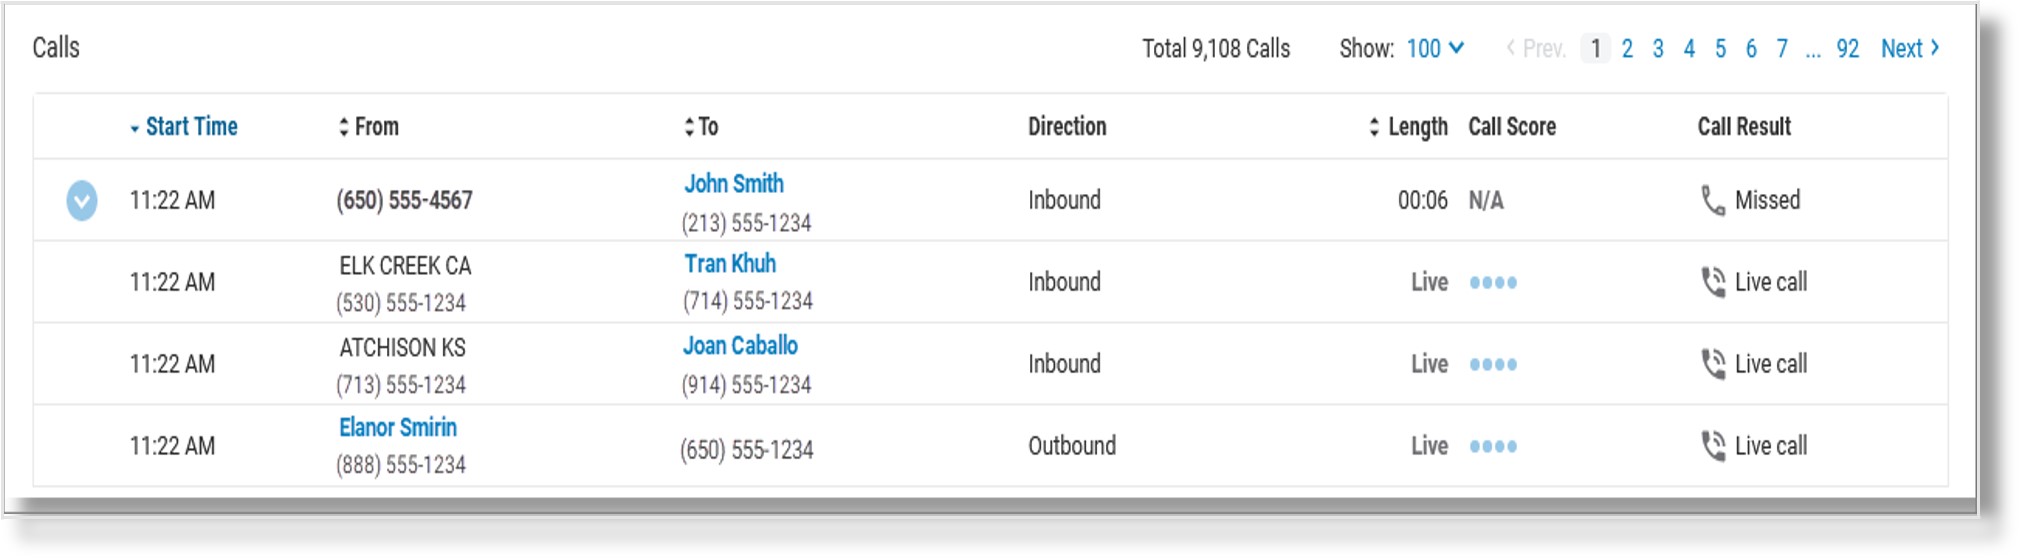
The rows show data for:
- Start Time: Time the call began
- From: Call initiator
- To: Call recipient
- Direction: Inbound, outbound, or company-internal
- Length: Duration of call
- Call Score: Overall quality score
- Call Result: Nature of the connection, such as live, connected, missed, or voicemail
Call card
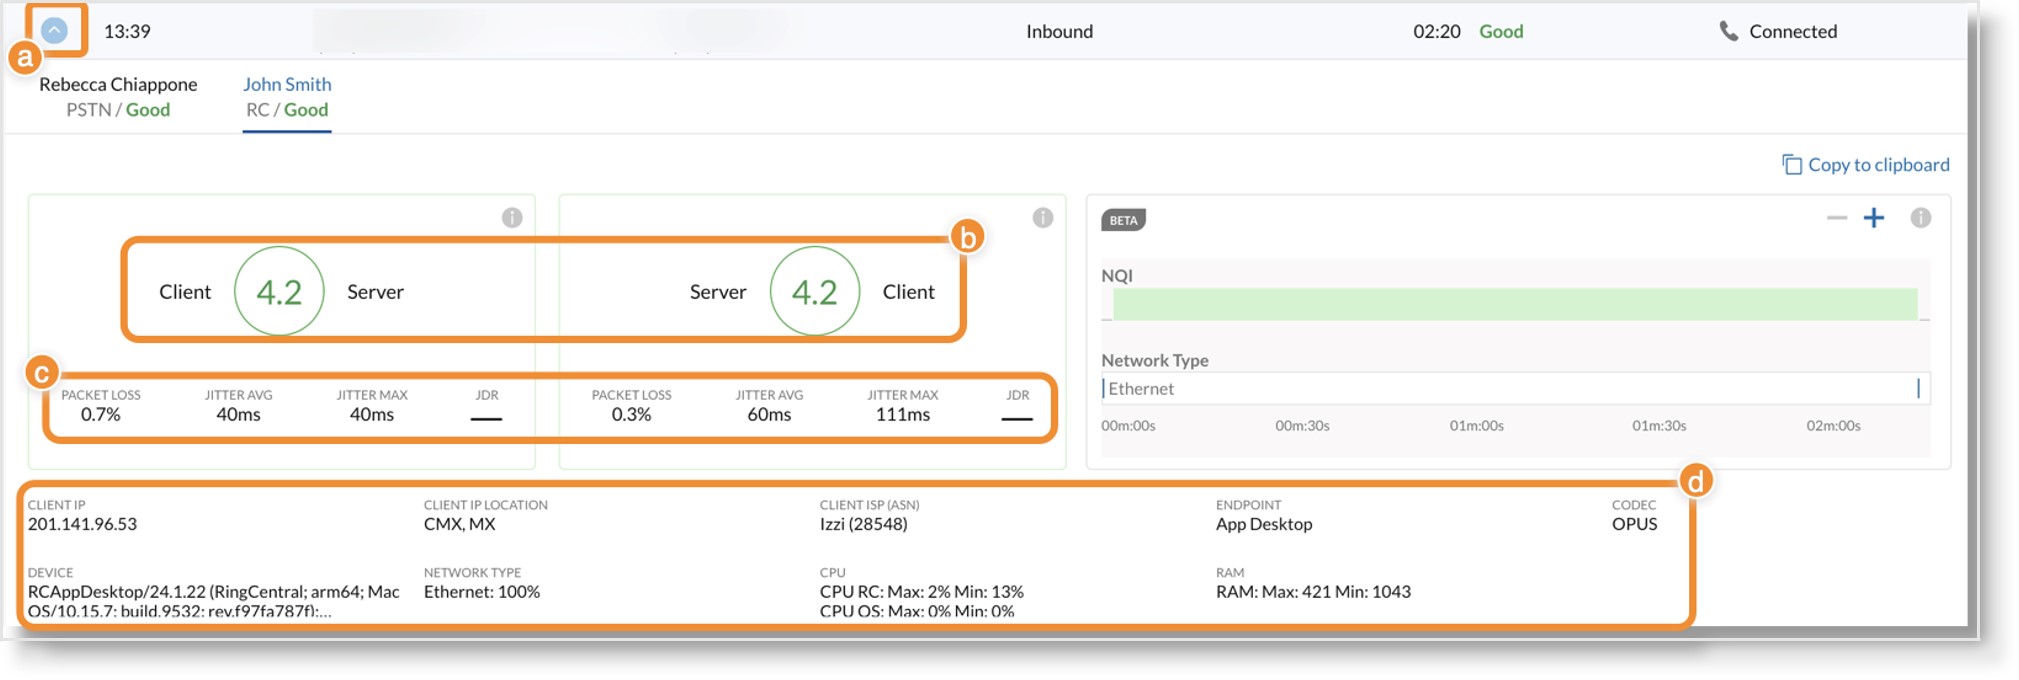
A call card with detailed information for both parties is generated after each call concludes, except for currently connected (live) calls. A down arrow at the far left of an entry indicates it has a call card. Click the down arrow (a) to see the entire card.
The call card record shows each party’s upstream and downstream data quality and other metadata (b). Information on the card includes start time, phone numbers (to/from), and direction of the phone call. Clicking Copy to clipboard on the far right copies card data to the clipboard.
Additional metrics on the call card include:
- Packet loss (c): Occurs when one or more packets of data traveling across a network fail to reach their destination.
- Jitter (c): Variation in the arrival rate of packets at a destination endpoint or cloud media processor.
- Latency (c): The time it takes for a packet to get from one endpoint to another on the network.
- Jitter Buffer Discard Rate (JDR) (c): Percent of delayed packets discarded because of long delay.
- Client IP (d): Public IP address associated with the user’s endpoint.
- Client IP Location (d): Location that the Client IP maps to via Maxmind.
- Client ISP (d): ISP used for a call leg.
- Endpoint (d):AT&T Office@Hand client type. Inapplicable endpoint data shows as a dash.
- Unavailable endpoint data shows as N/A.
- RAM (d): Minimum and maximum RAM memory consumed by the device with the endpoint.
- Codec (d): Coder/Decoder Module (as applied to audio data) involved in the call.
- Device (d): Endpoint device model (ex. deskphones).
Network quality and type graph
The call card might have an additional indicator called “NQI/Network Type Graph”. NQI stands for the network quality indicator. The NQI doesn’t directly affect the mean opinion score (MOS) and should be treated as extra, potentially useful information.
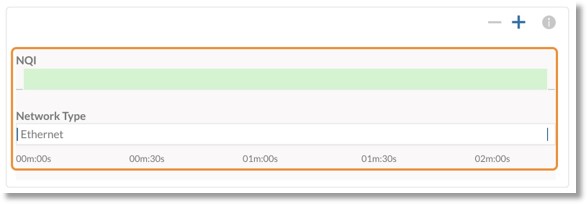
The NQI and Network Type graphs help to tell if call quality degradation happened due to poor network quality or frequent switches between network types. Examples include:
- Poor WiFi signal in the office.
- Poor cellular reception during a mobile call.
- Calls that suffered connection issues in a borderline WiFi/Cellular area with multiple switches between network types.
NQI doesn’t tell the following:
- The graph isn’t a direct indicator of mean opinion score (MOS). We recommend looking at packet loss to get that value, as jitter and jitter buffer discard rates (JDR) affect MOS value. The latency and jitter may affect the call quality even during a stable NQI connection.
- The graph doesn’t show the network’s speed: NQI can be in the green zone for both 3G and 5G connections, but the MOS value can be different due to a call’s bitrate.
- The graph won’t show the progress of MOS values during a call. Instead, it shows relative changes in connection.
Was this page helpful? Yes No