Creating and Managing Business Analytics KPIs Widgets │ AT&T Office@Hand
Article# 98767
This article provides information on how to manage your Business Analytics KPIs widgets in AT&T Office@Hand.
The Business Analytics KPI widget lets you create custom or preset Key Performance Indicators across various metrics. You can utilize the KPI widget for:
- Tracking performance: Users can build KPI widgets to track and monitor the performance of their queues or teams.
- Defining custom metrics: Users can create custom metrics utilizing all the filters available.
- Comparative analysis: Users can compare and analyze performance across different periods, regions, departments, and so forth. You can create multiple widgets and place them side by side on the dashboard.
Creating a KPIs widget
- Click the Add Widget tile in your Business Analytics dashboard.
- In the Add Widget popup, select KPIs.
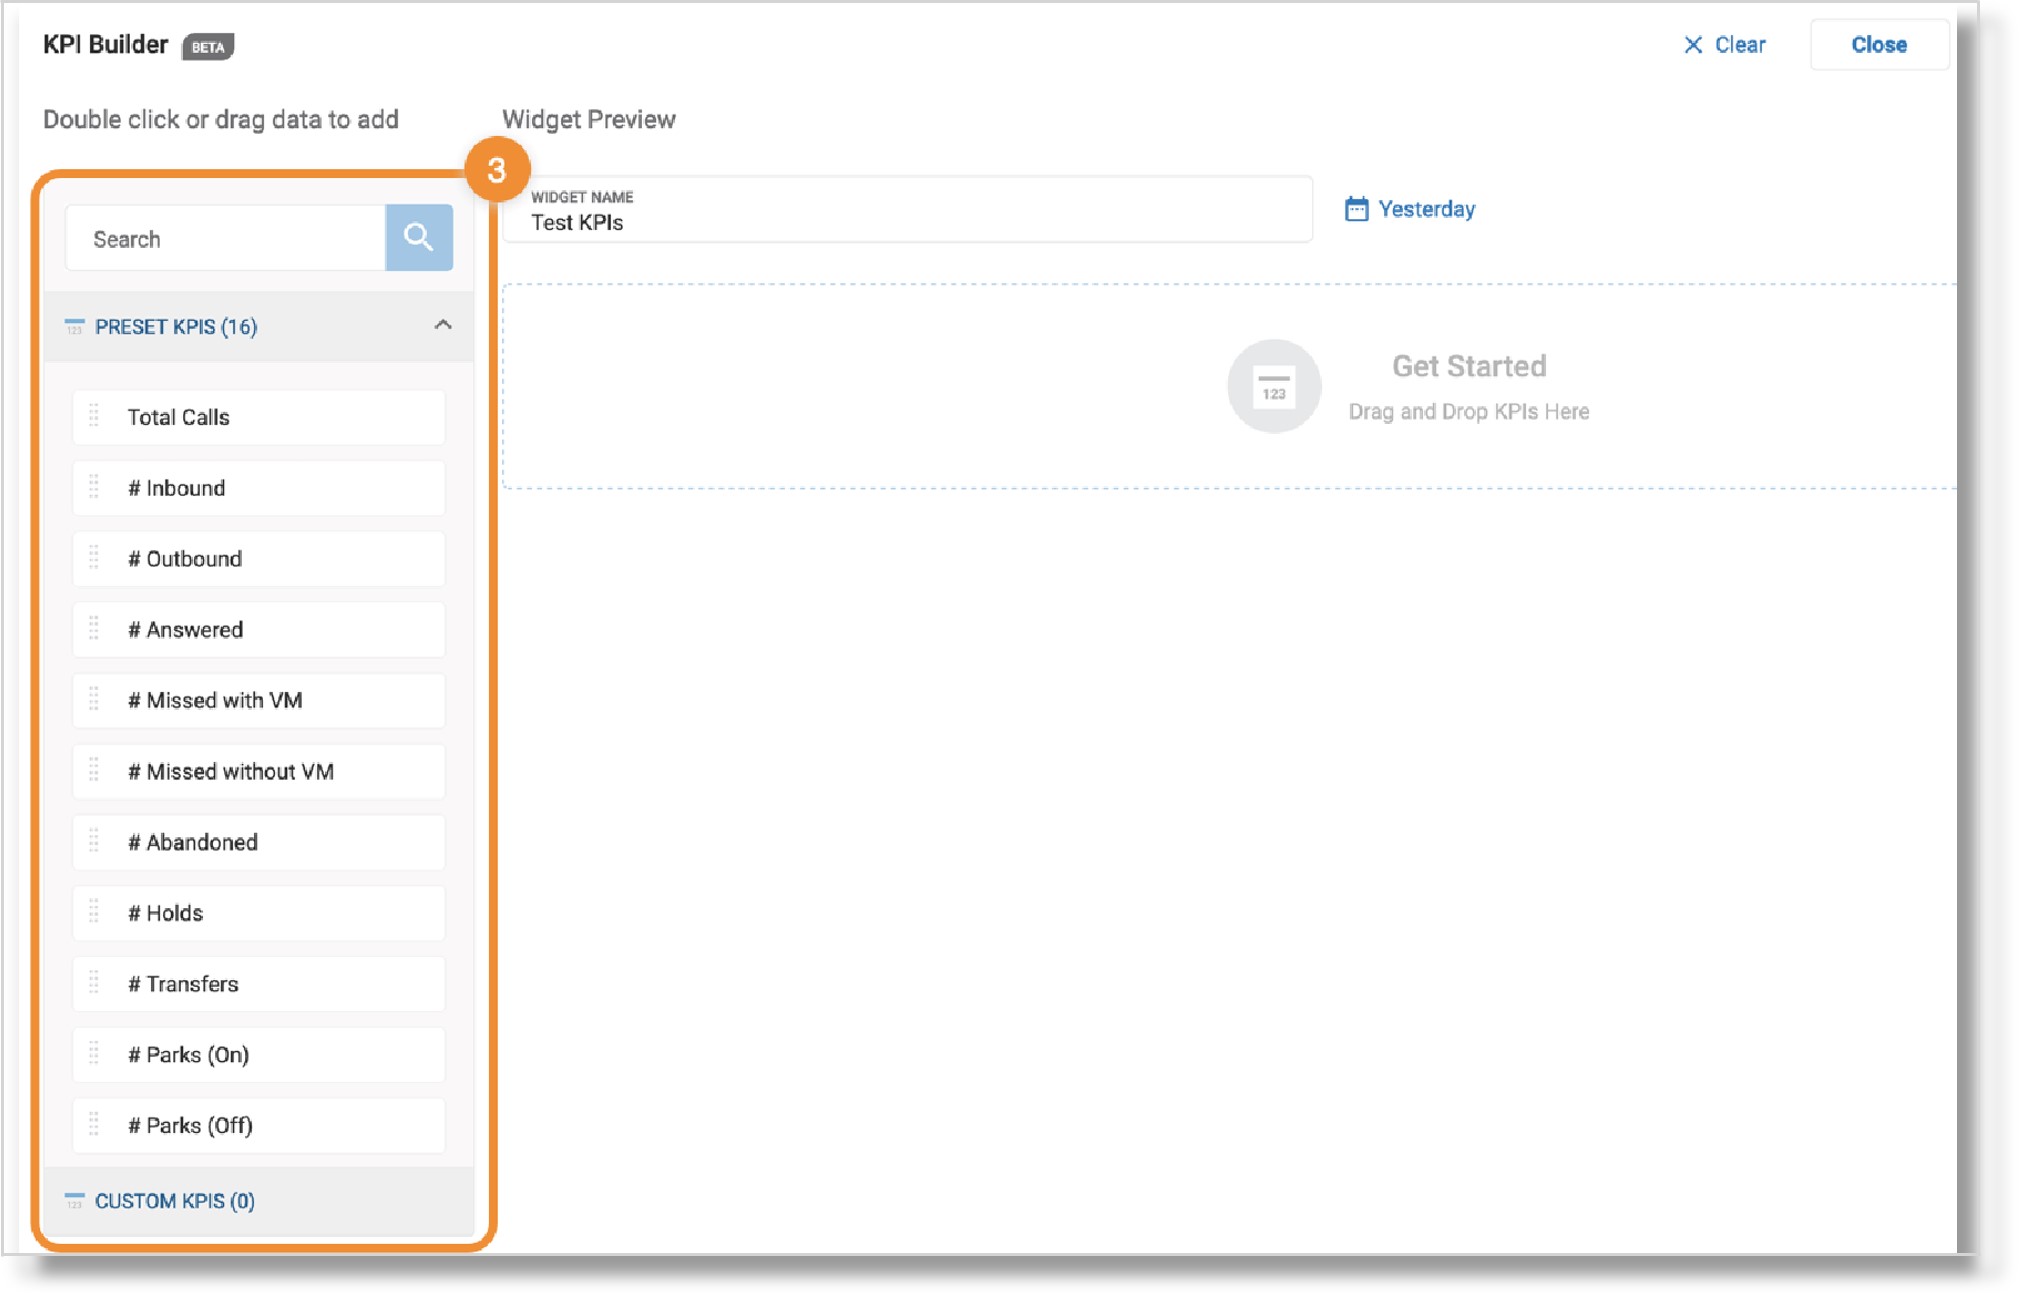
- Name your KPI widget in the Widget Name field.
- From the left bar, double-click or drag and drop any of the Preset KPIs to add them to your dashboard.
NOTE: Once you add a preset KPI, you can click it to see a description.

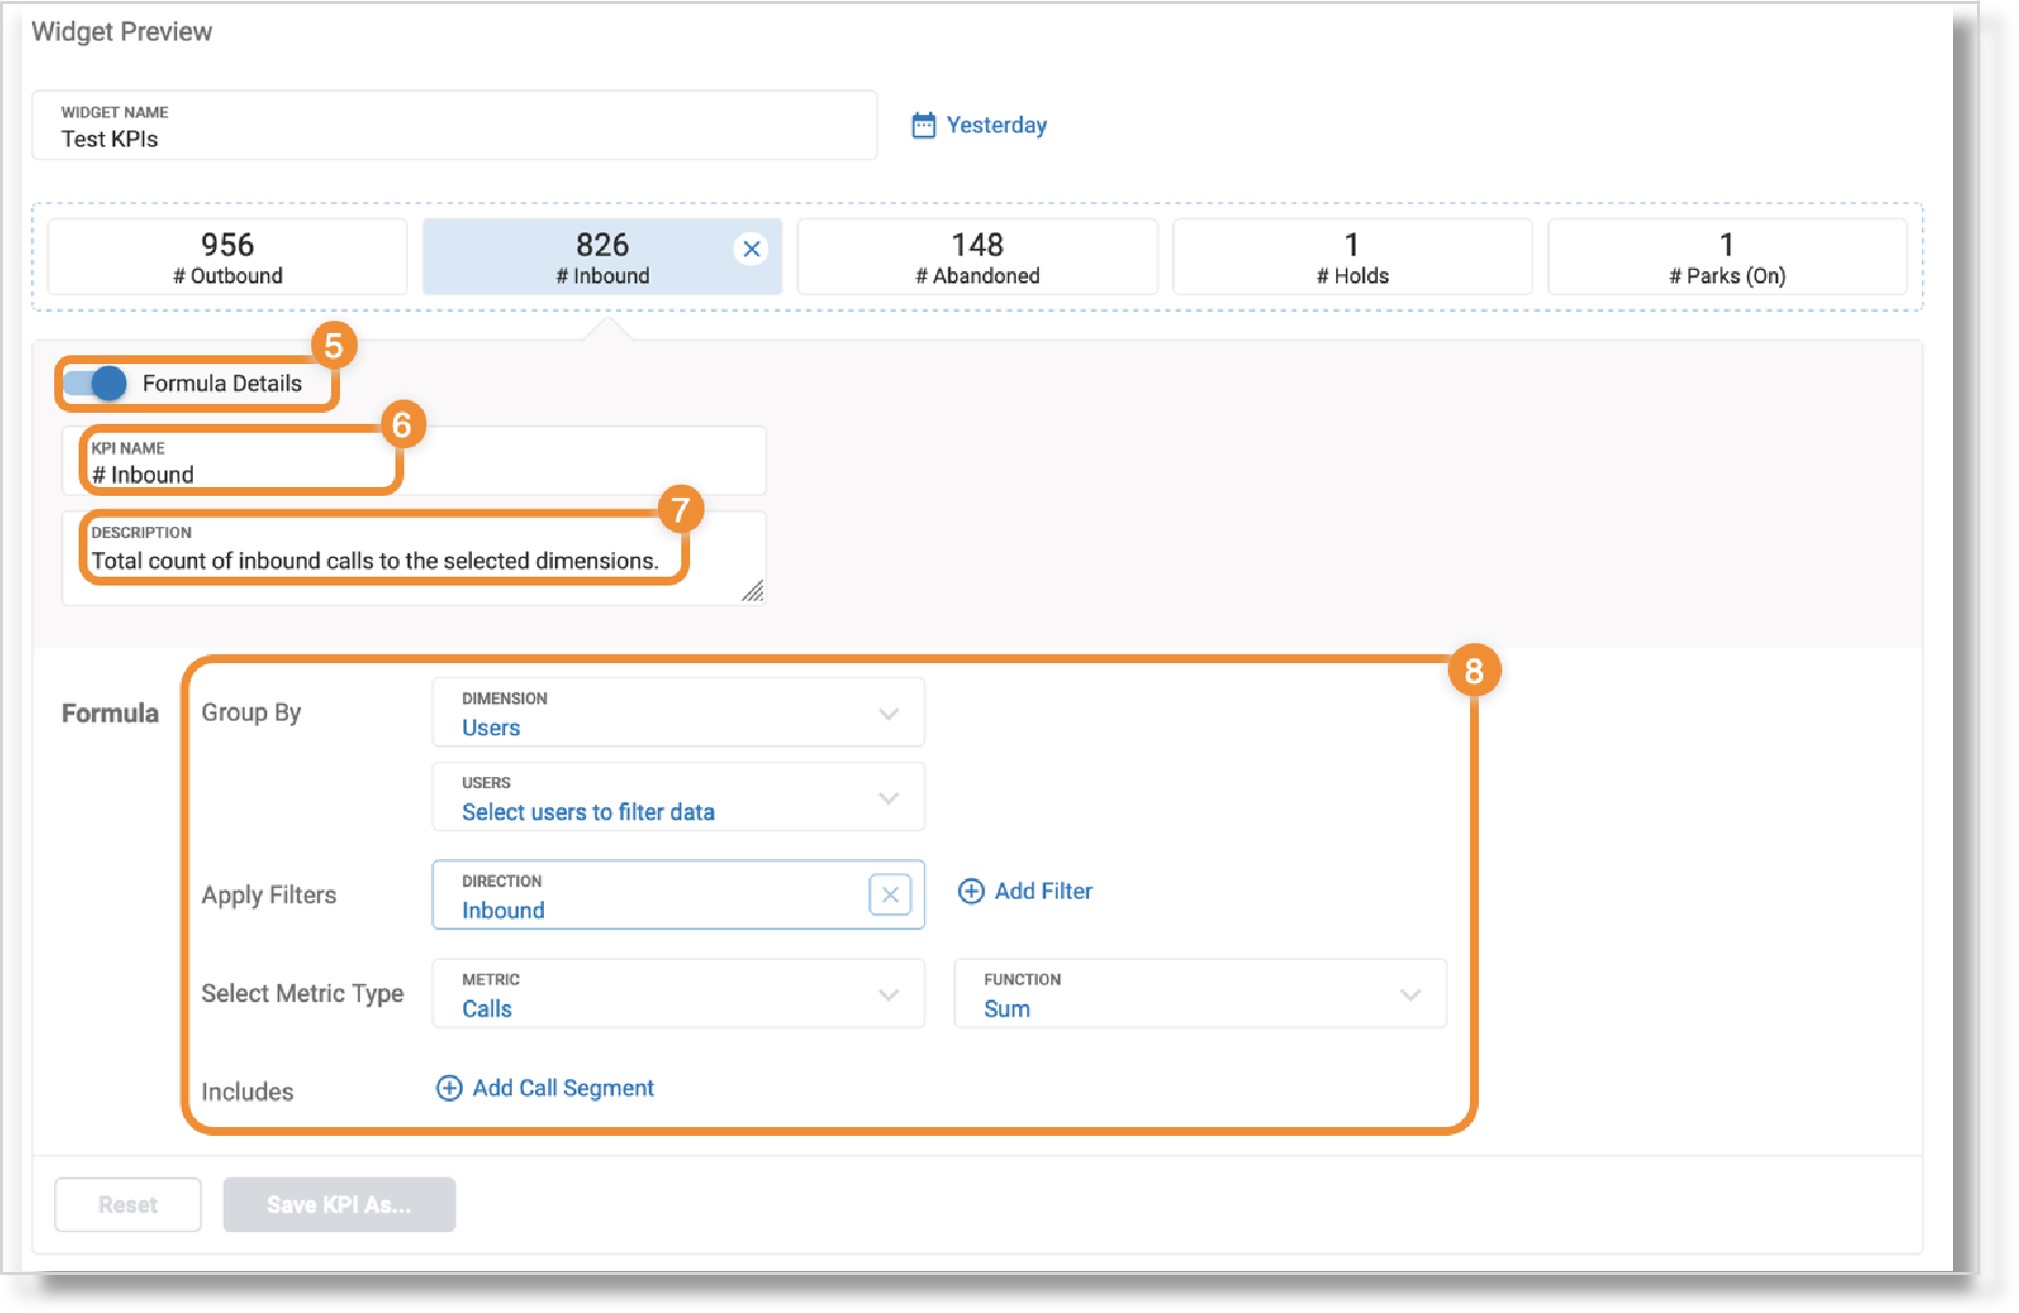
- Click the toggle next to Formula Details to create a custom KPI.
- Enter a new name in the KPI Name field.
- Enter details about your custom KPI in the Description field (optional).
- You can change the Formula fields, including:
- Group By: Change the dimension and the users to include in the KPI metrics.
- Apply Filters: Change how you filter data based on origin, direction (inbound/outbound), call types, and so forth.
- Select Metric Type: Set a different type of metric for the custom KPI to display, as well as the number type (i.e., sum, average, percentage, etc.).
- Includes: If you have call segments, you can look at data specifically for that group.
NOTE: For descriptions of each formula field, refer to the Business Analytics data dictionary.

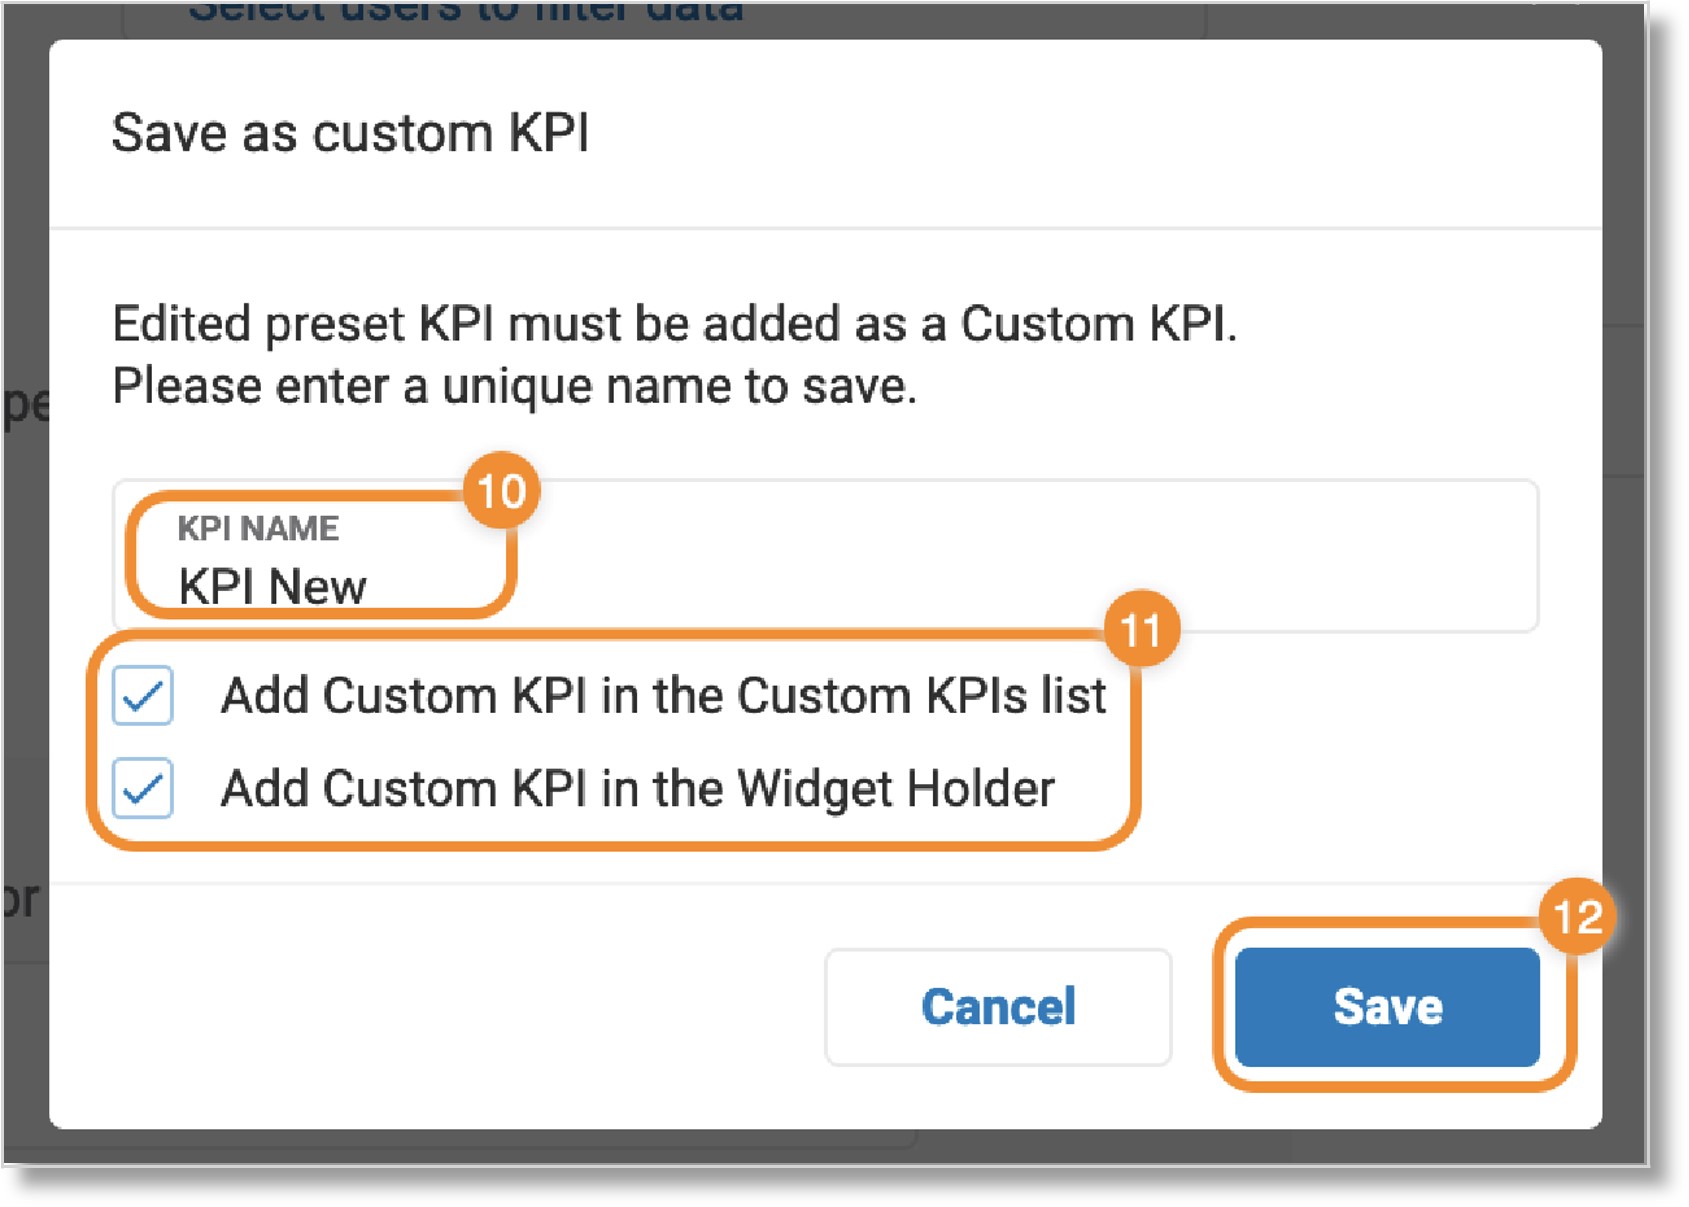
- Click Save KPI As. A window will open.
- Name your new KPI if you didn’t do so in step 5.
- Check the box(es) if you want to:|
NOTE: You must have at least one box checked to save the custom KPI.
- Add Custom KPI in the Custom KPIs list: Save the custom KPI to your list for future widgets.
- Add Custom KPI in the Widget Holder: Display your custom KPI in the current widget.
- Click Save.

- Repeat steps 5-7 as needed to add more custom KPIs.
- Click Save at the top right.
Managing KPI widgets
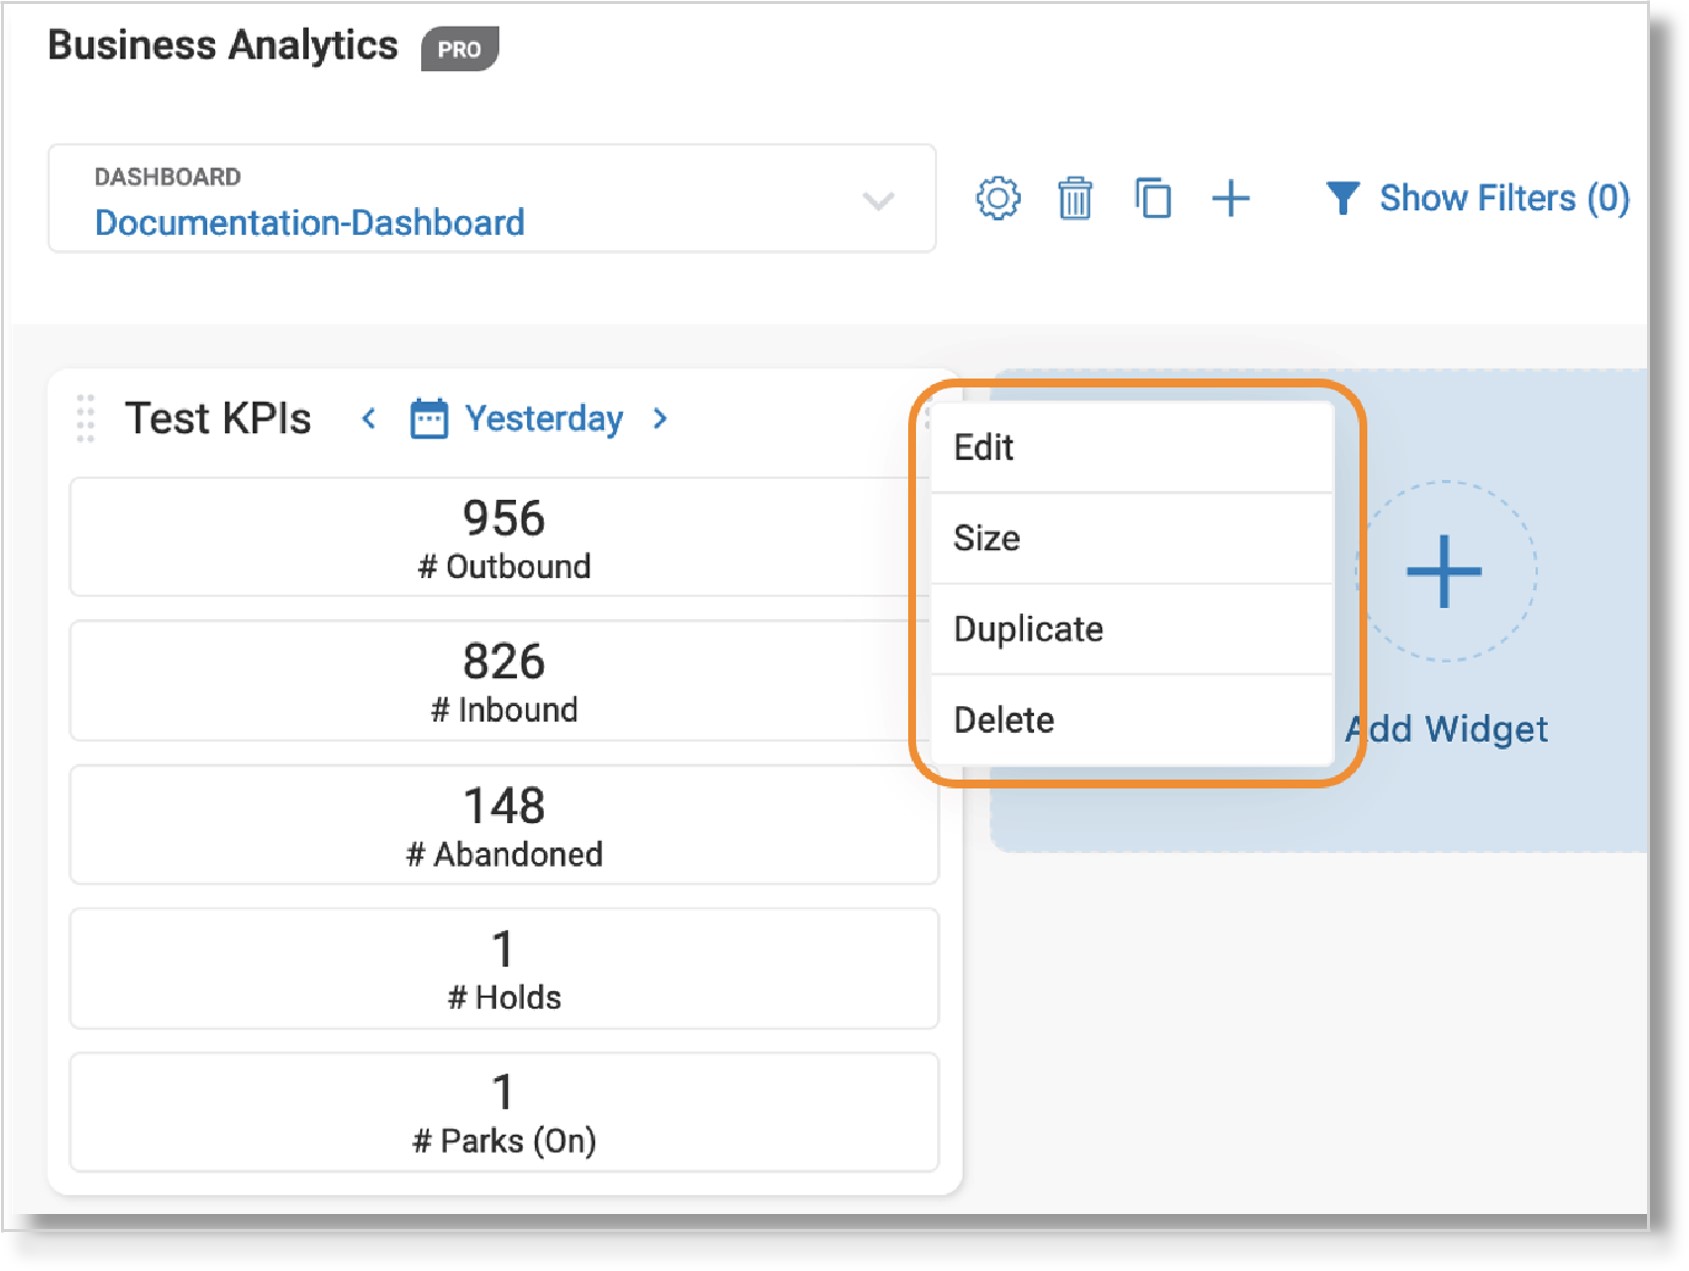
Once you save a KPI widget, it will appear in your dashboard on the Business Analytics page. From here, you can perform several actions by clicking the three-dot More icon at the top right of the widget.
- Edit: Open the KPI widget page to make changes.
- Size: Resize the widget in the dashboard.
- Duplicate: Create a copy of the KPI widget.
- Delete: Erase the KPI widget.

Additional resources:
Key Words: AT&T Office@Hand, Business Analytics, Analytics, KPIs, Widgets, Business Analytics
Was this page helpful? Yes No


