AT&T Fleet Management for Enterprise/Government Reports Overview
AT&T Fleet Management for Enterprise/Government includes many built-in reports. This tutorial includes a breakdown of the available reports, the information that can be found in them, and how to access them.
Here is a list of the build-in reports:
Vehicle & Assets Report
Use: Provides a list of vehicles with a device installed as well as vehicle information including settings.
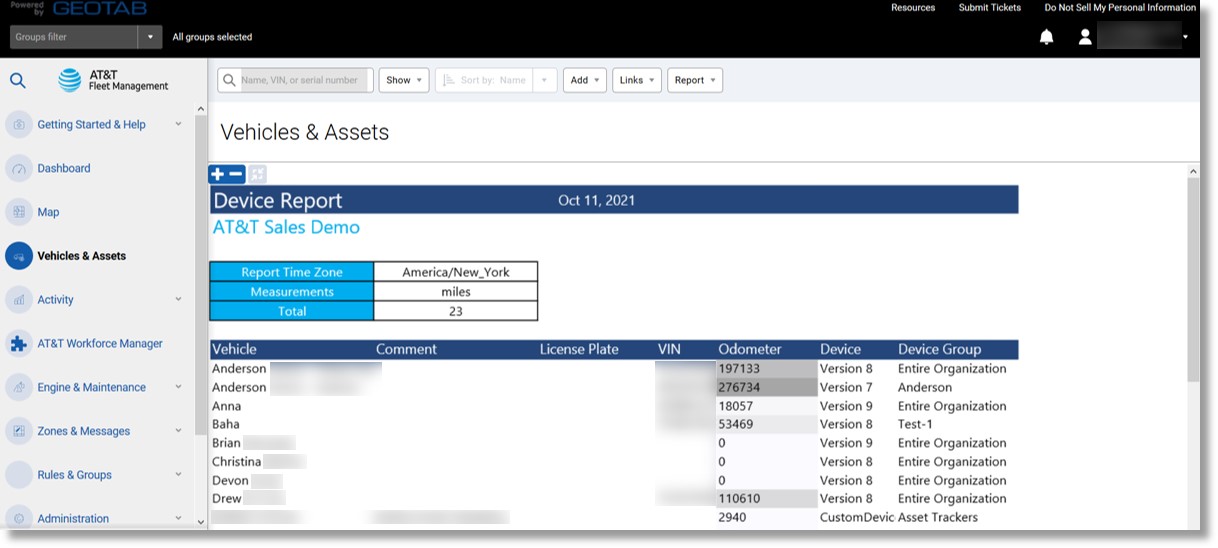
Information included: Vehicle name, VIN, Odometer, type of GO device, license plate (if entered).
Additional Information when exported: Vehicle information, current odometer, device group, last stop address, current activity, firmware version, etc.
Accessing the report:
- Click on Vehicles & Assets in the column on the left.
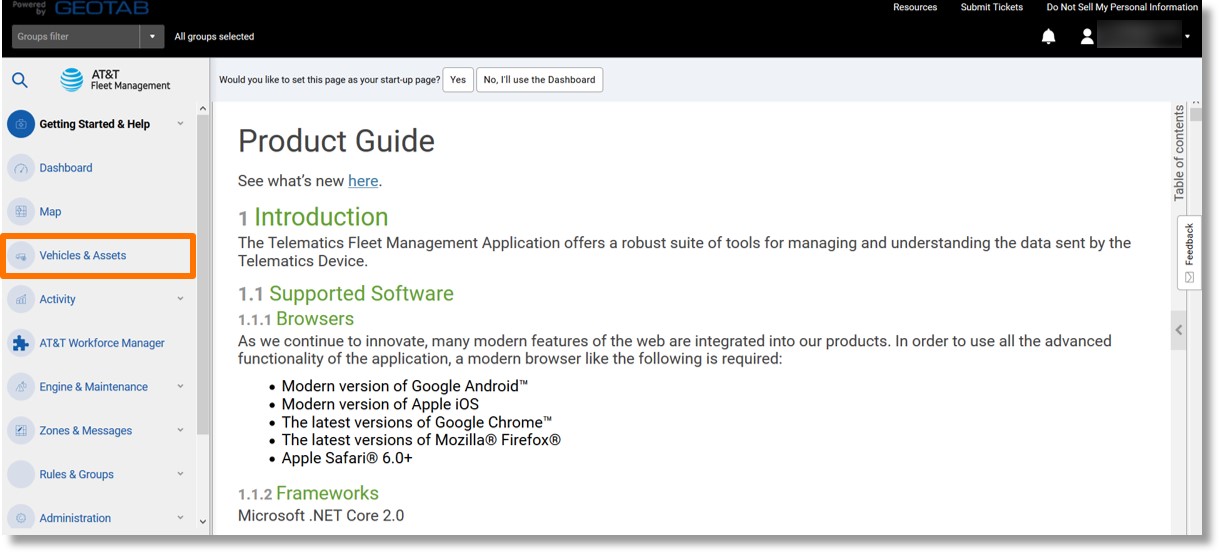
- The vehicle list displays.
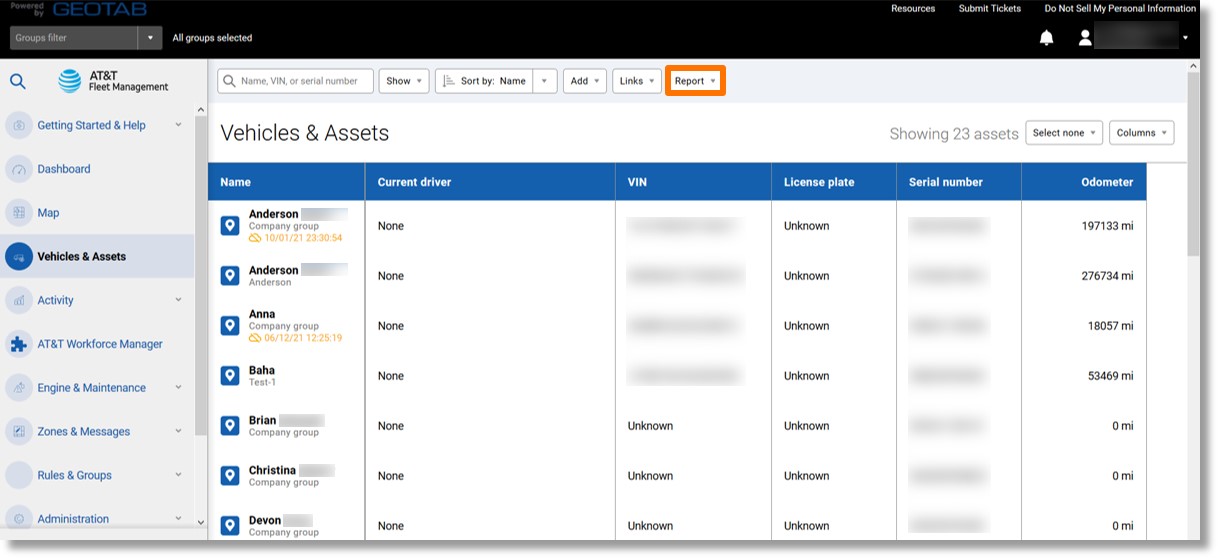
- Click on the Report dropdown.
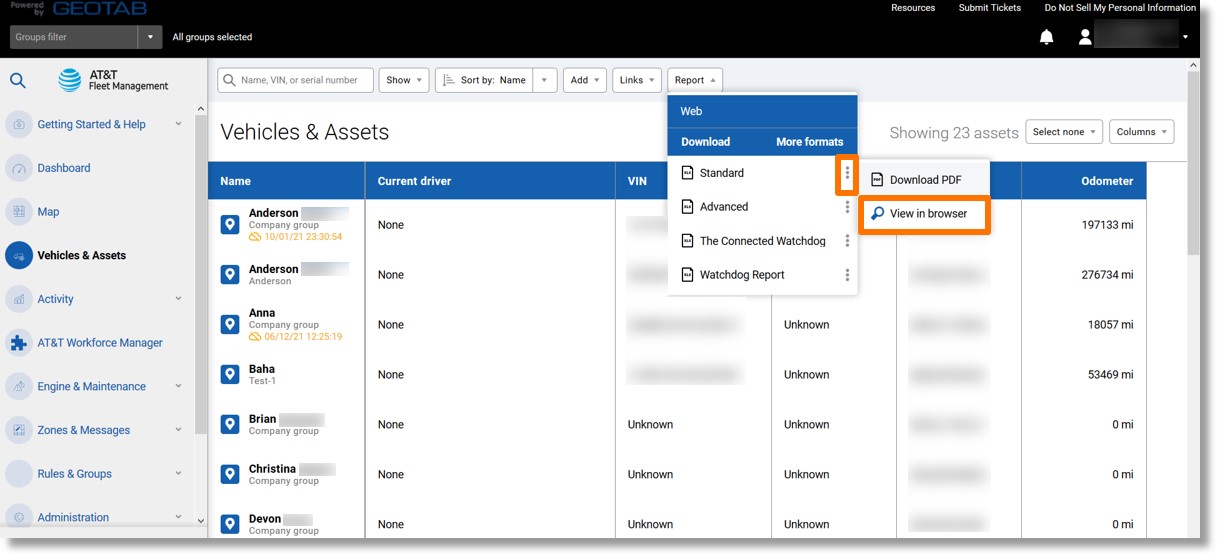
- Click on the ellipsis icon
 to the right of the desired report.
Note: In this case, we used the Standard report.
- Click on View in browser.
- The report displays.
Top
Watchdog Report
Use: This report helps you monitor the health of your telematics devices.
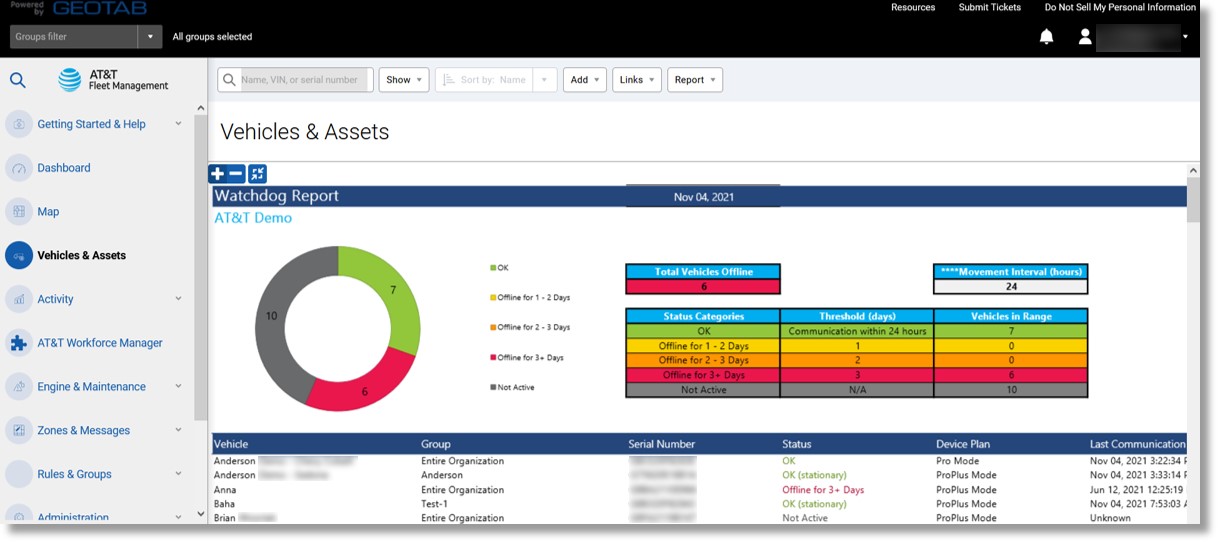
Information included: Device, group, last known address, last communication date, days since moved, days since communicated, serial number, device status, and link to a map view.
Additional Information when exported: Device plan, last stop latitude, and longitude, zone, VIN, device type, etc.
Accessing the report:
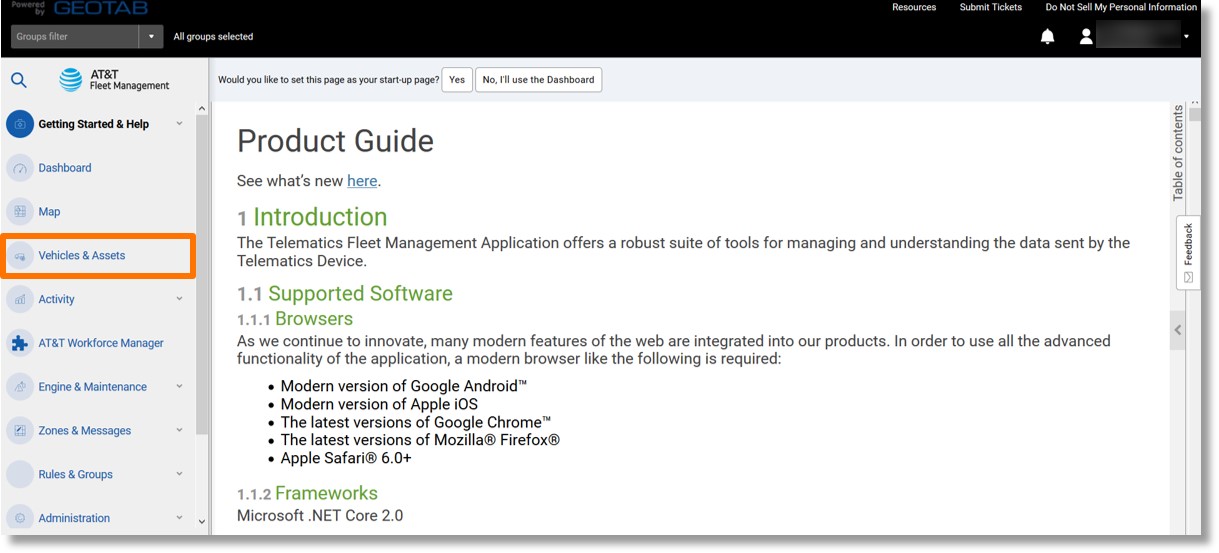
- Click on Vehicles & Assets in the column on the left.
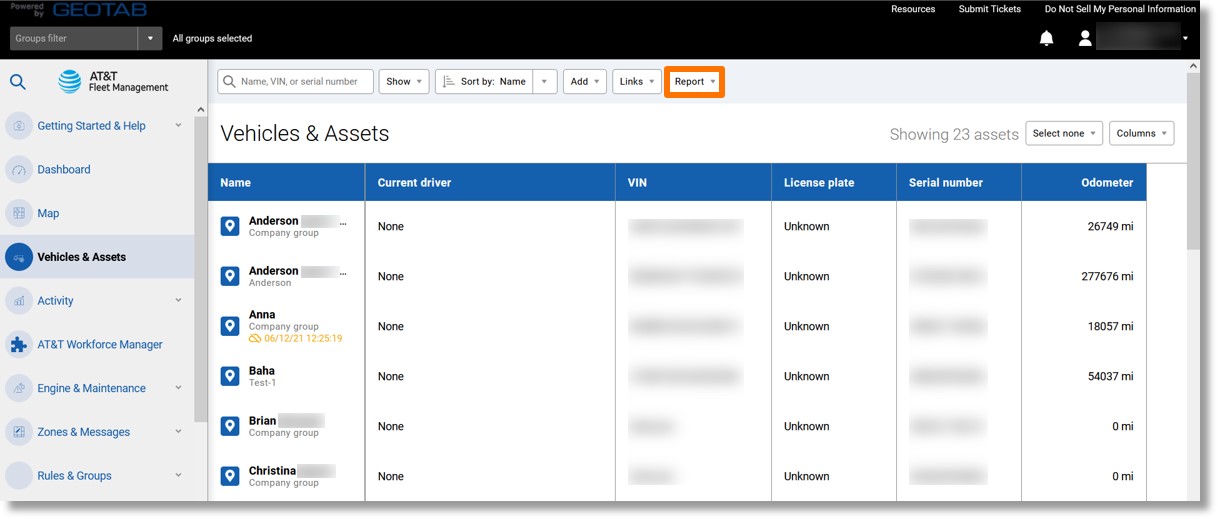
- Click on the Report dropdown.
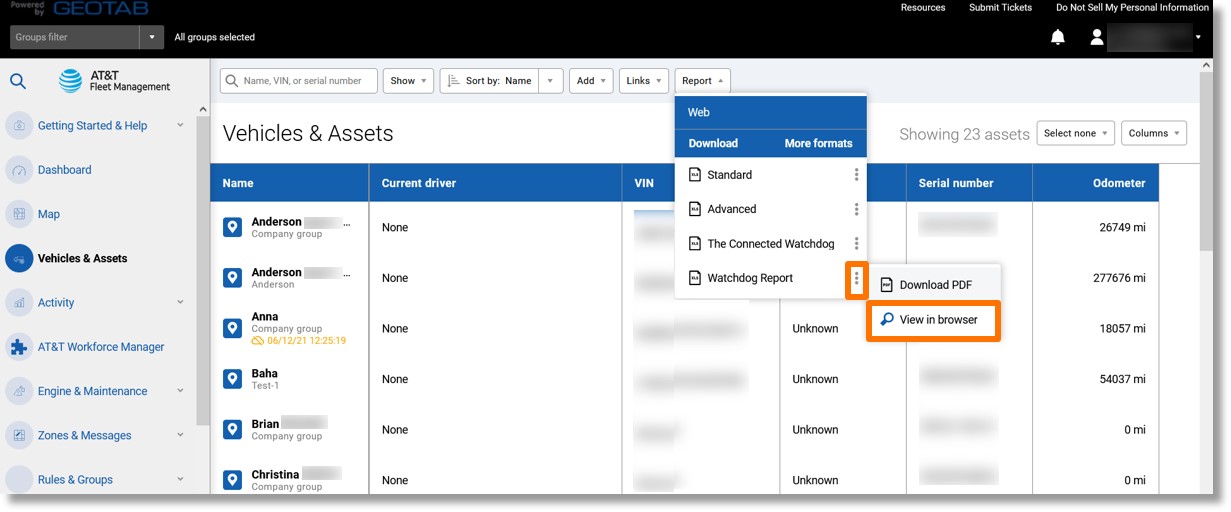
- Click on the ellipsis icon
 to the right of “Watchdog Report”.
- Click on View in Browser.
- The Watchdog report displays.
Top
Device Install History Report
Use: Provides details of the device install and assists in monitoring install progress and confirmation of installation completion.
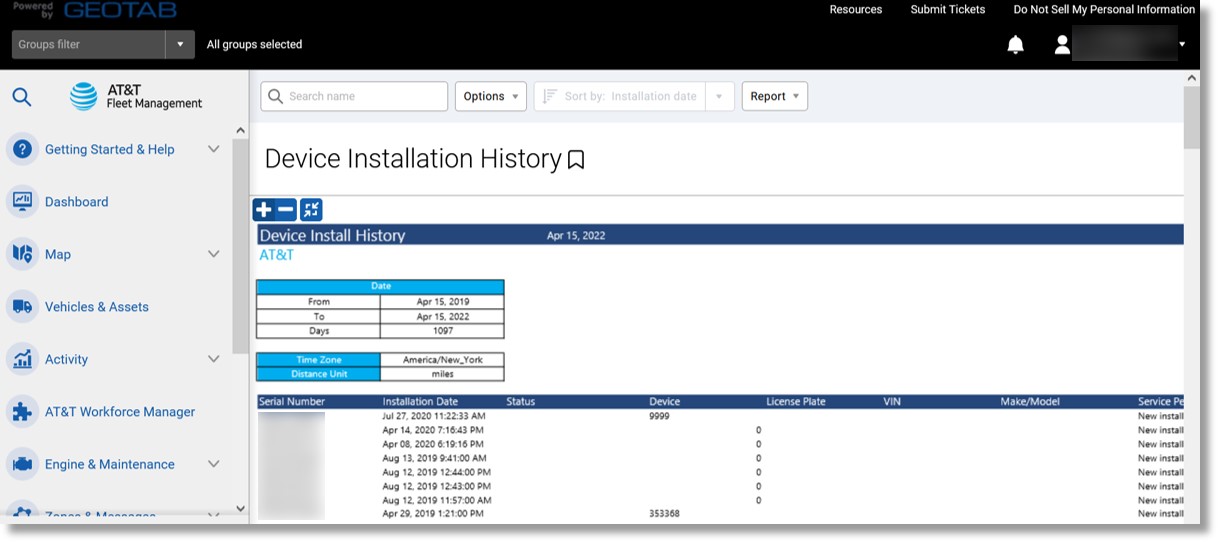
Information included: Vehicle name, date of installation, installer name, device serial number, and status of the device.
Additional Information when exported: Install company, device group, last GPS record, etc.
Accessing the report:
- Click on Vehicles & Assets in the menu on the left.
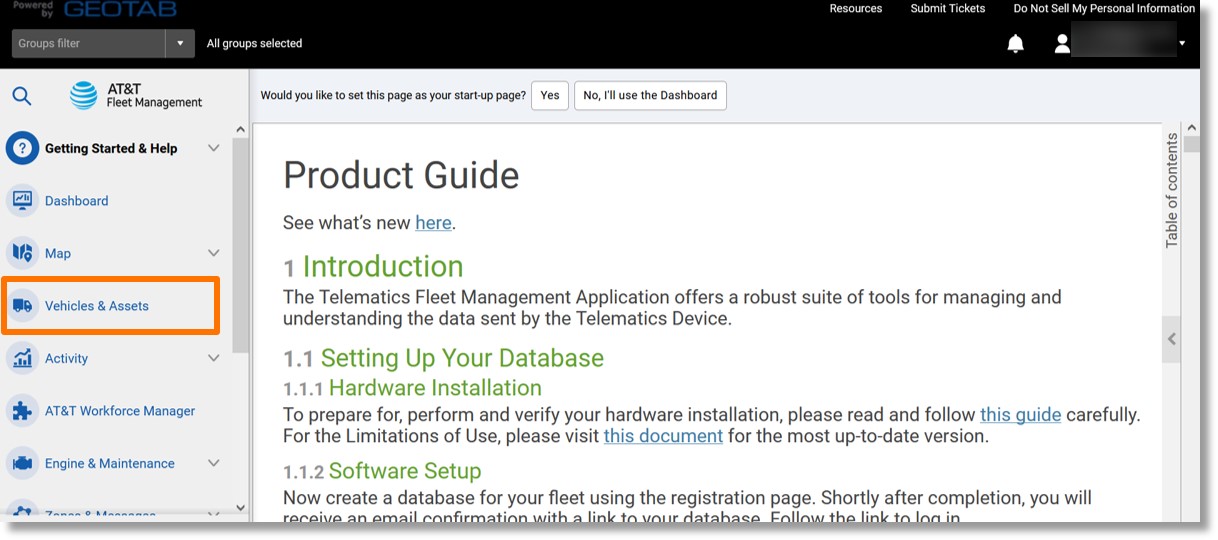
- The Vehicles & Assets list displays.
- Click on the Installation dropdown at the top right.
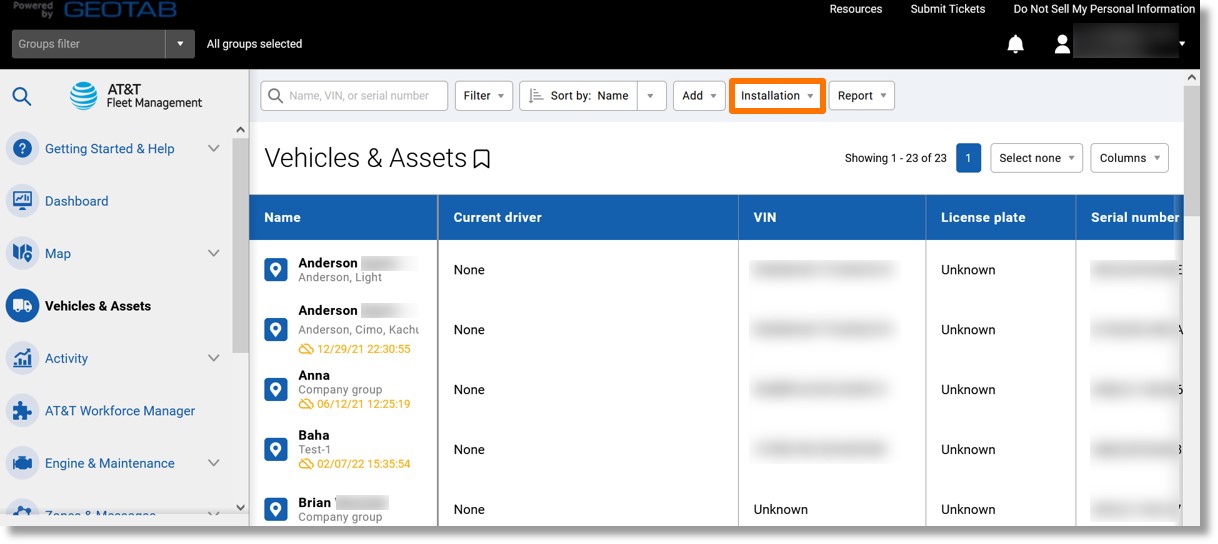
- Click on Installation history.
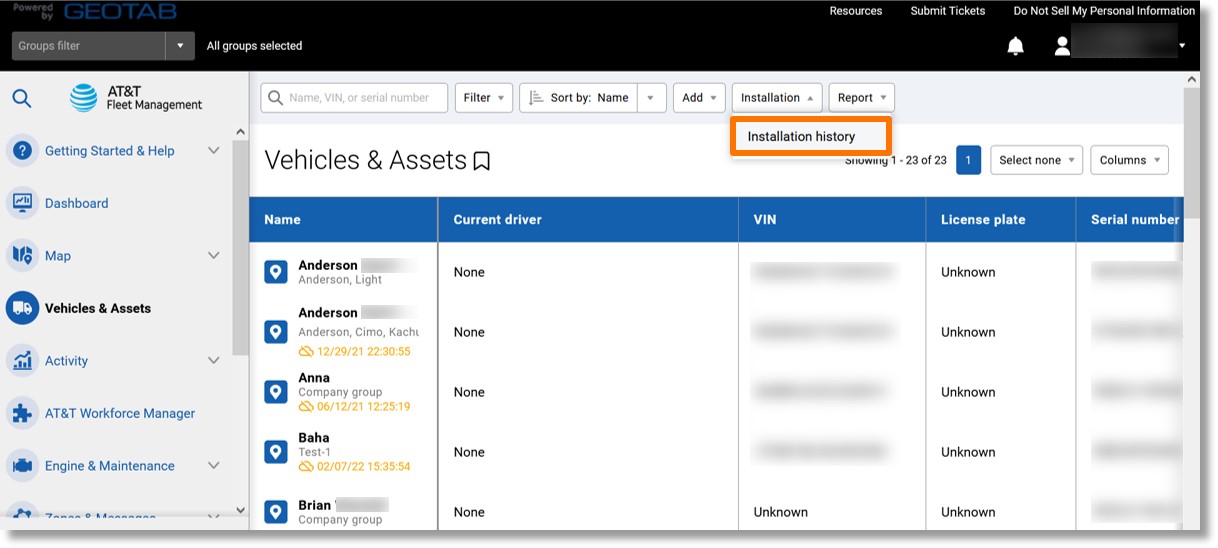
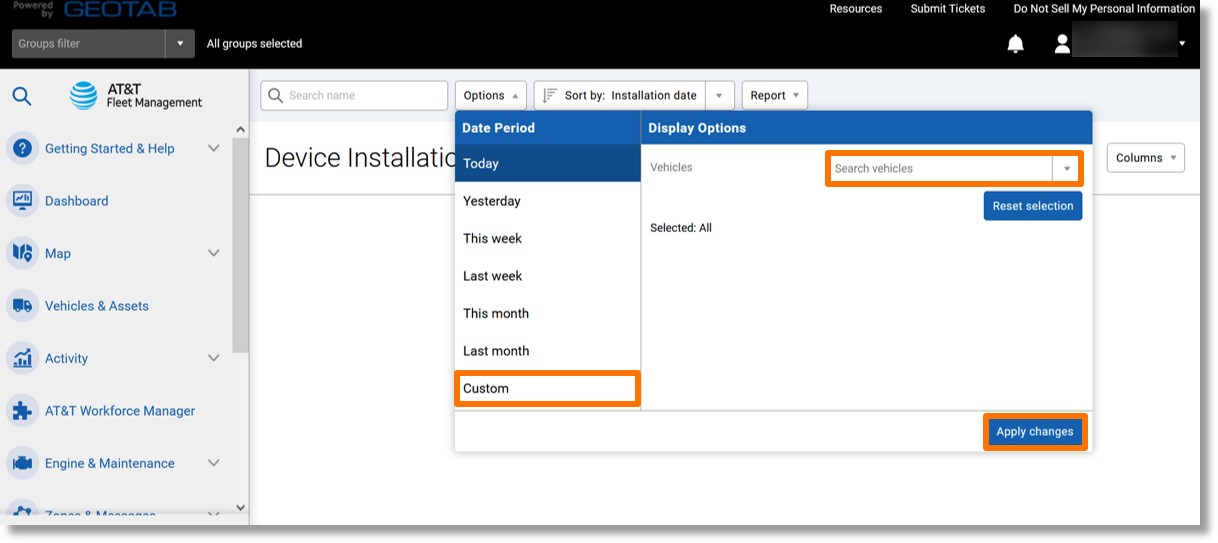
- The “Options” menu displays.
- Click on the desired timeframe under “Date Period”.
- Click on the dropdown to the right of “Vehicles” and select the desired vehicles.
- Click on the Apply changes.
- Click on the ellipsis icon
 to the right of either “Standard” or “Advanced”.
- Click on View in browser.
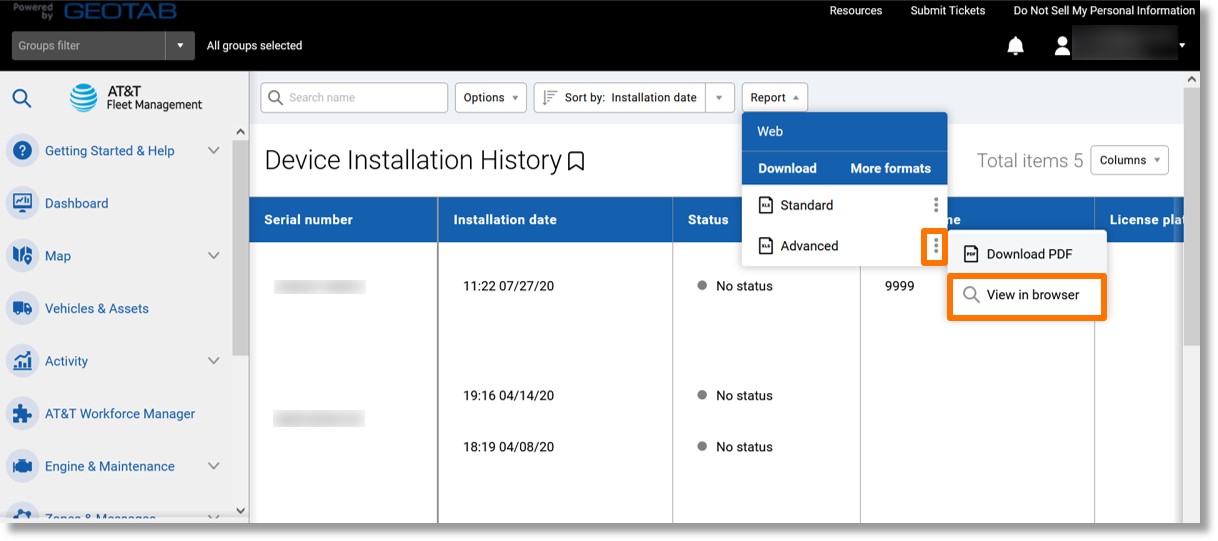
- The Installation history report downloads and displays.
Top
Trips History Details Report
Use: Historical tracking to examine trip information for a previous date. Selecting an individual trip adds the trip to the map for a visual representation.
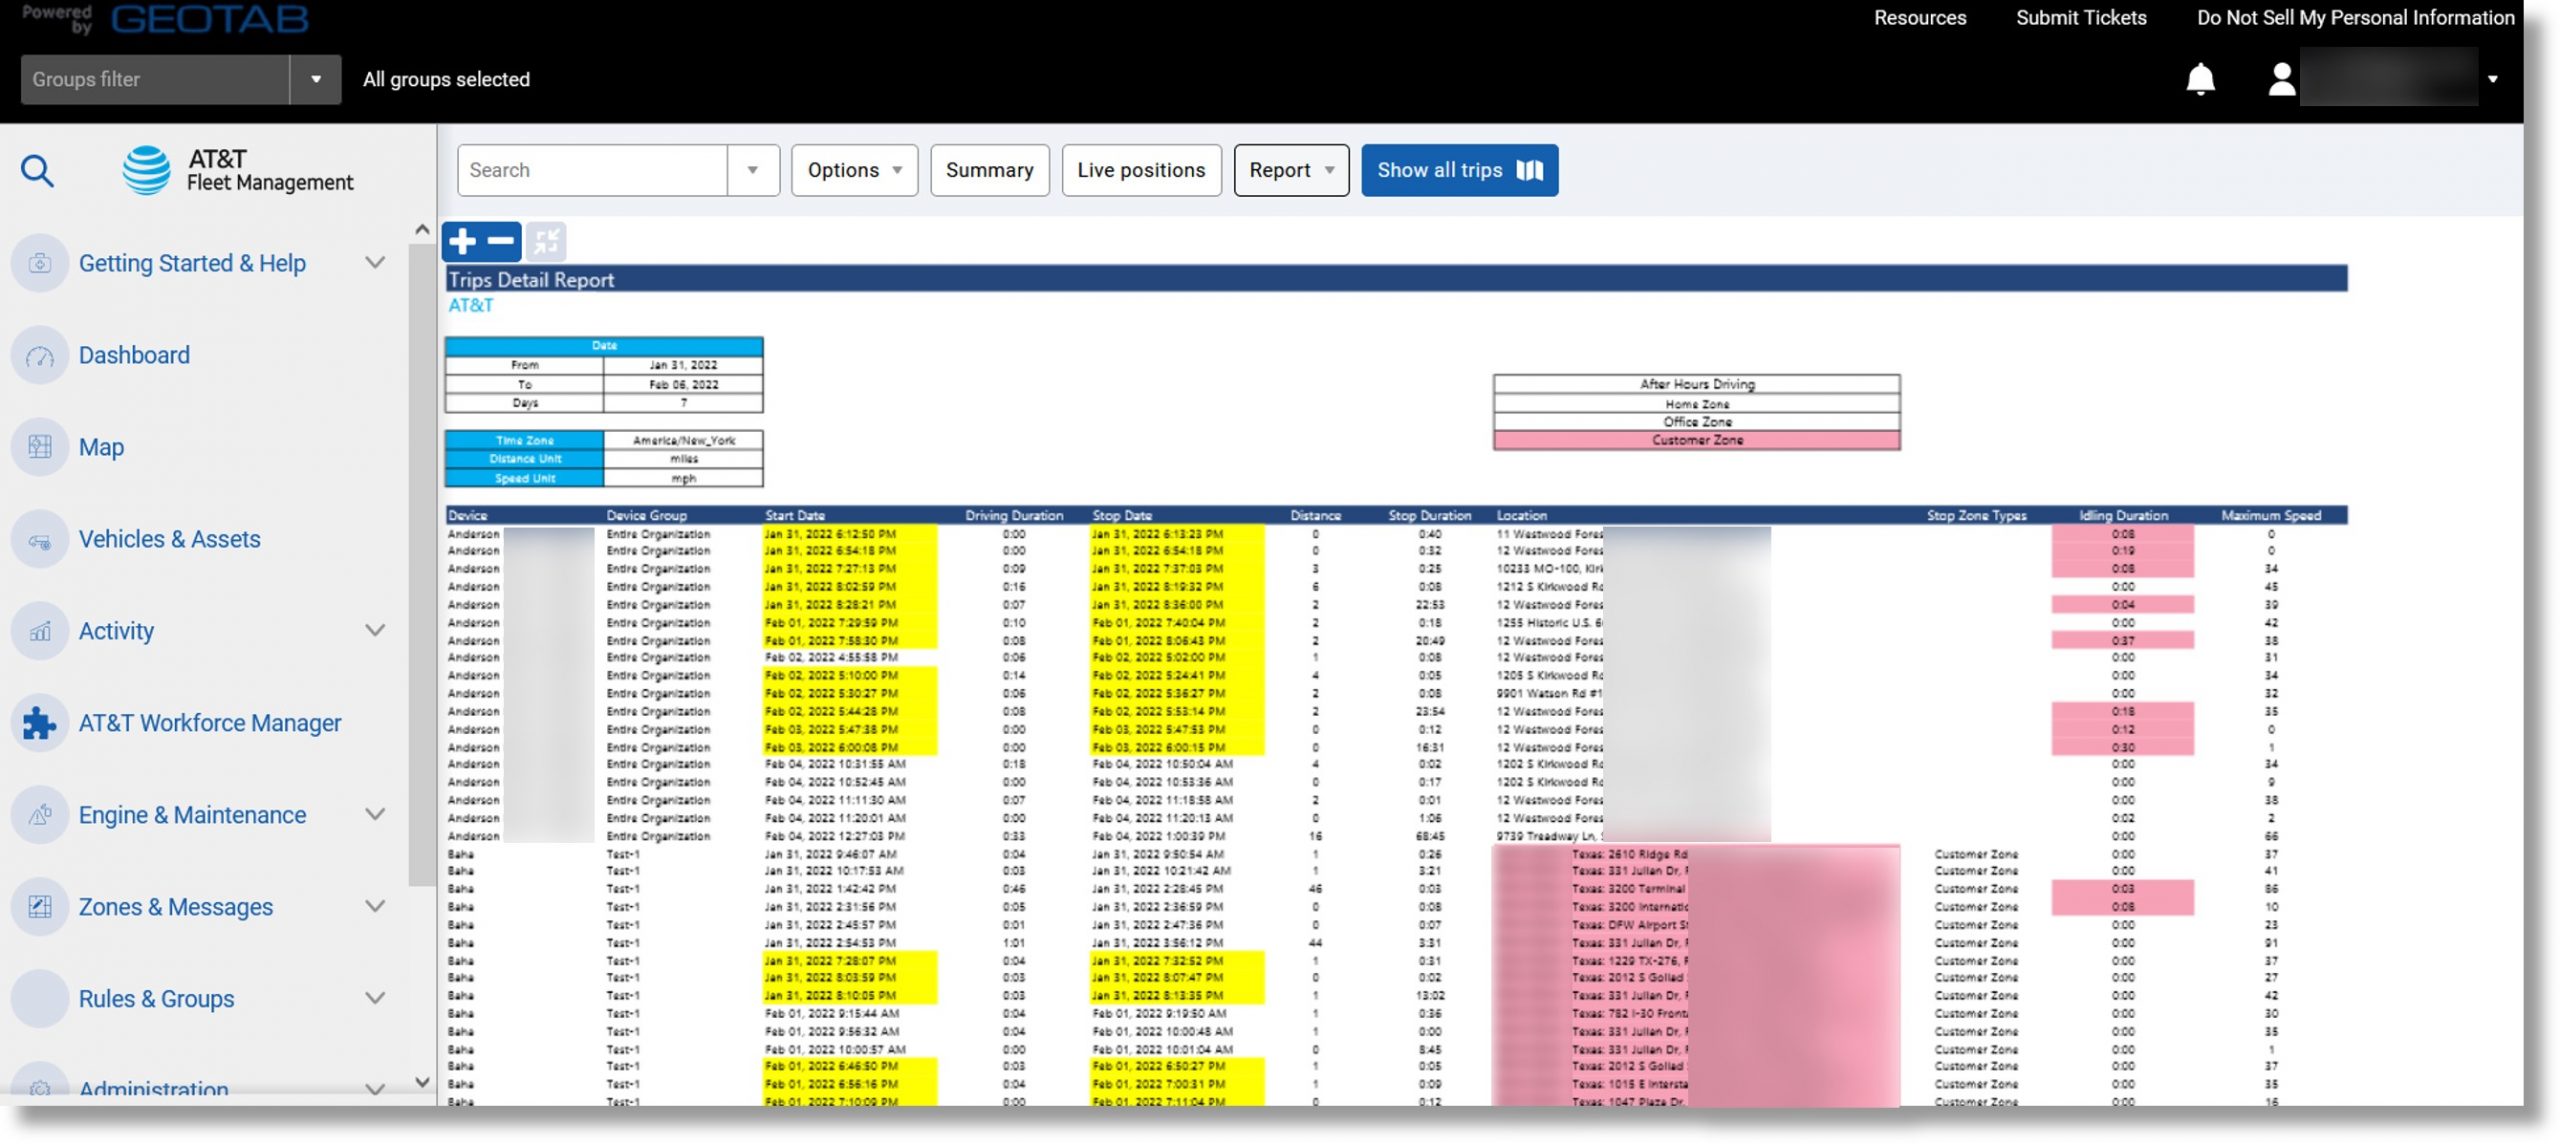
Information included: Stop location, stopped time, idle duration, trip time and distance.
Additional Information when exported: Latitude and longitude, maximum trip speed, odometer at the start of a trip, etc.
Accessing the report:
- Click on Map in the column on the left.
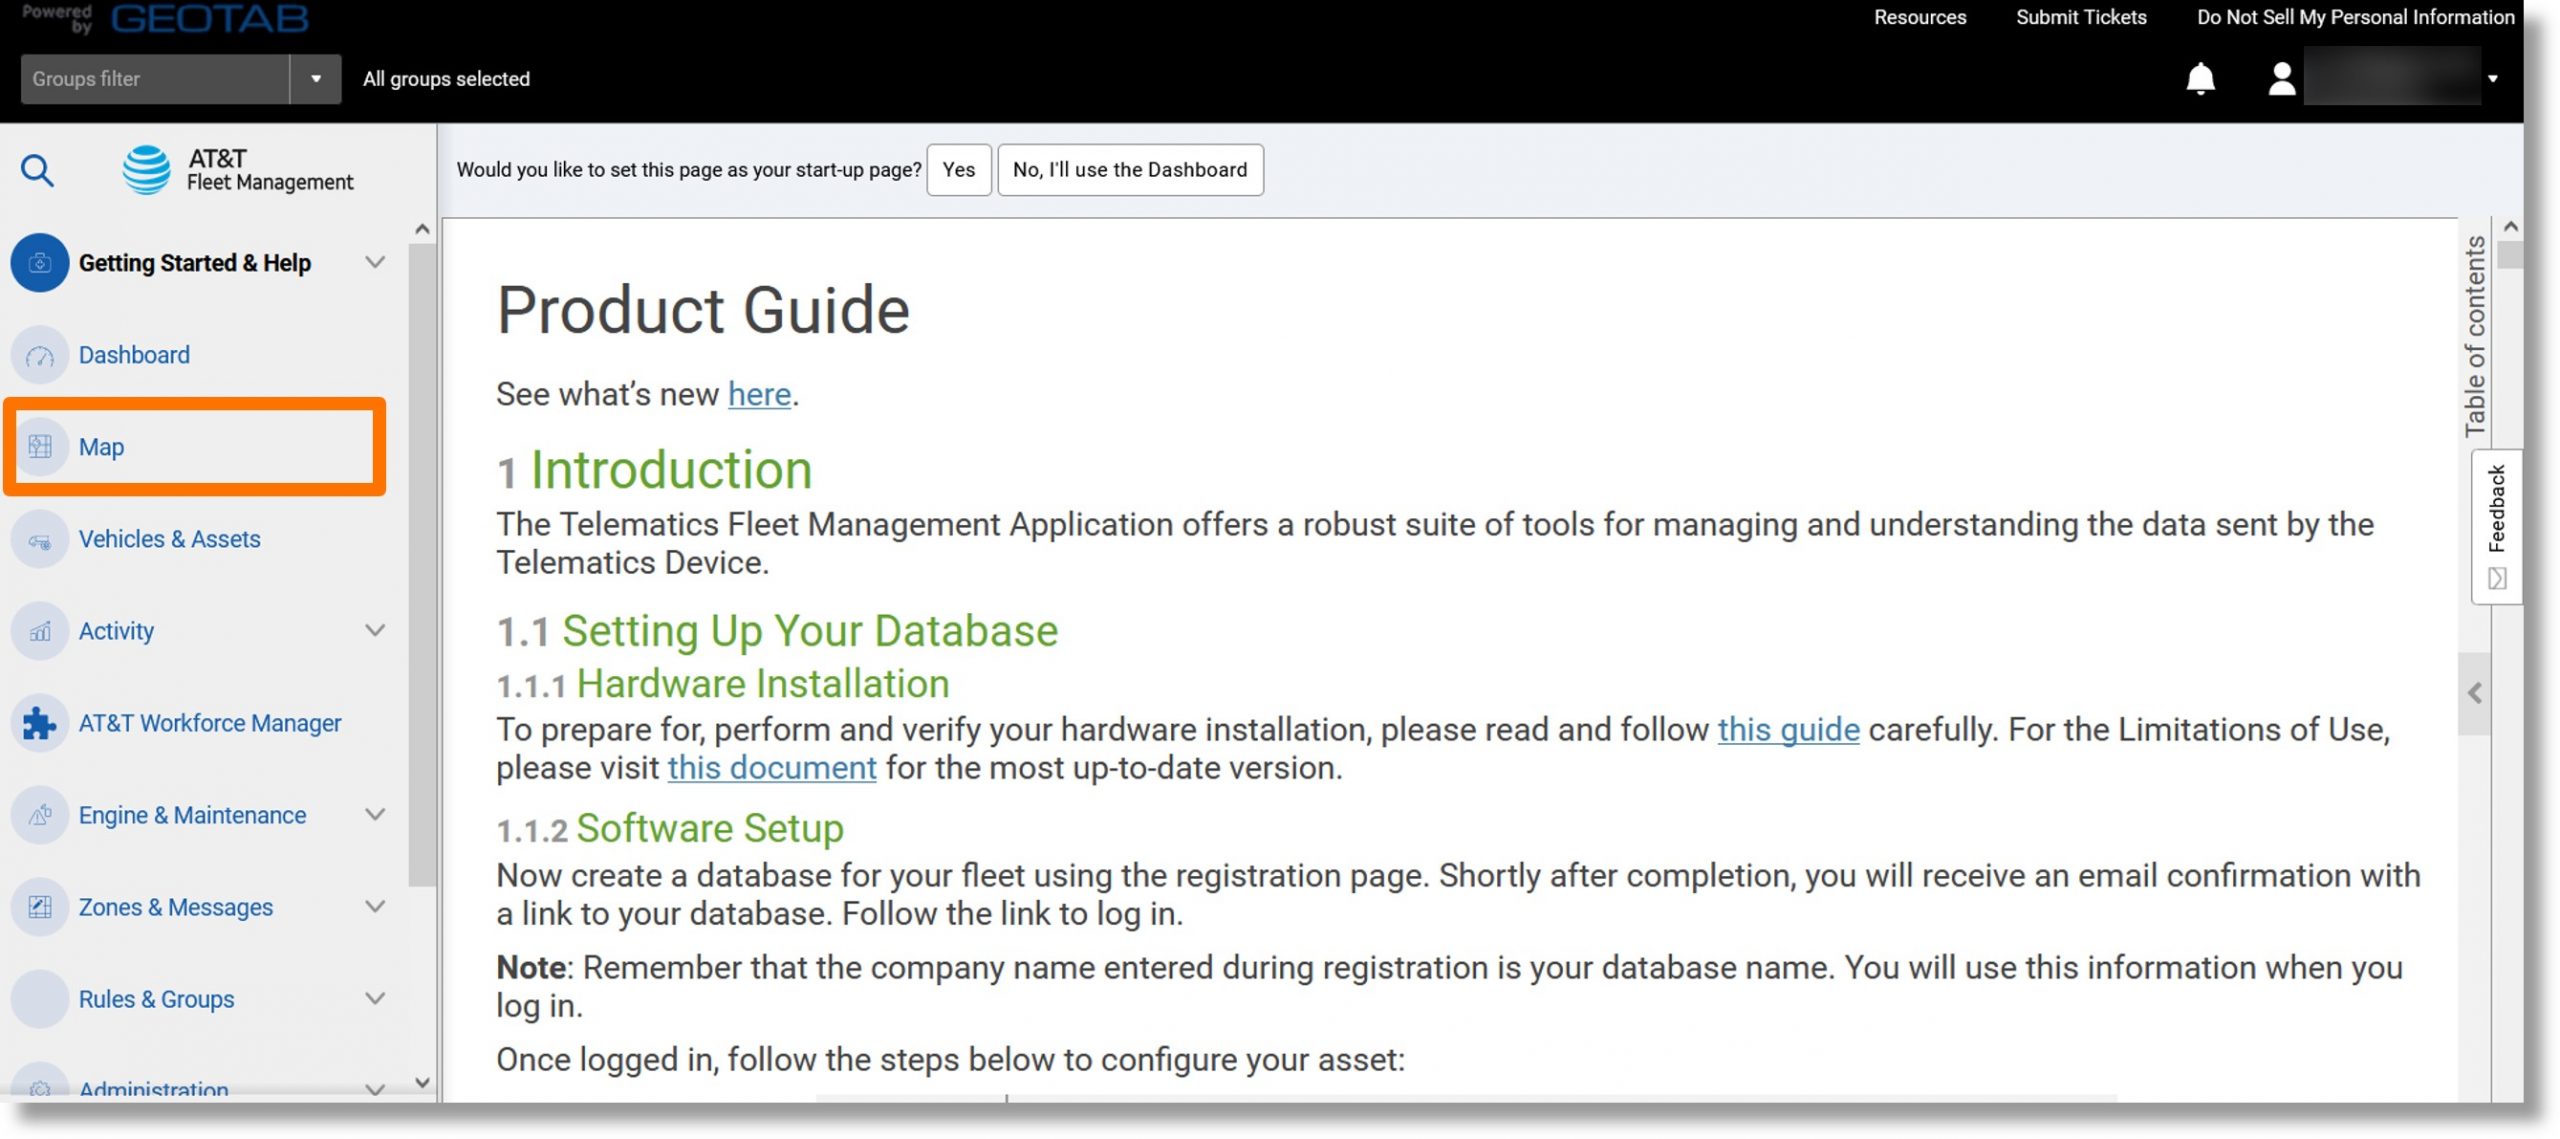
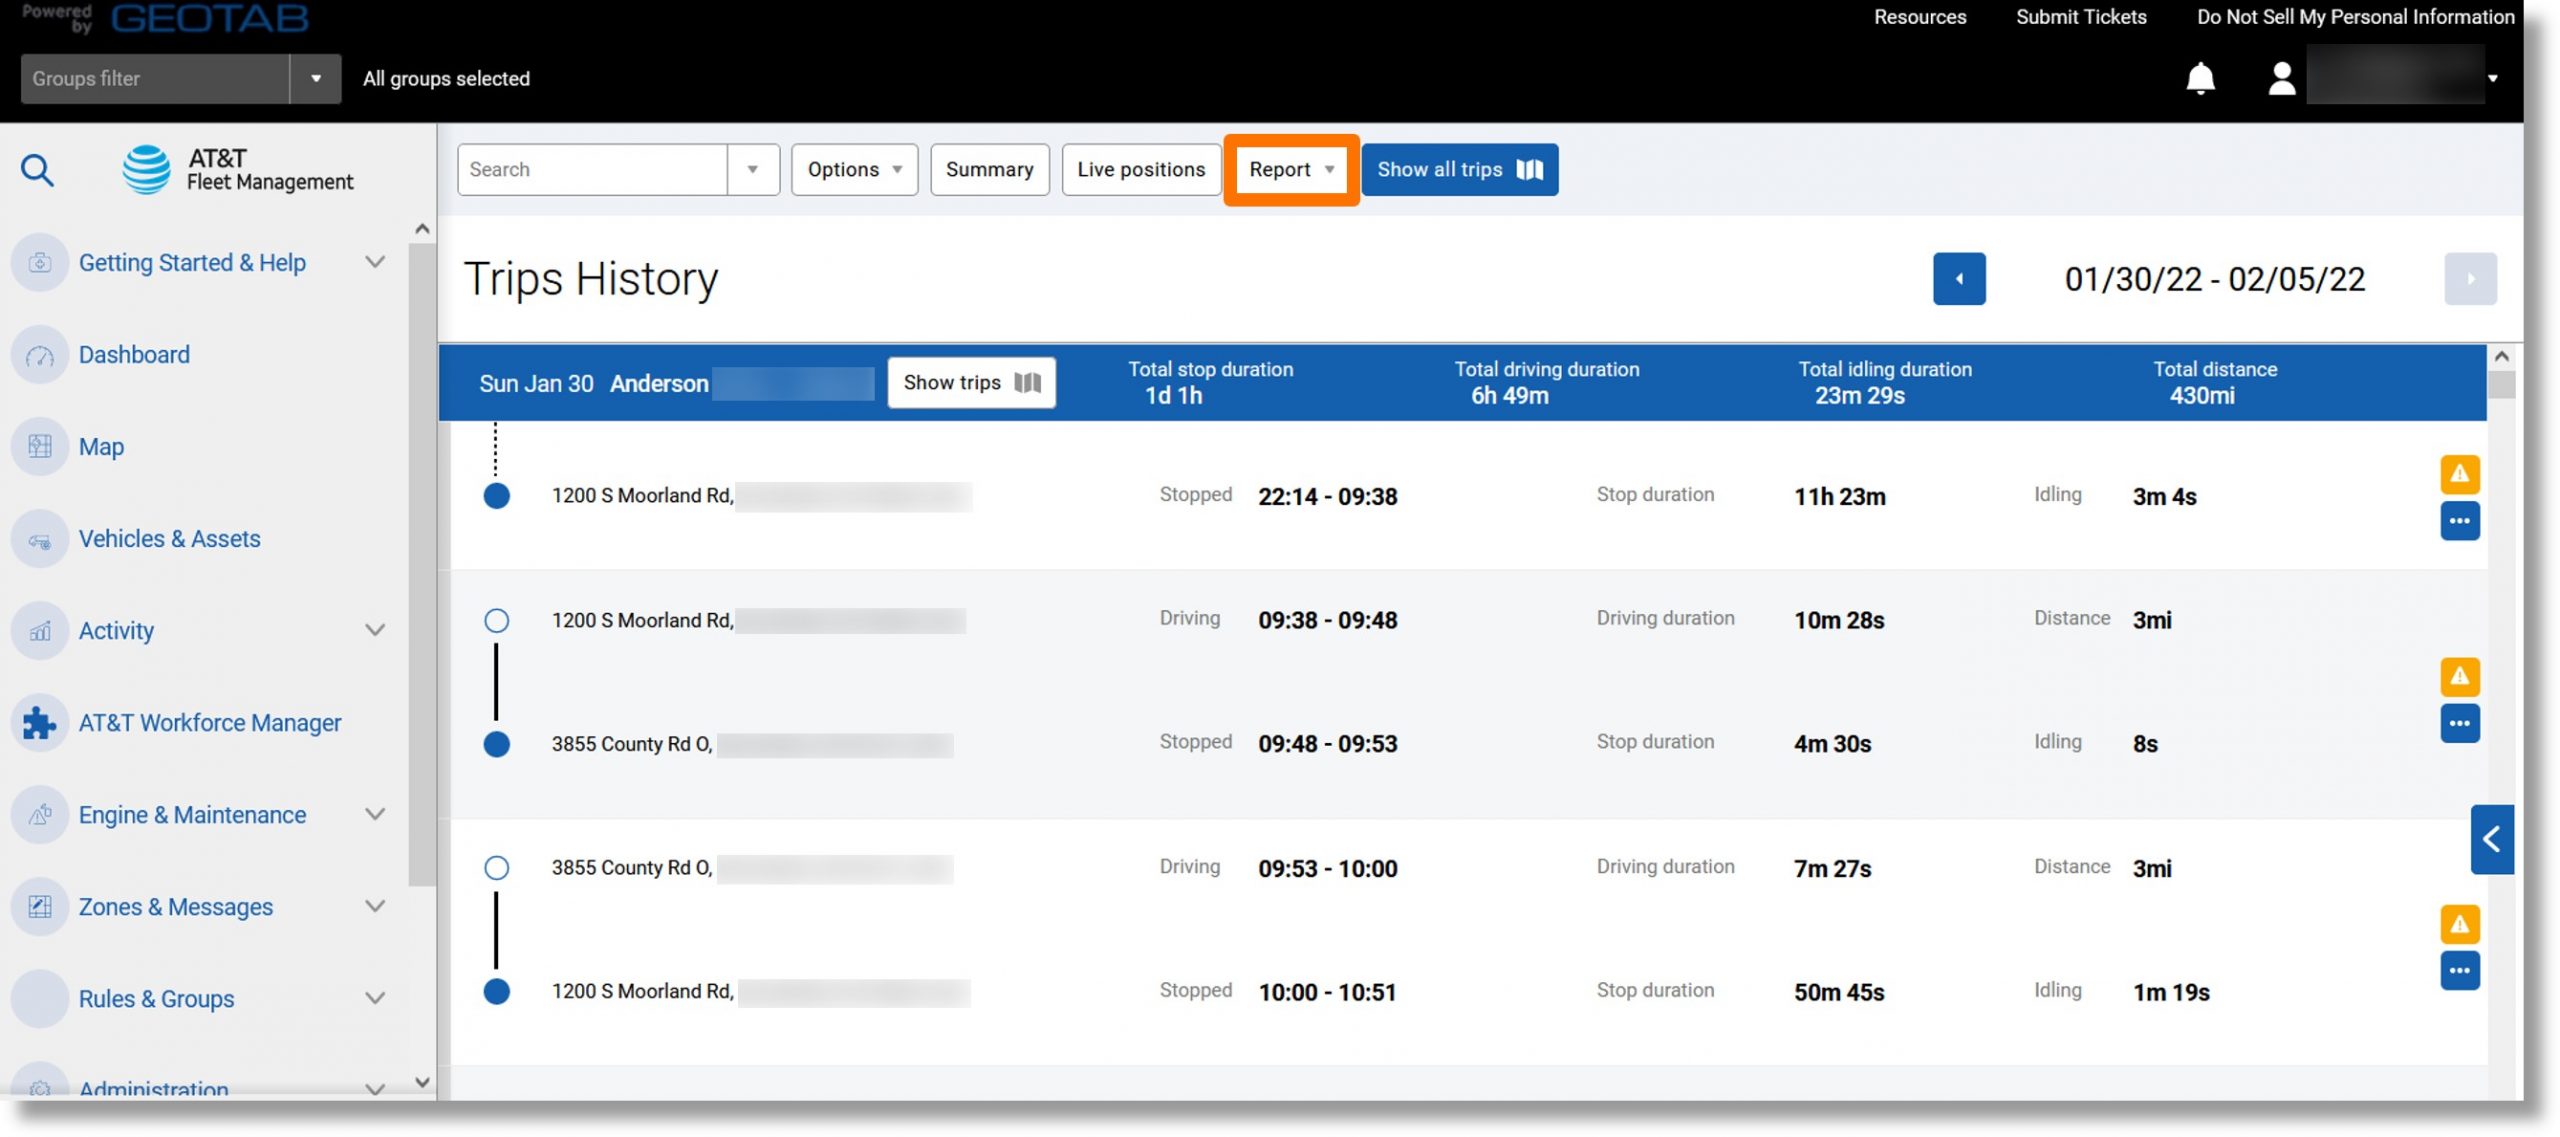
- Click on Trip History button near the top of the screen.
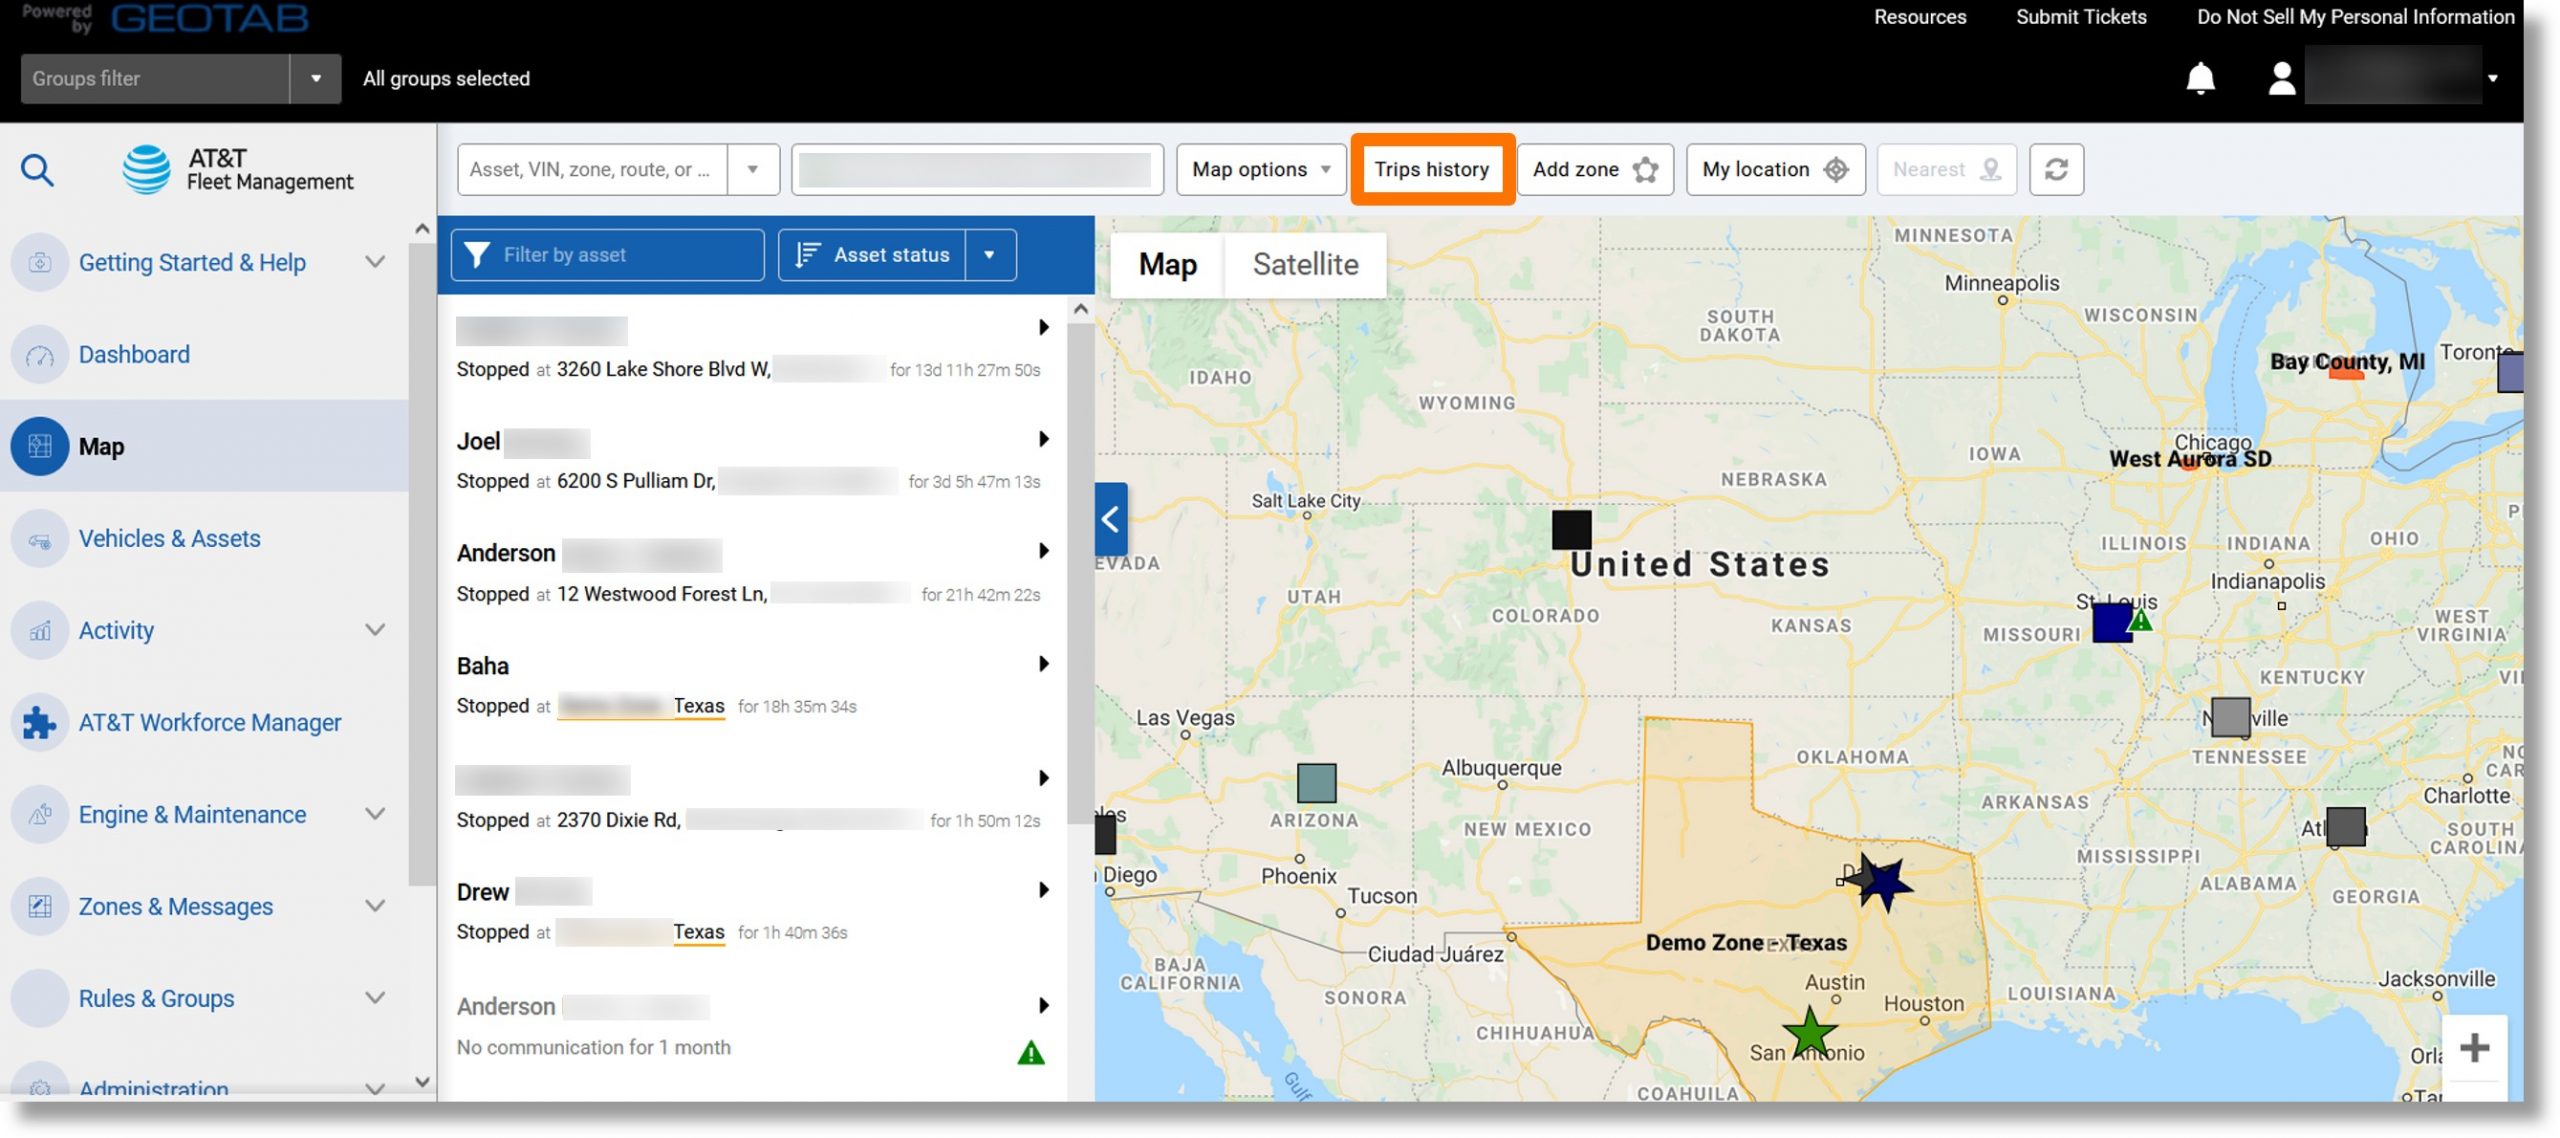
- The trip history details display.
Note: If no trips display, click on the “Options” dropdown and select the desired parameters.
- Click on the Report dropdown.
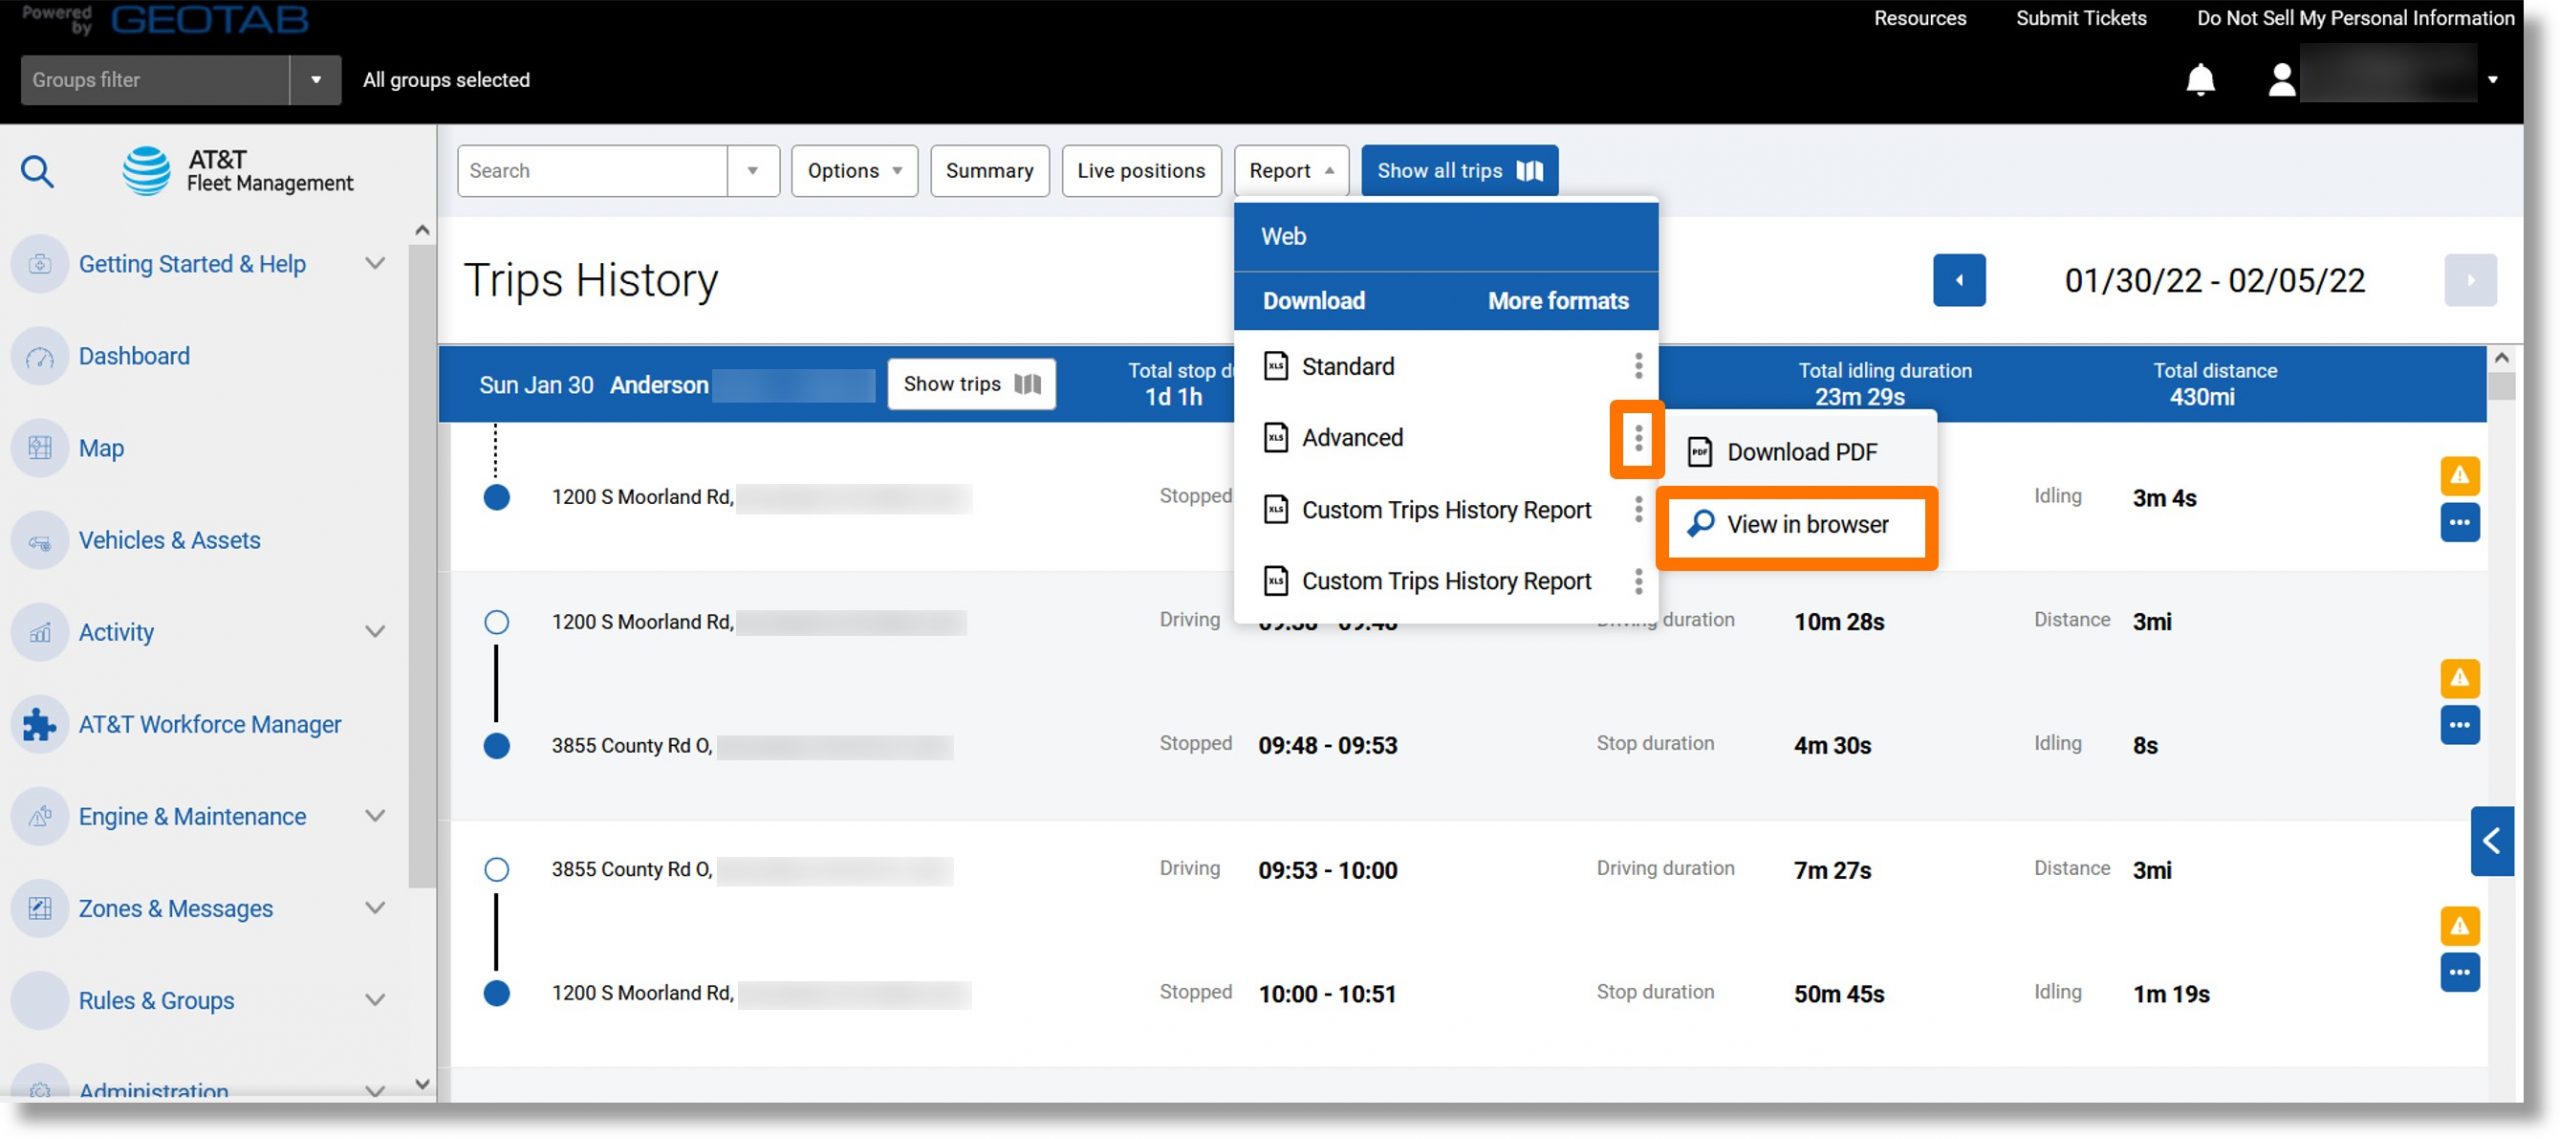
- Click on the ellipsis icon
 to the right of either “Standard” or “Advanced”.
- Click on View in browser.
- The trip details display.
Top
Trips History Summary Report
Use: This report allows you to compare essential driving data for your entire fleet.
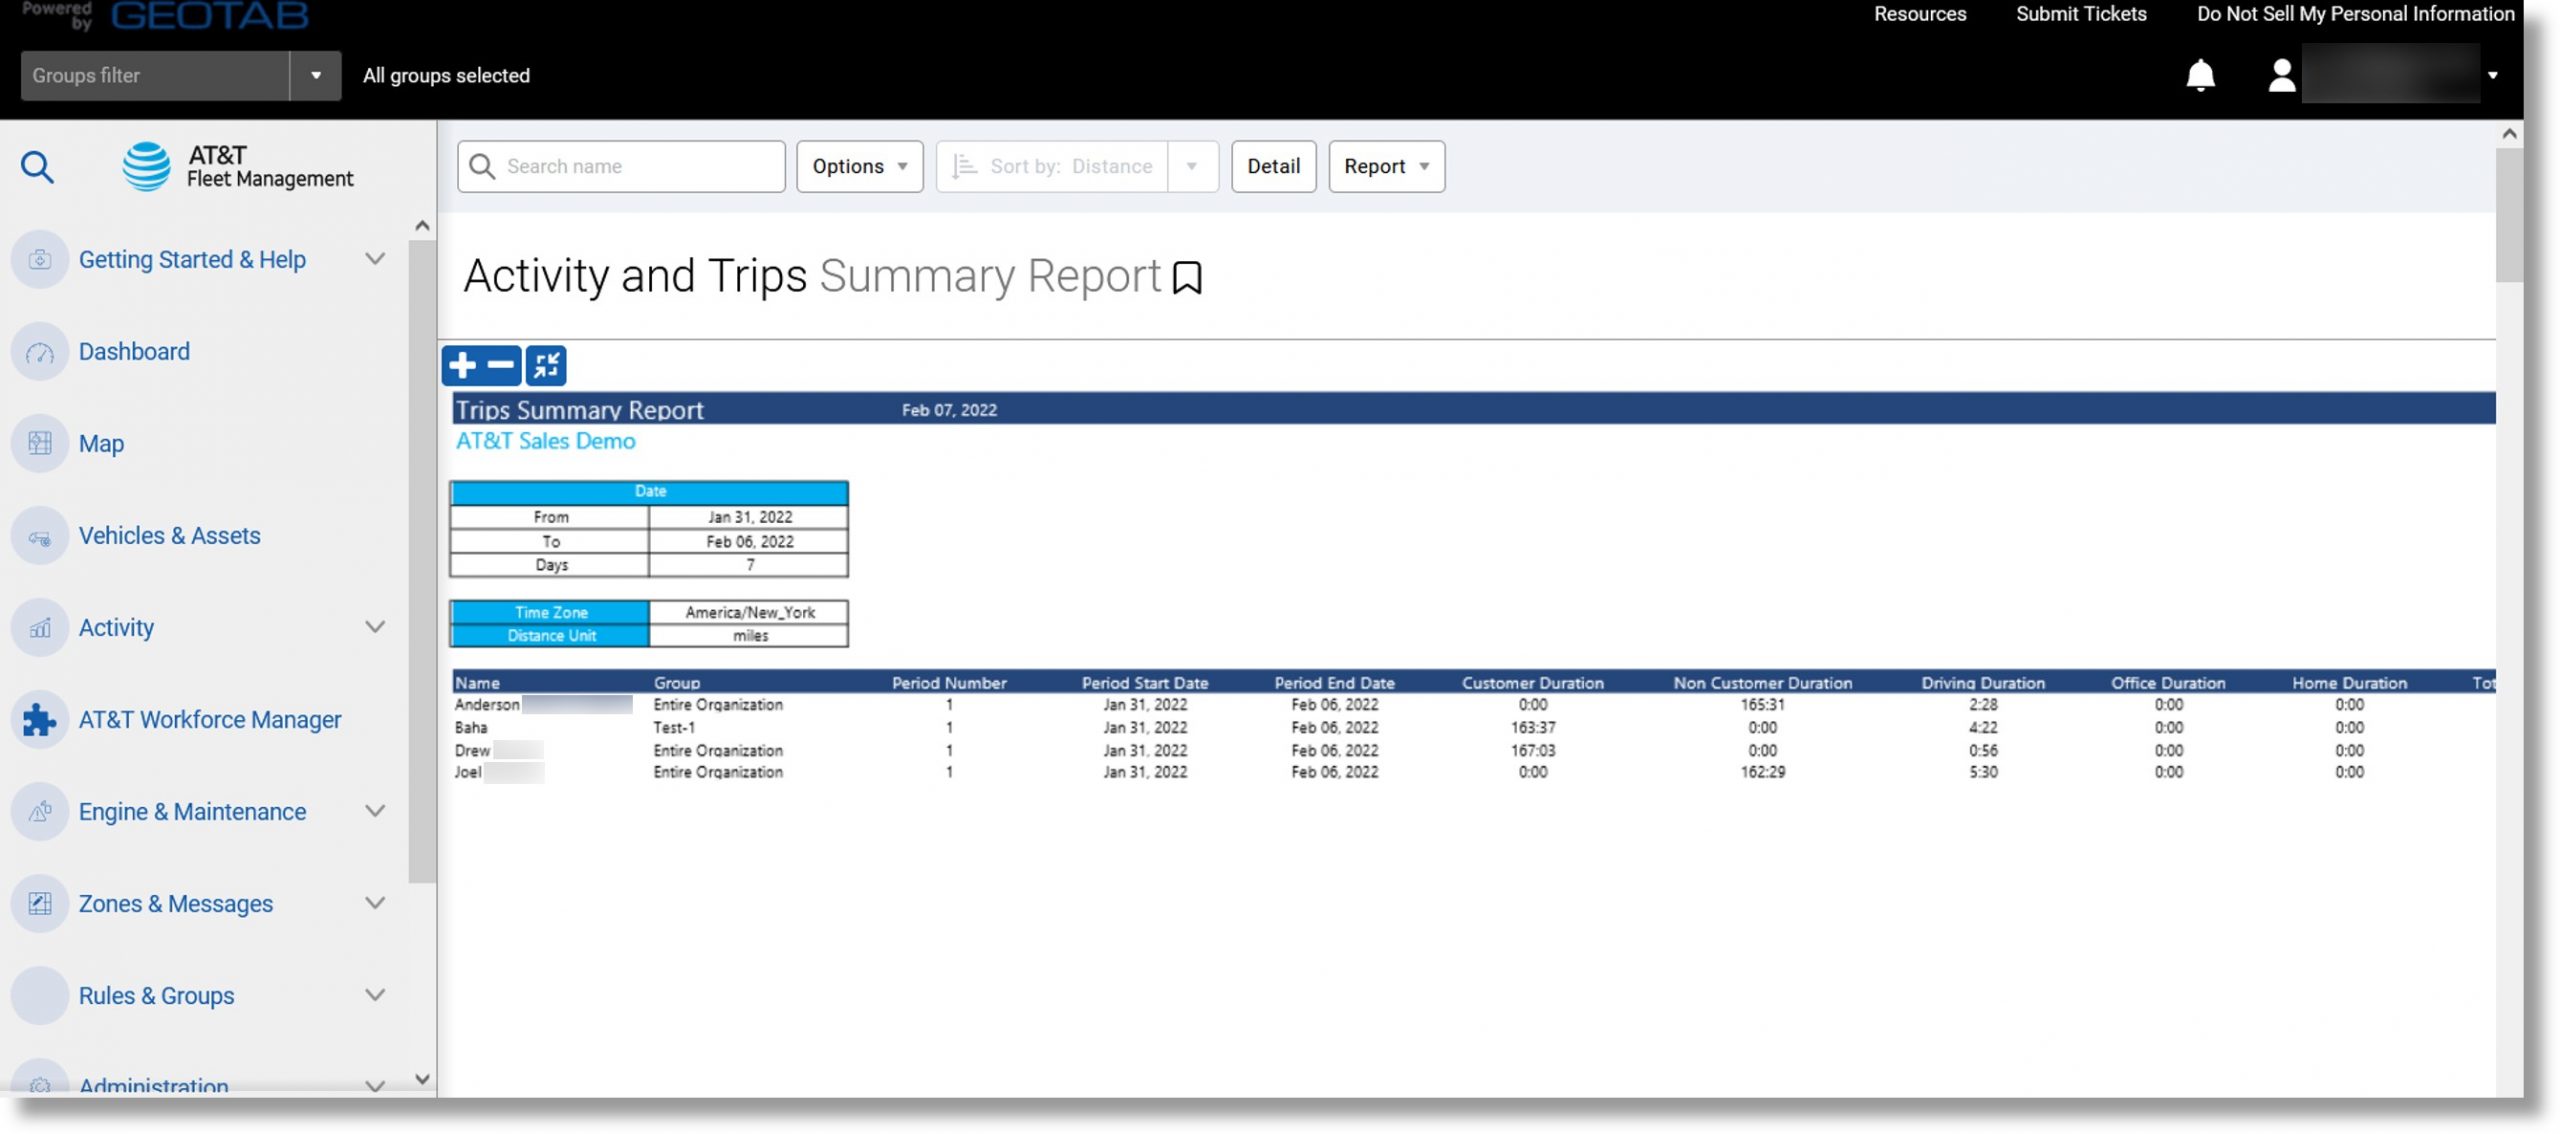
Information included: Mileage, driving time, idling time, and zone type duration.
Additional Information when exported: Maximum speed, zone type, stop count, idling duration percentage, etc.
Accessing the report:
- Click on Map in the column on the left and scroll down.

- Click on the Trip History button near the top of the screen.

- The trip history displays.
Note: If no trips display, click on the Options dropdown and set the desired parameters.
- Click on the Summary button.
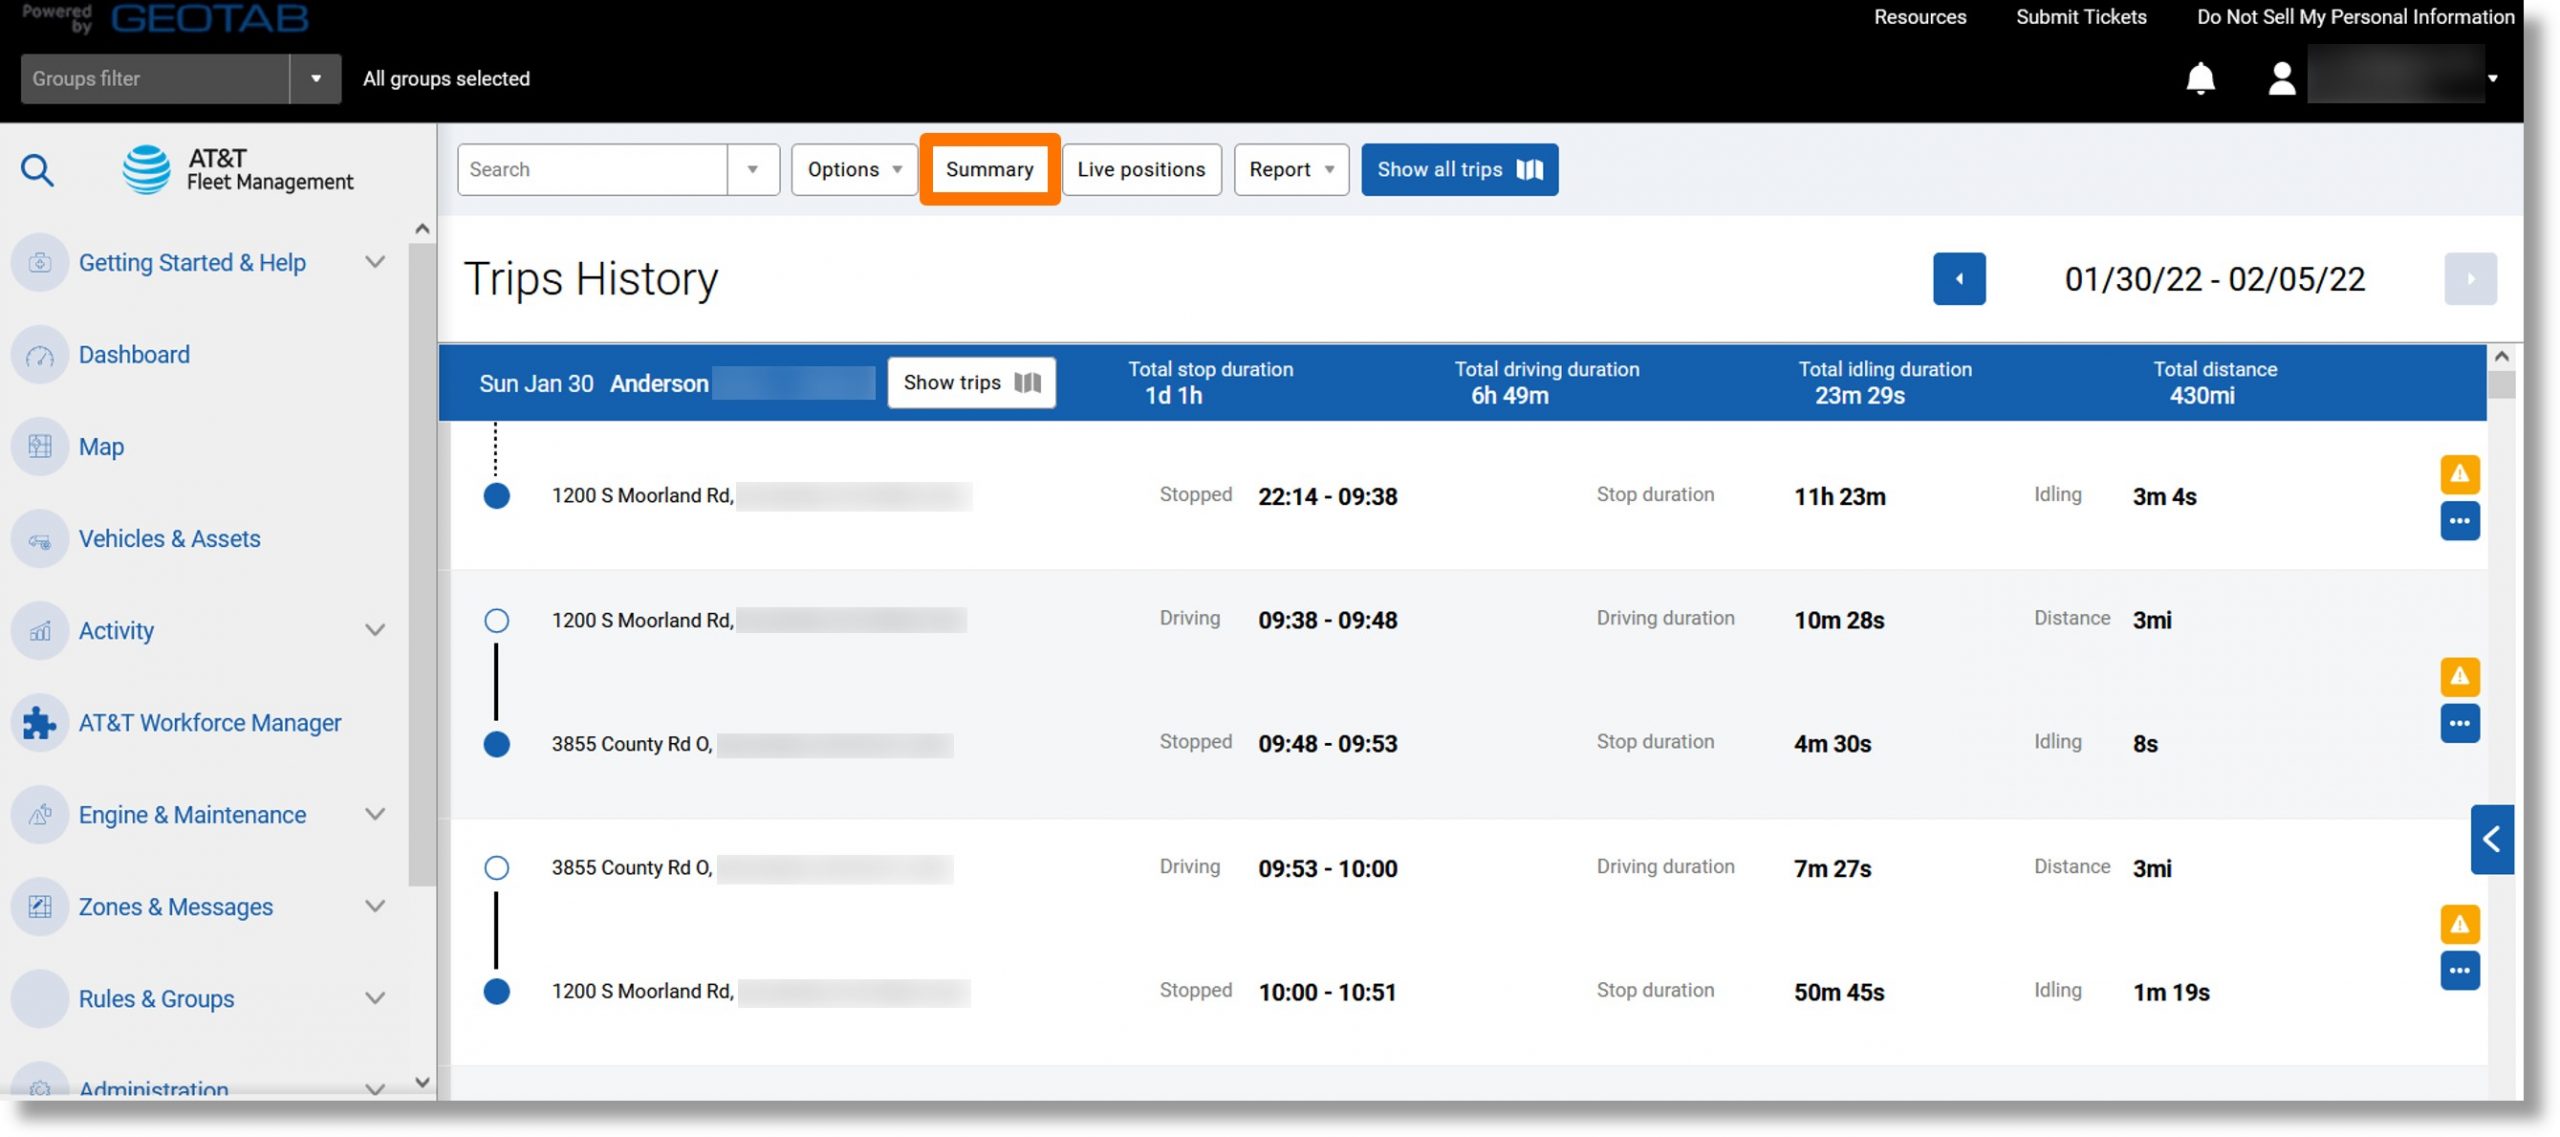
- The trip summary displays.
- Click on the Report dropdown.
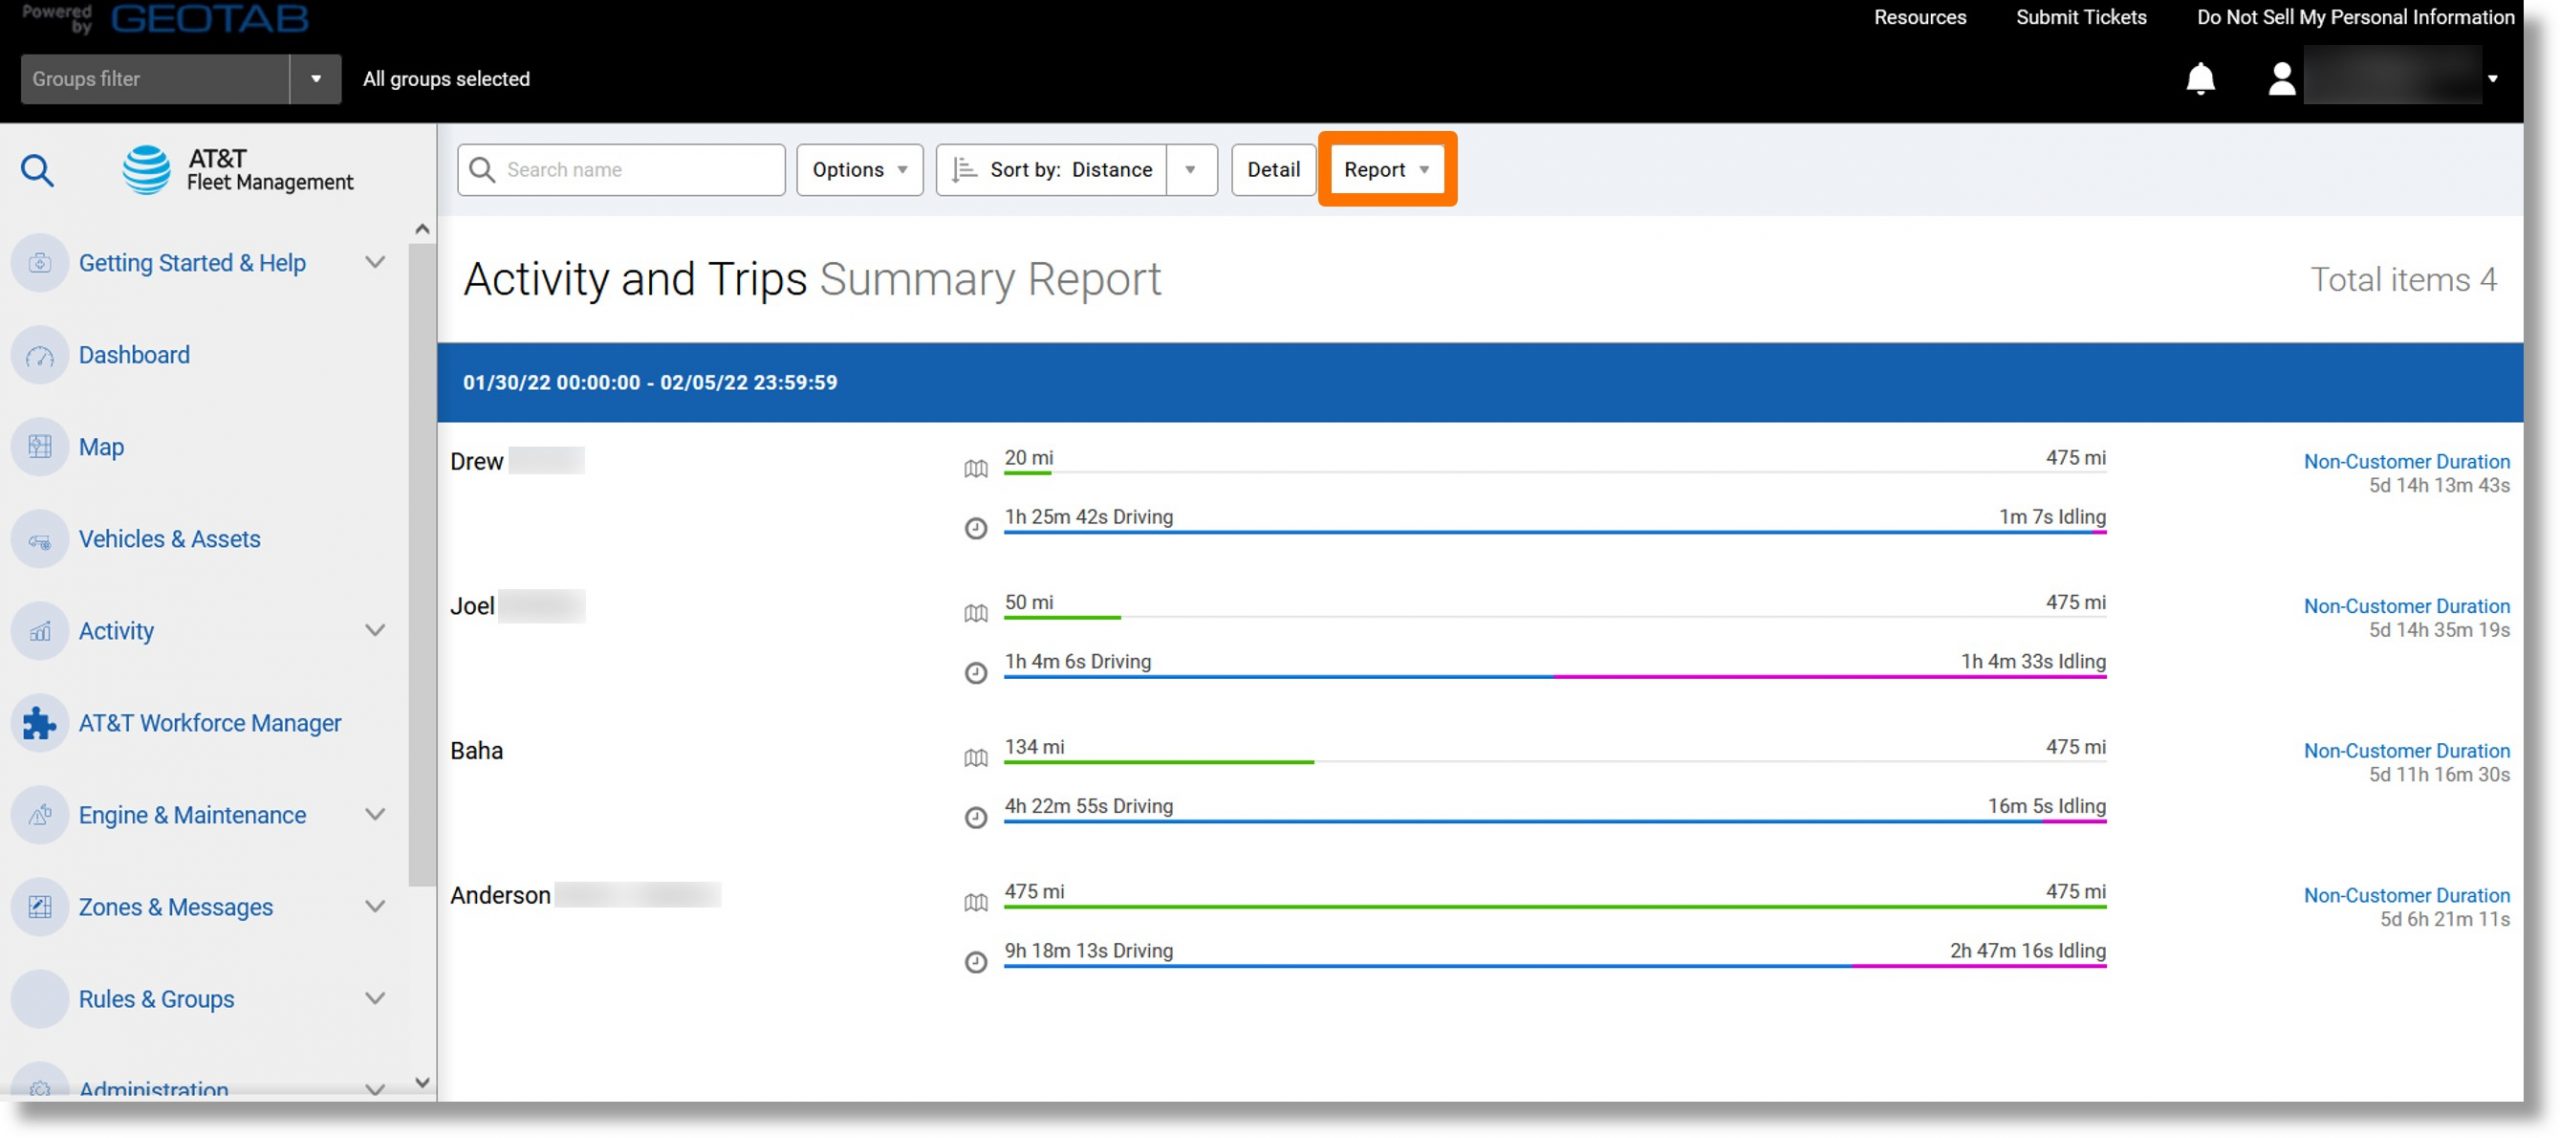
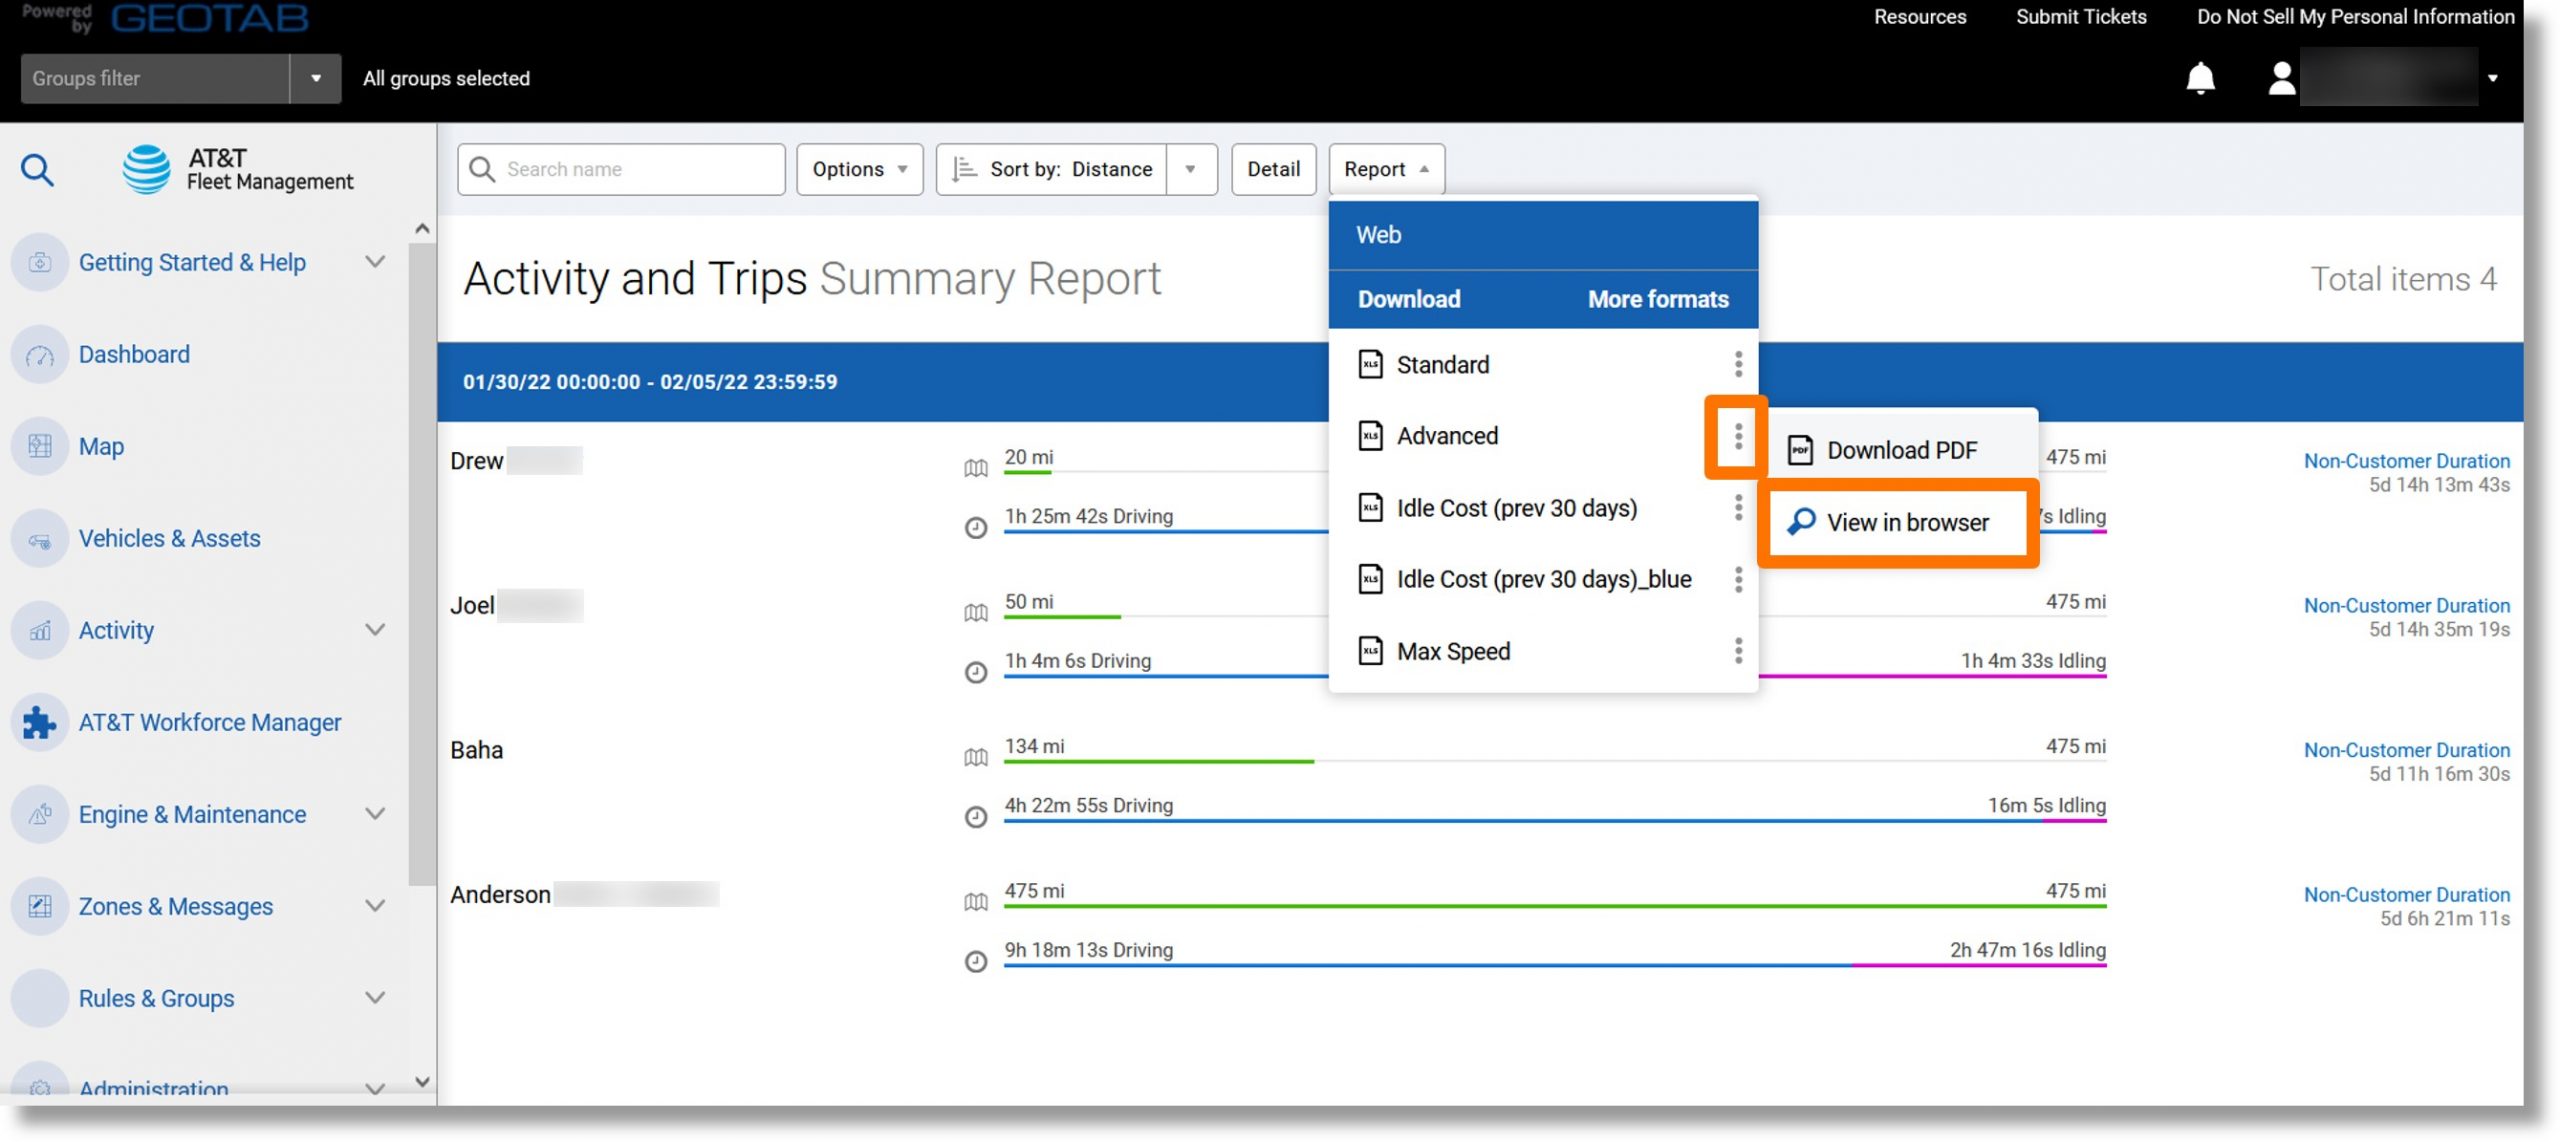
- Click on the ellipsis icon
 to the right of either “Standard” or “Advanced”.
- Click on View in browser.
- The trip summary displays.
Top
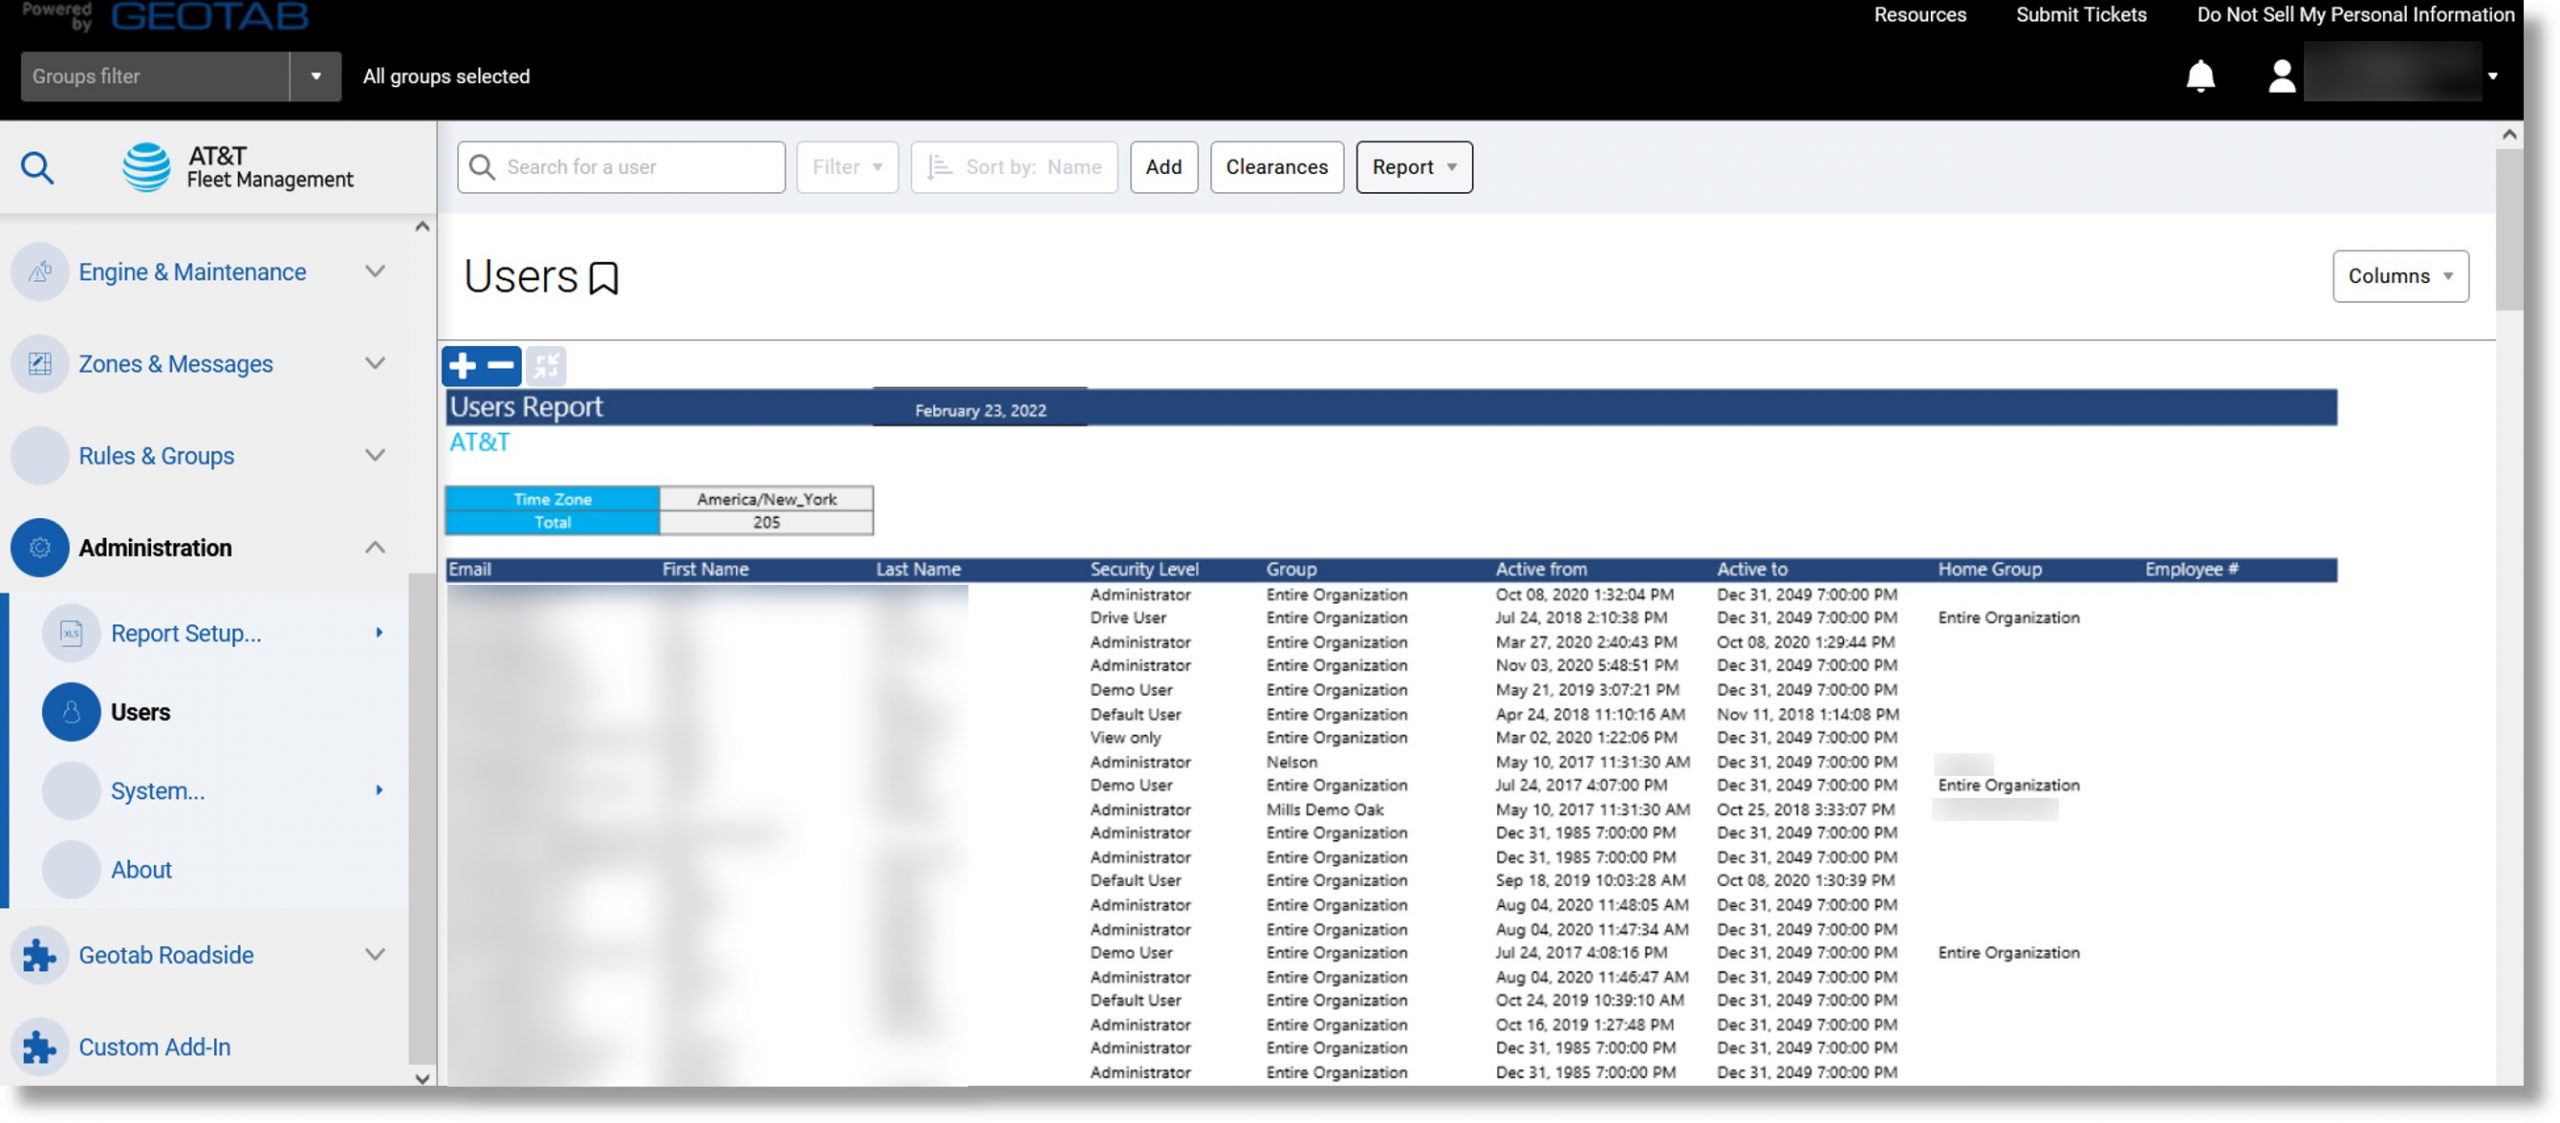
Users Report
Use: List of all the users in the database and includes user information as well as their database clearance level.
Information included: Username, email, clearance level, group, active from, active to, and key ID.
Additional Information when exported: Driver key type, etc.
Accessing the report:
- Scroll down to the “Administration” in the menu on the left.
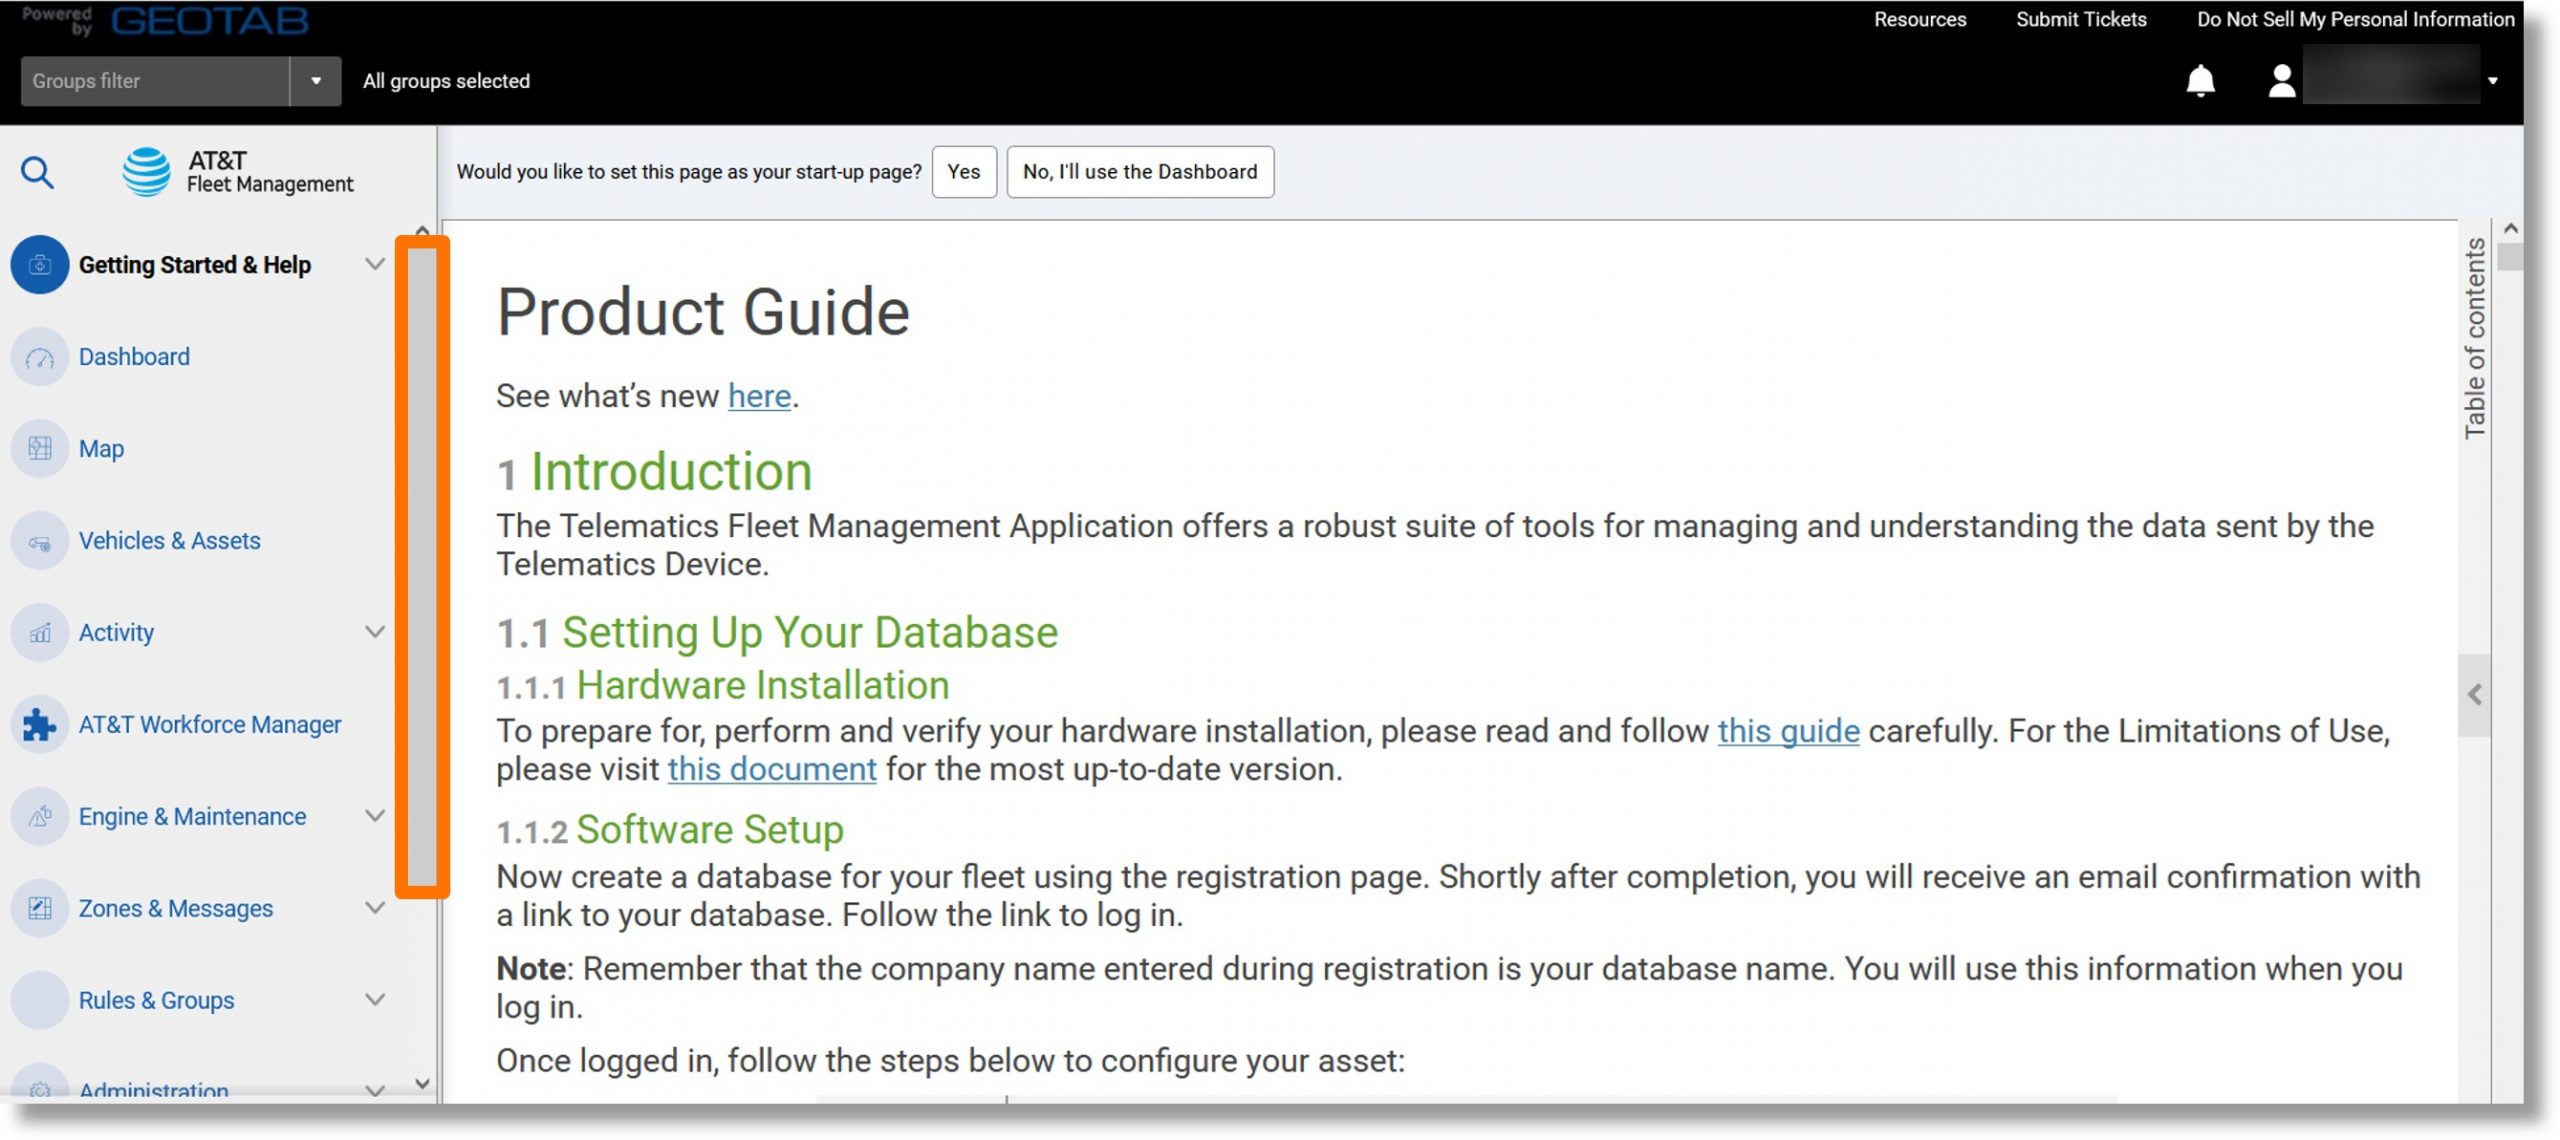
- Click on Administration and scroll down.
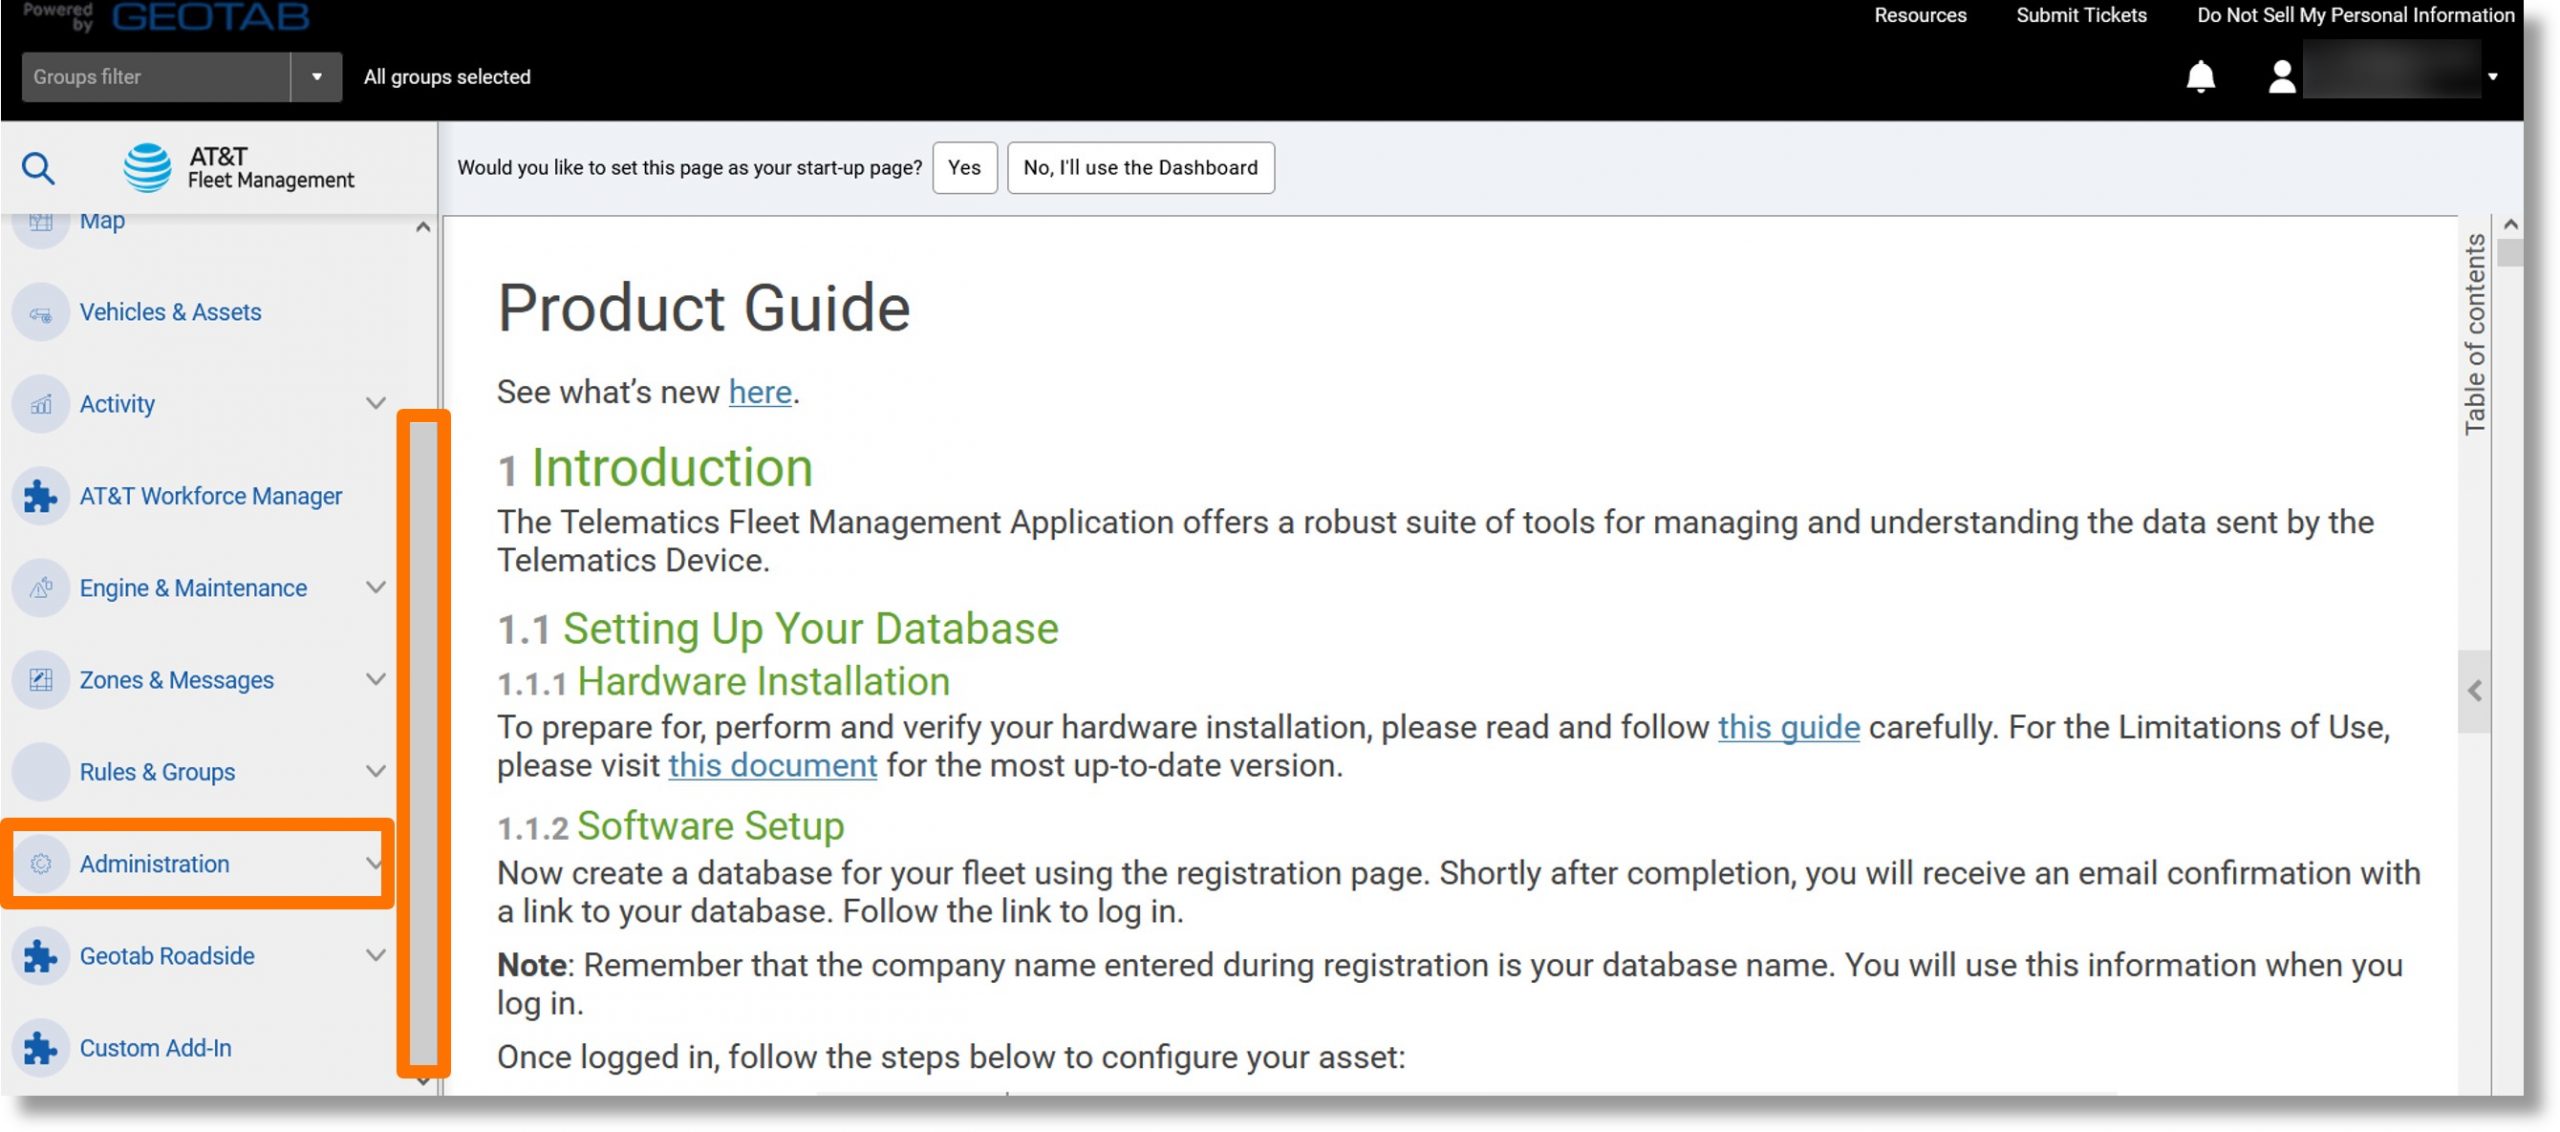
- Click on Users.
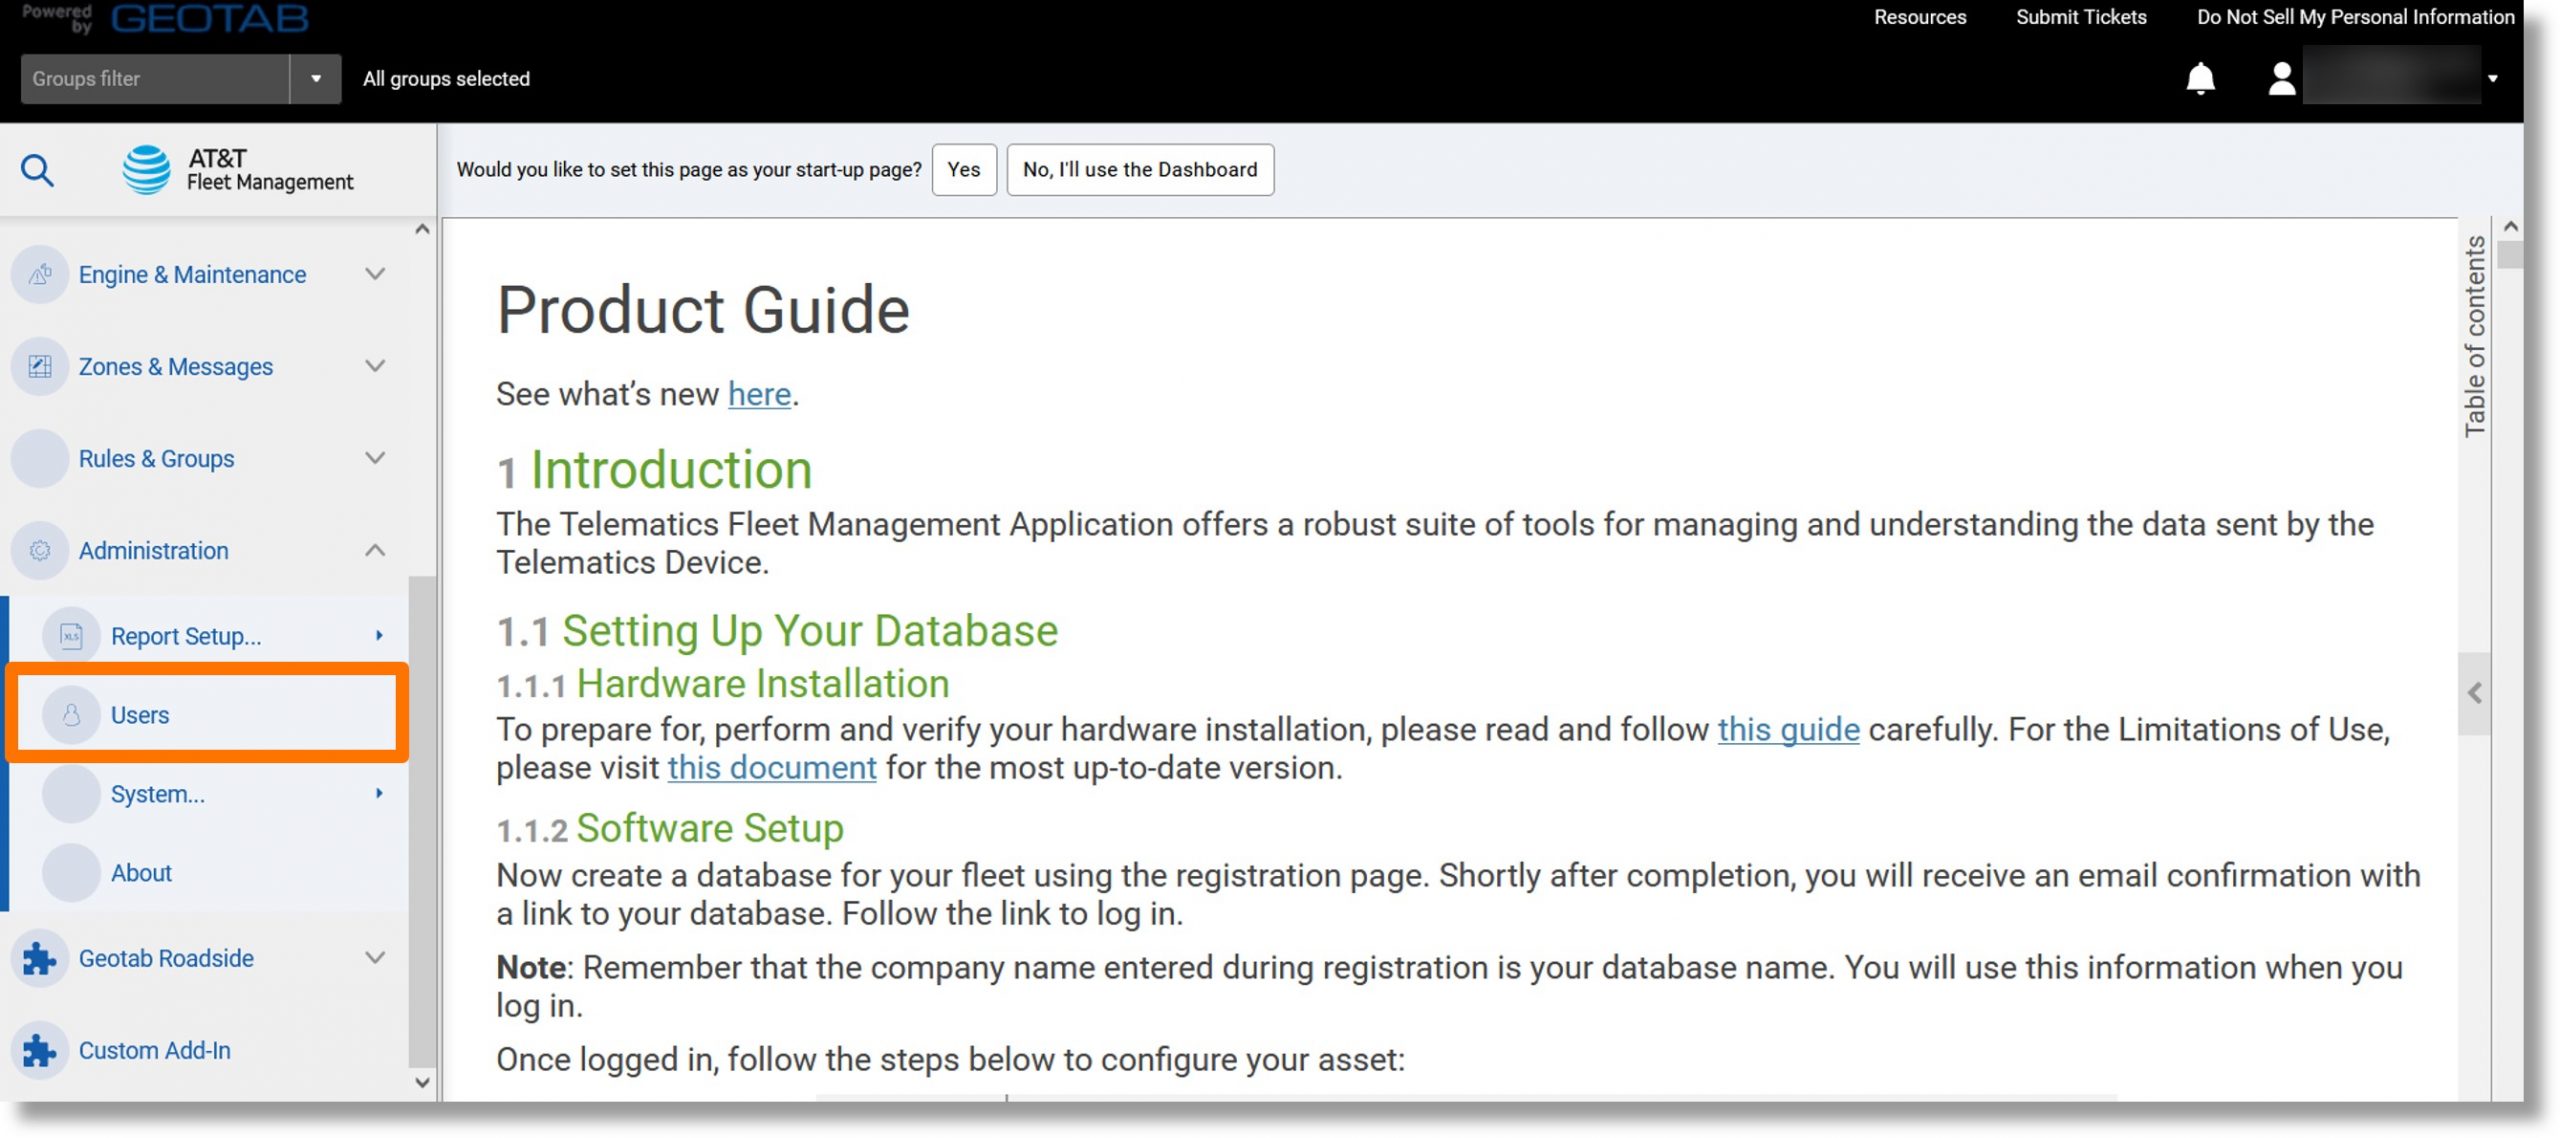
- Click on the Report dropdown.
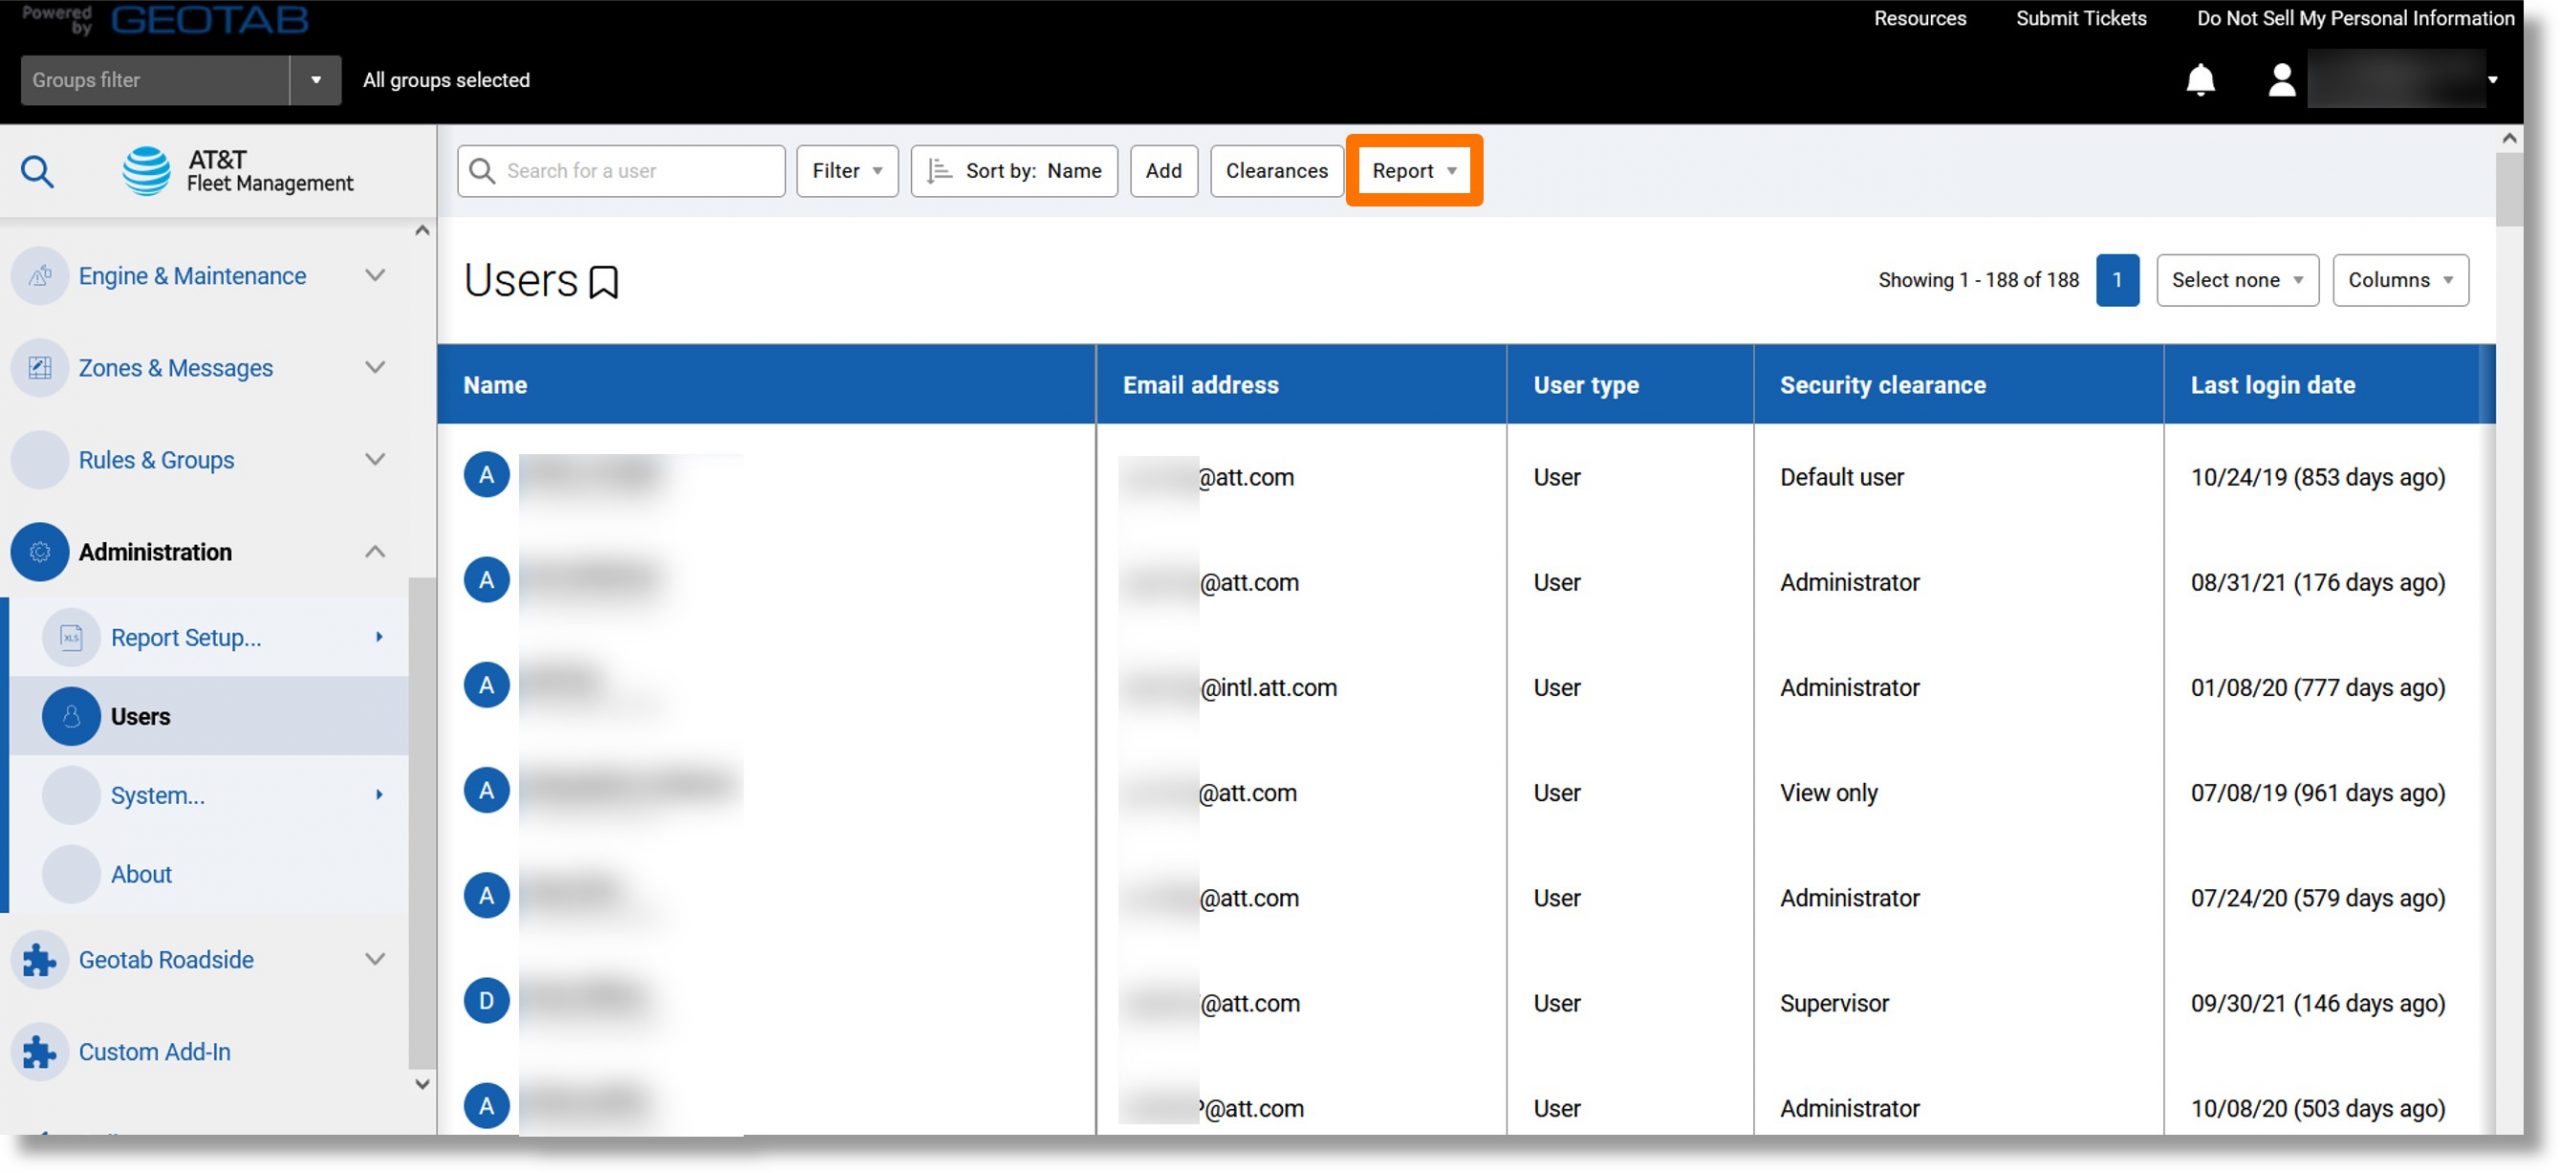
- Click the ellipsis icon
 to the right of “Standard or “Advanced” and then click on View in browser.
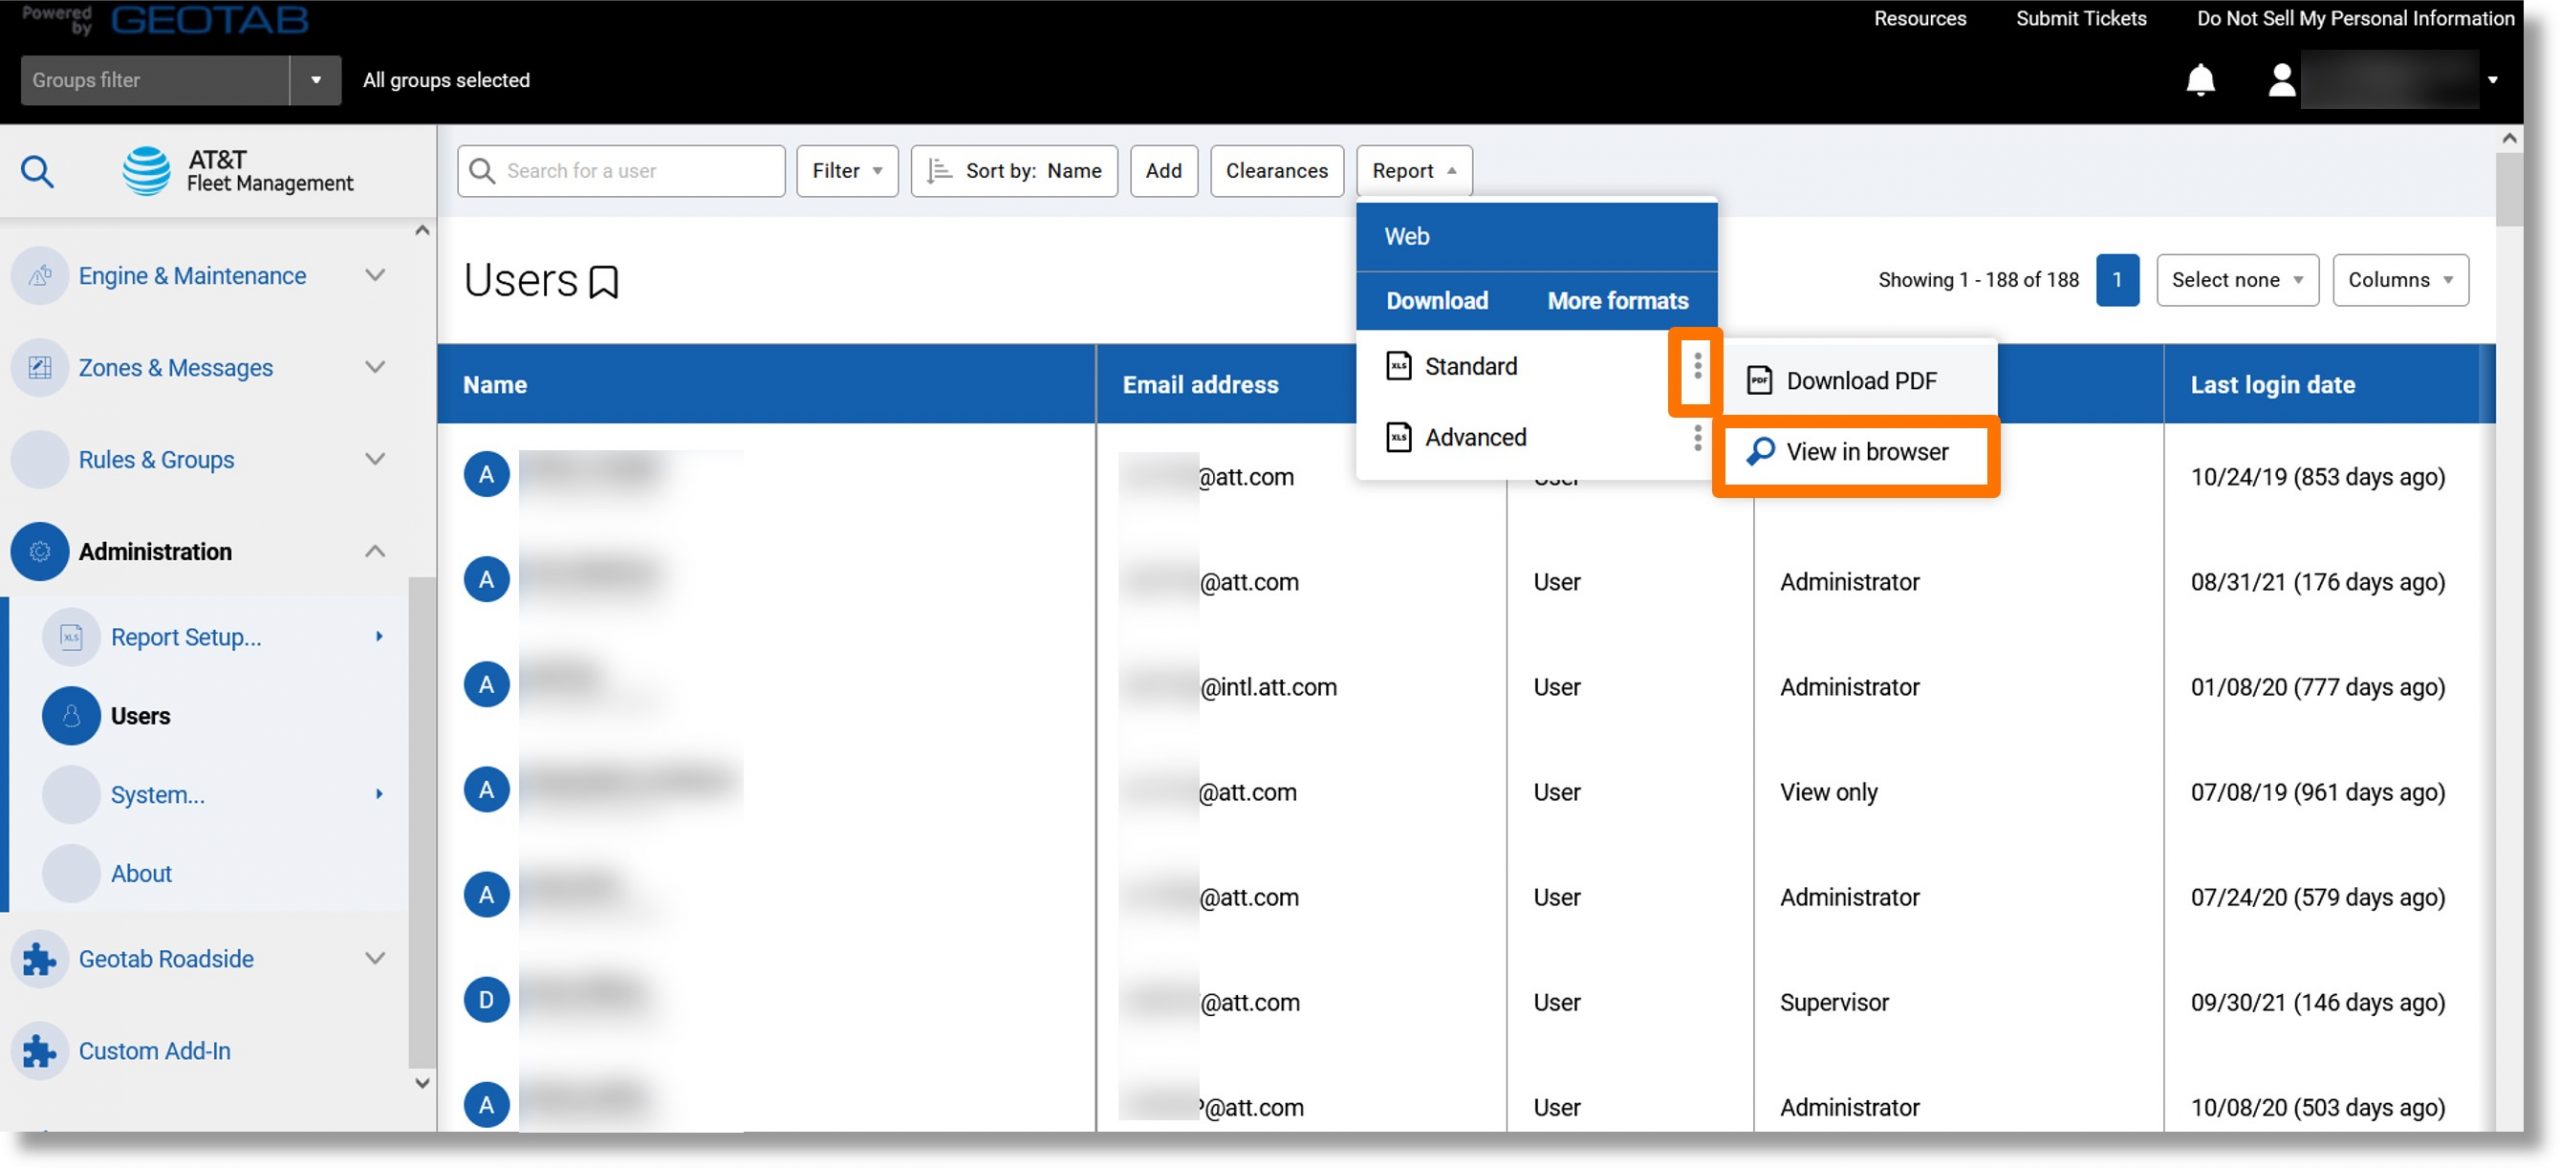
- The report displays.
Top
Zones Report
Use: List of all the zones in the database.
Information included: Zone name, group, type, visibility.
Additional information when exported: Zone latitude and longitude, zone displayed, zone stop exception, etc.
Accessing the report:
- Click on Zones & Messages in the menu on the left and scroll down.
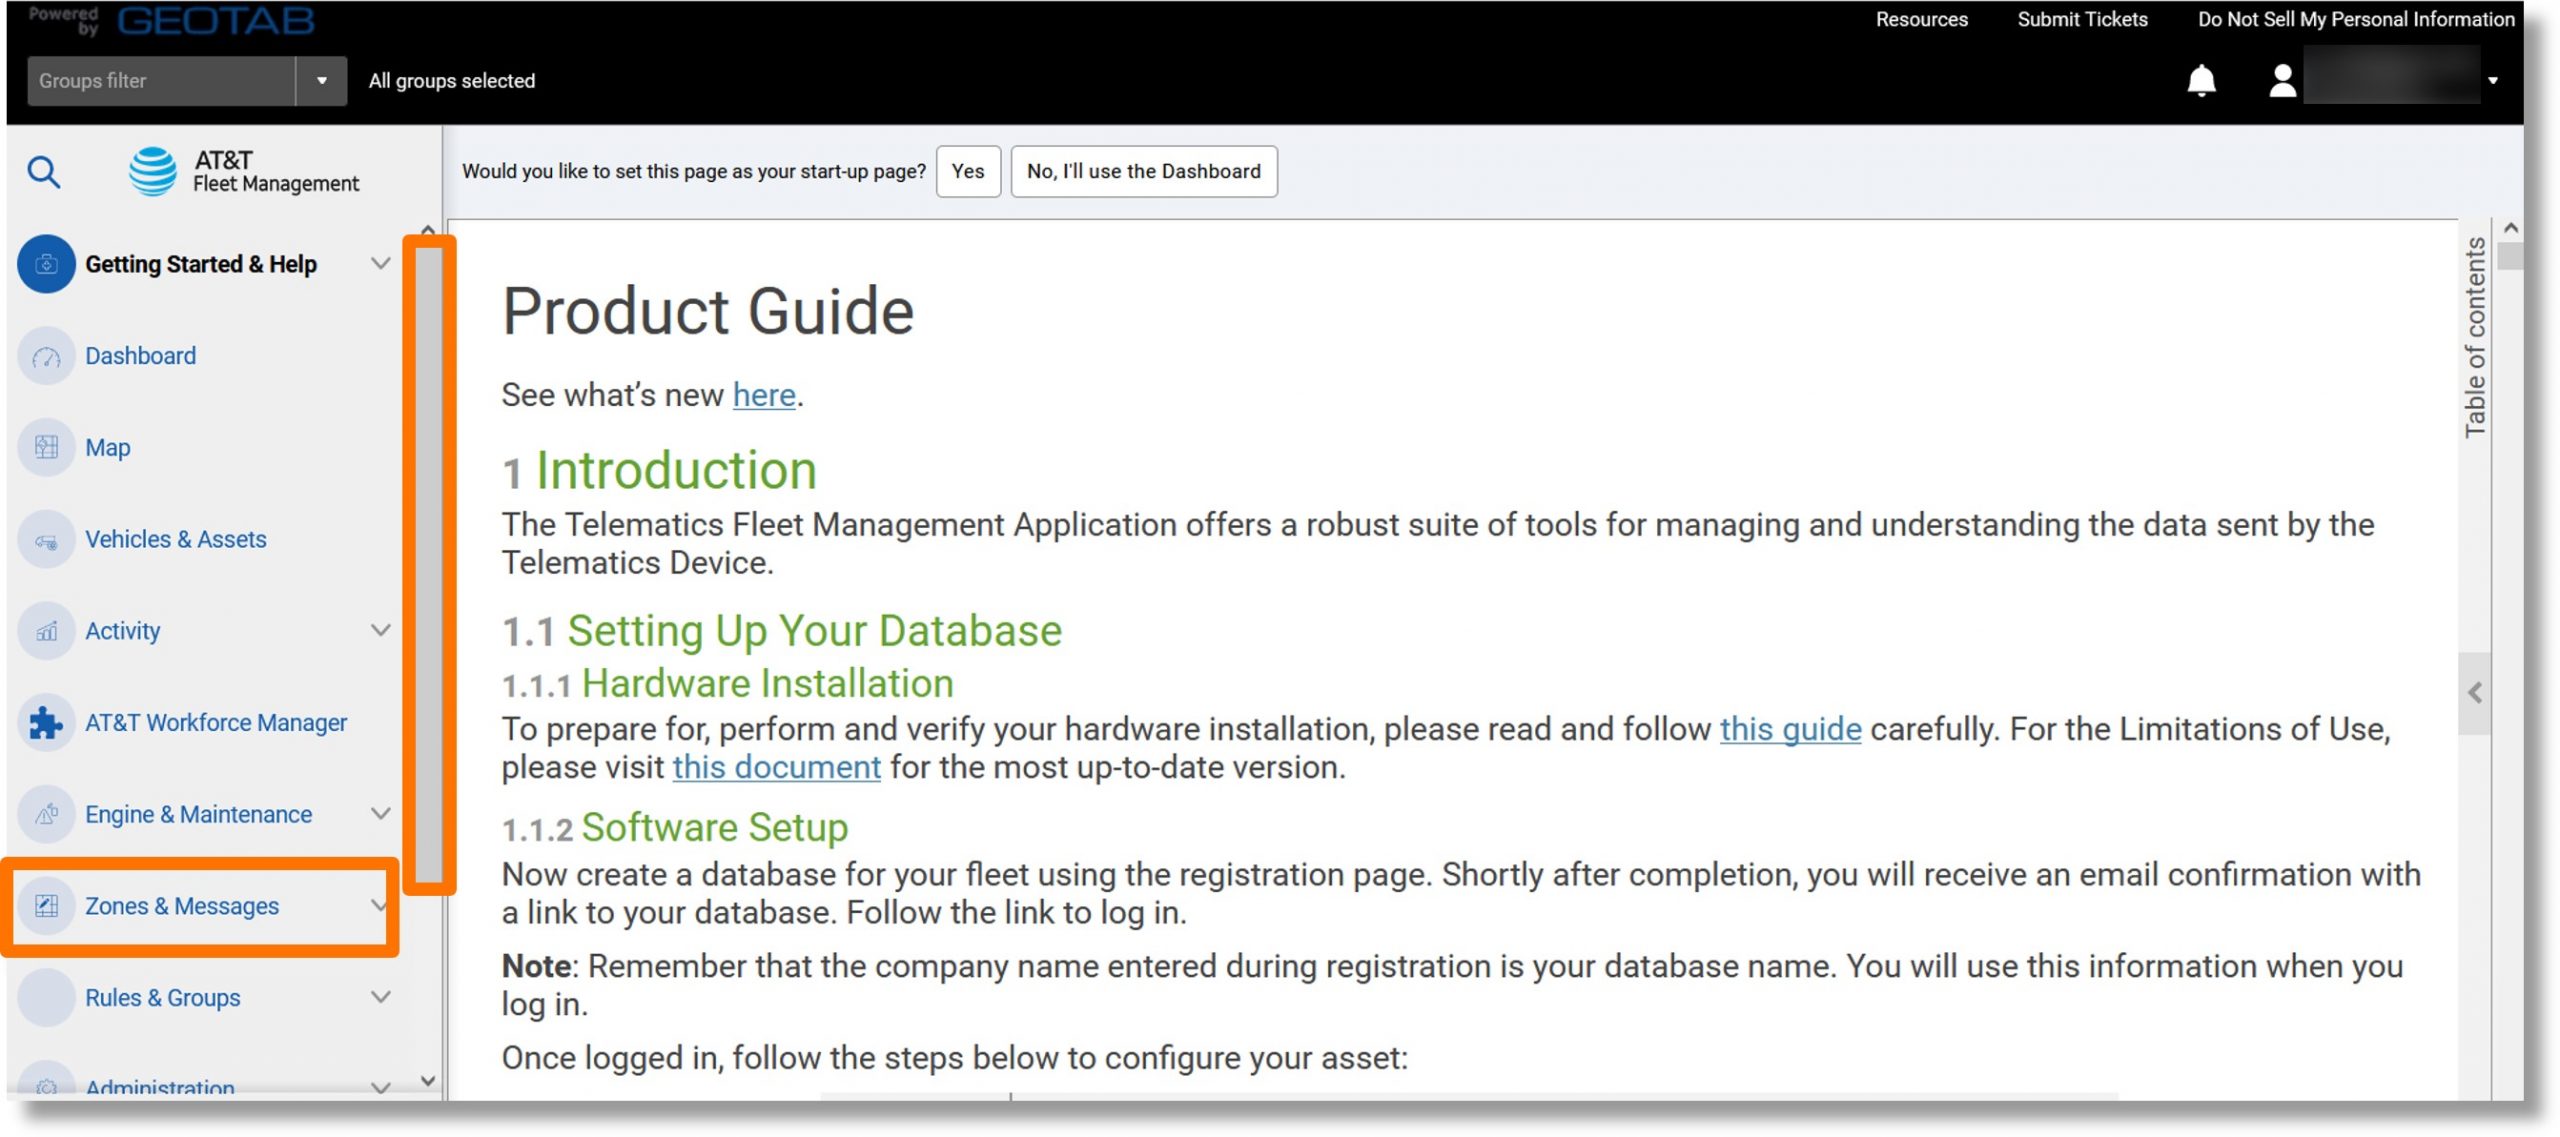
- Click on Zones.
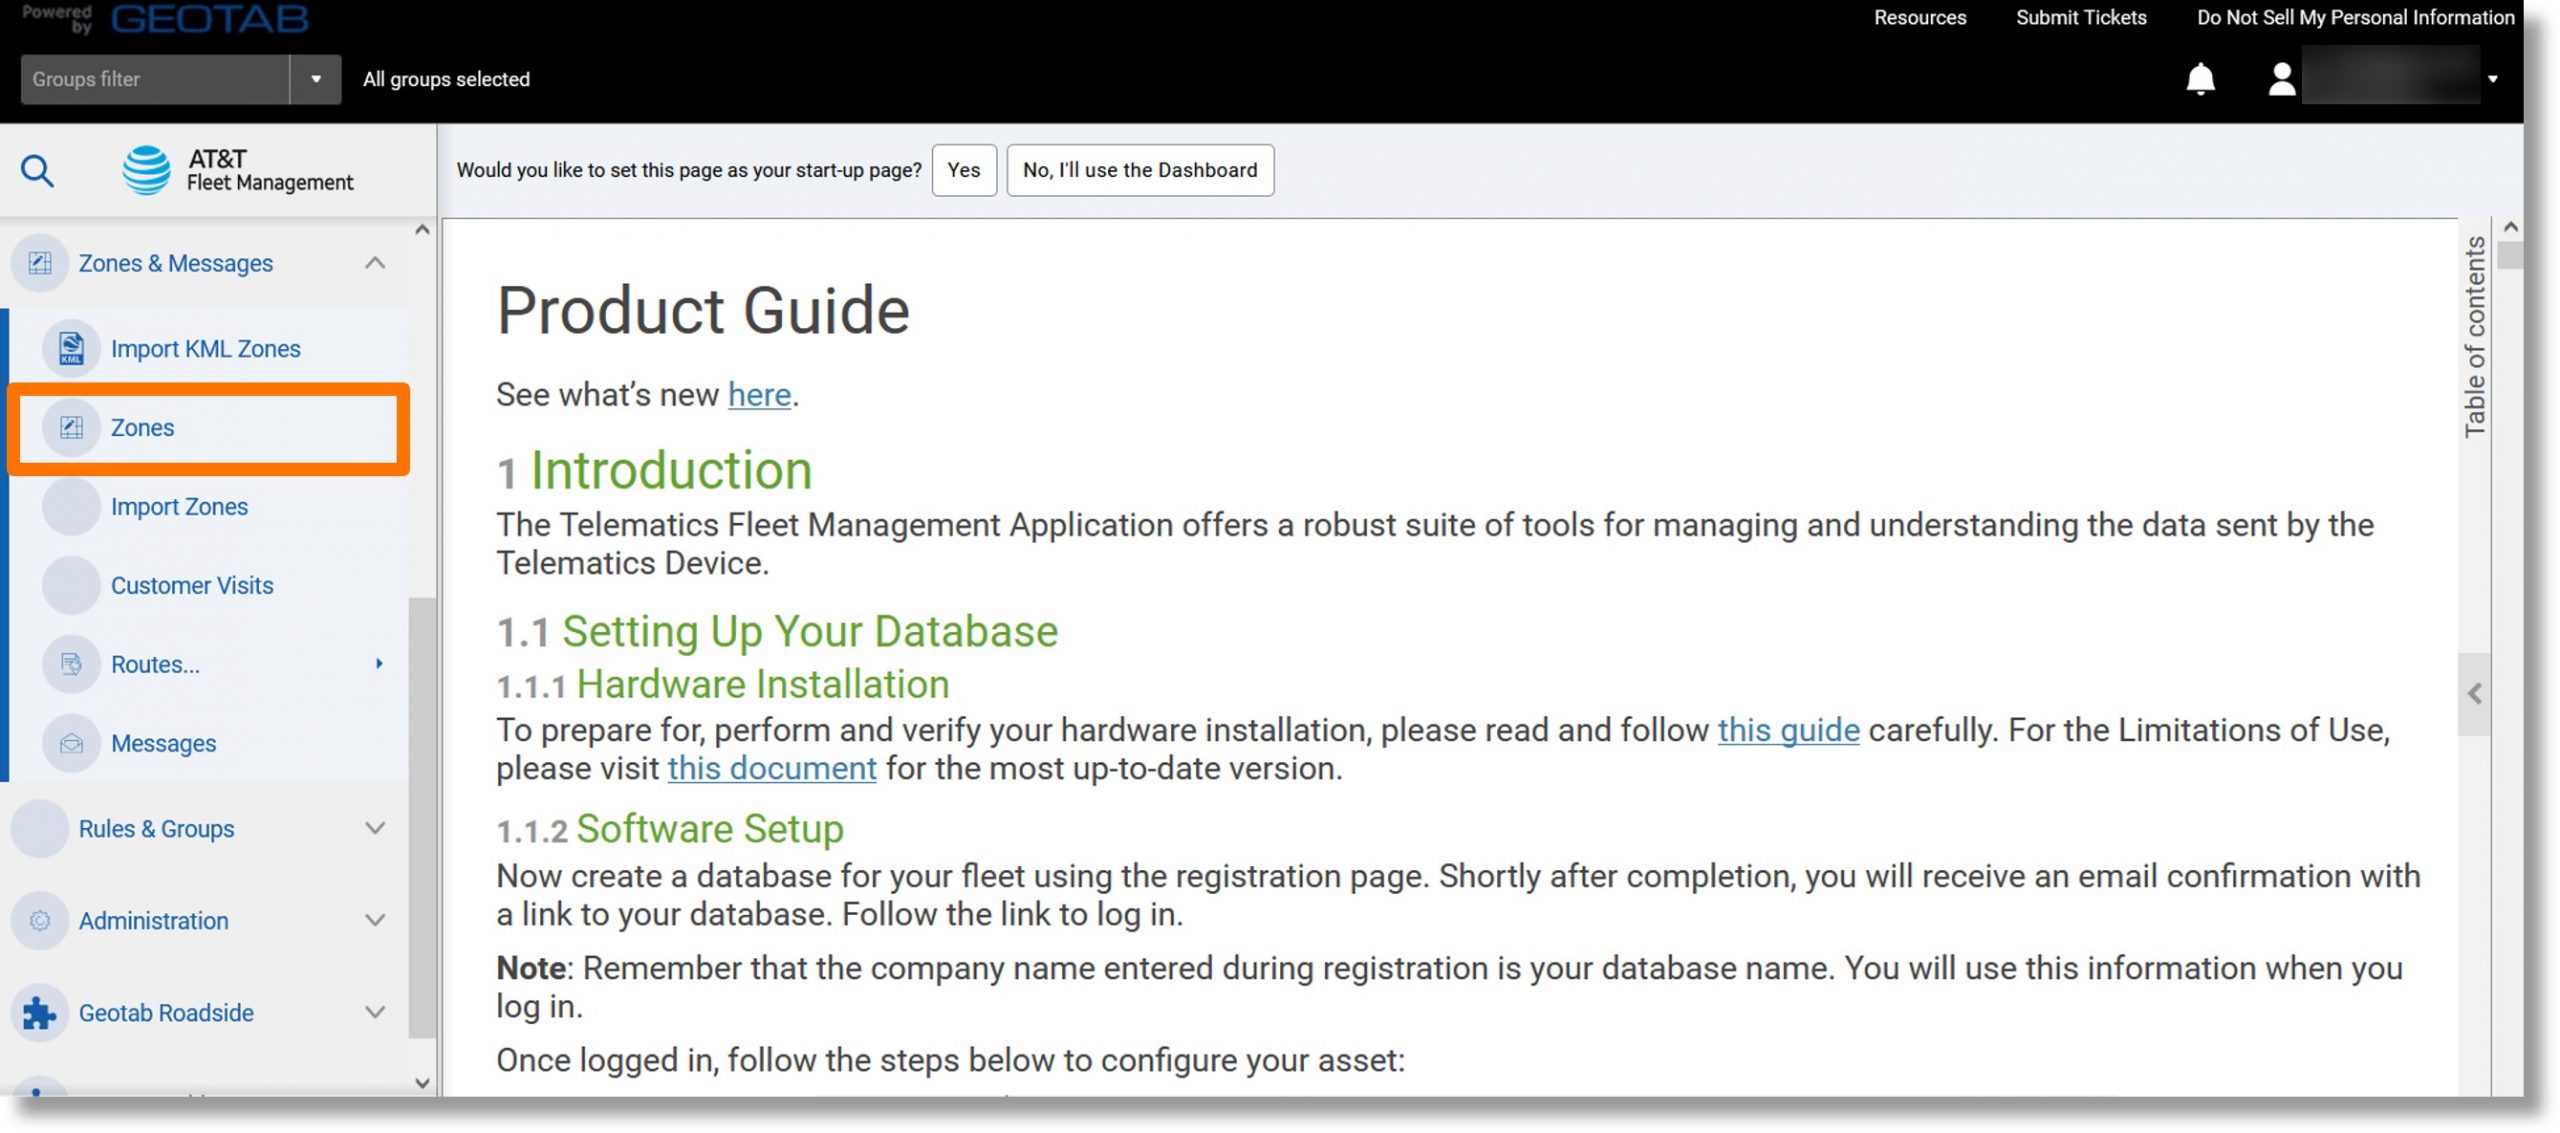
- Click on the Report dropdown.
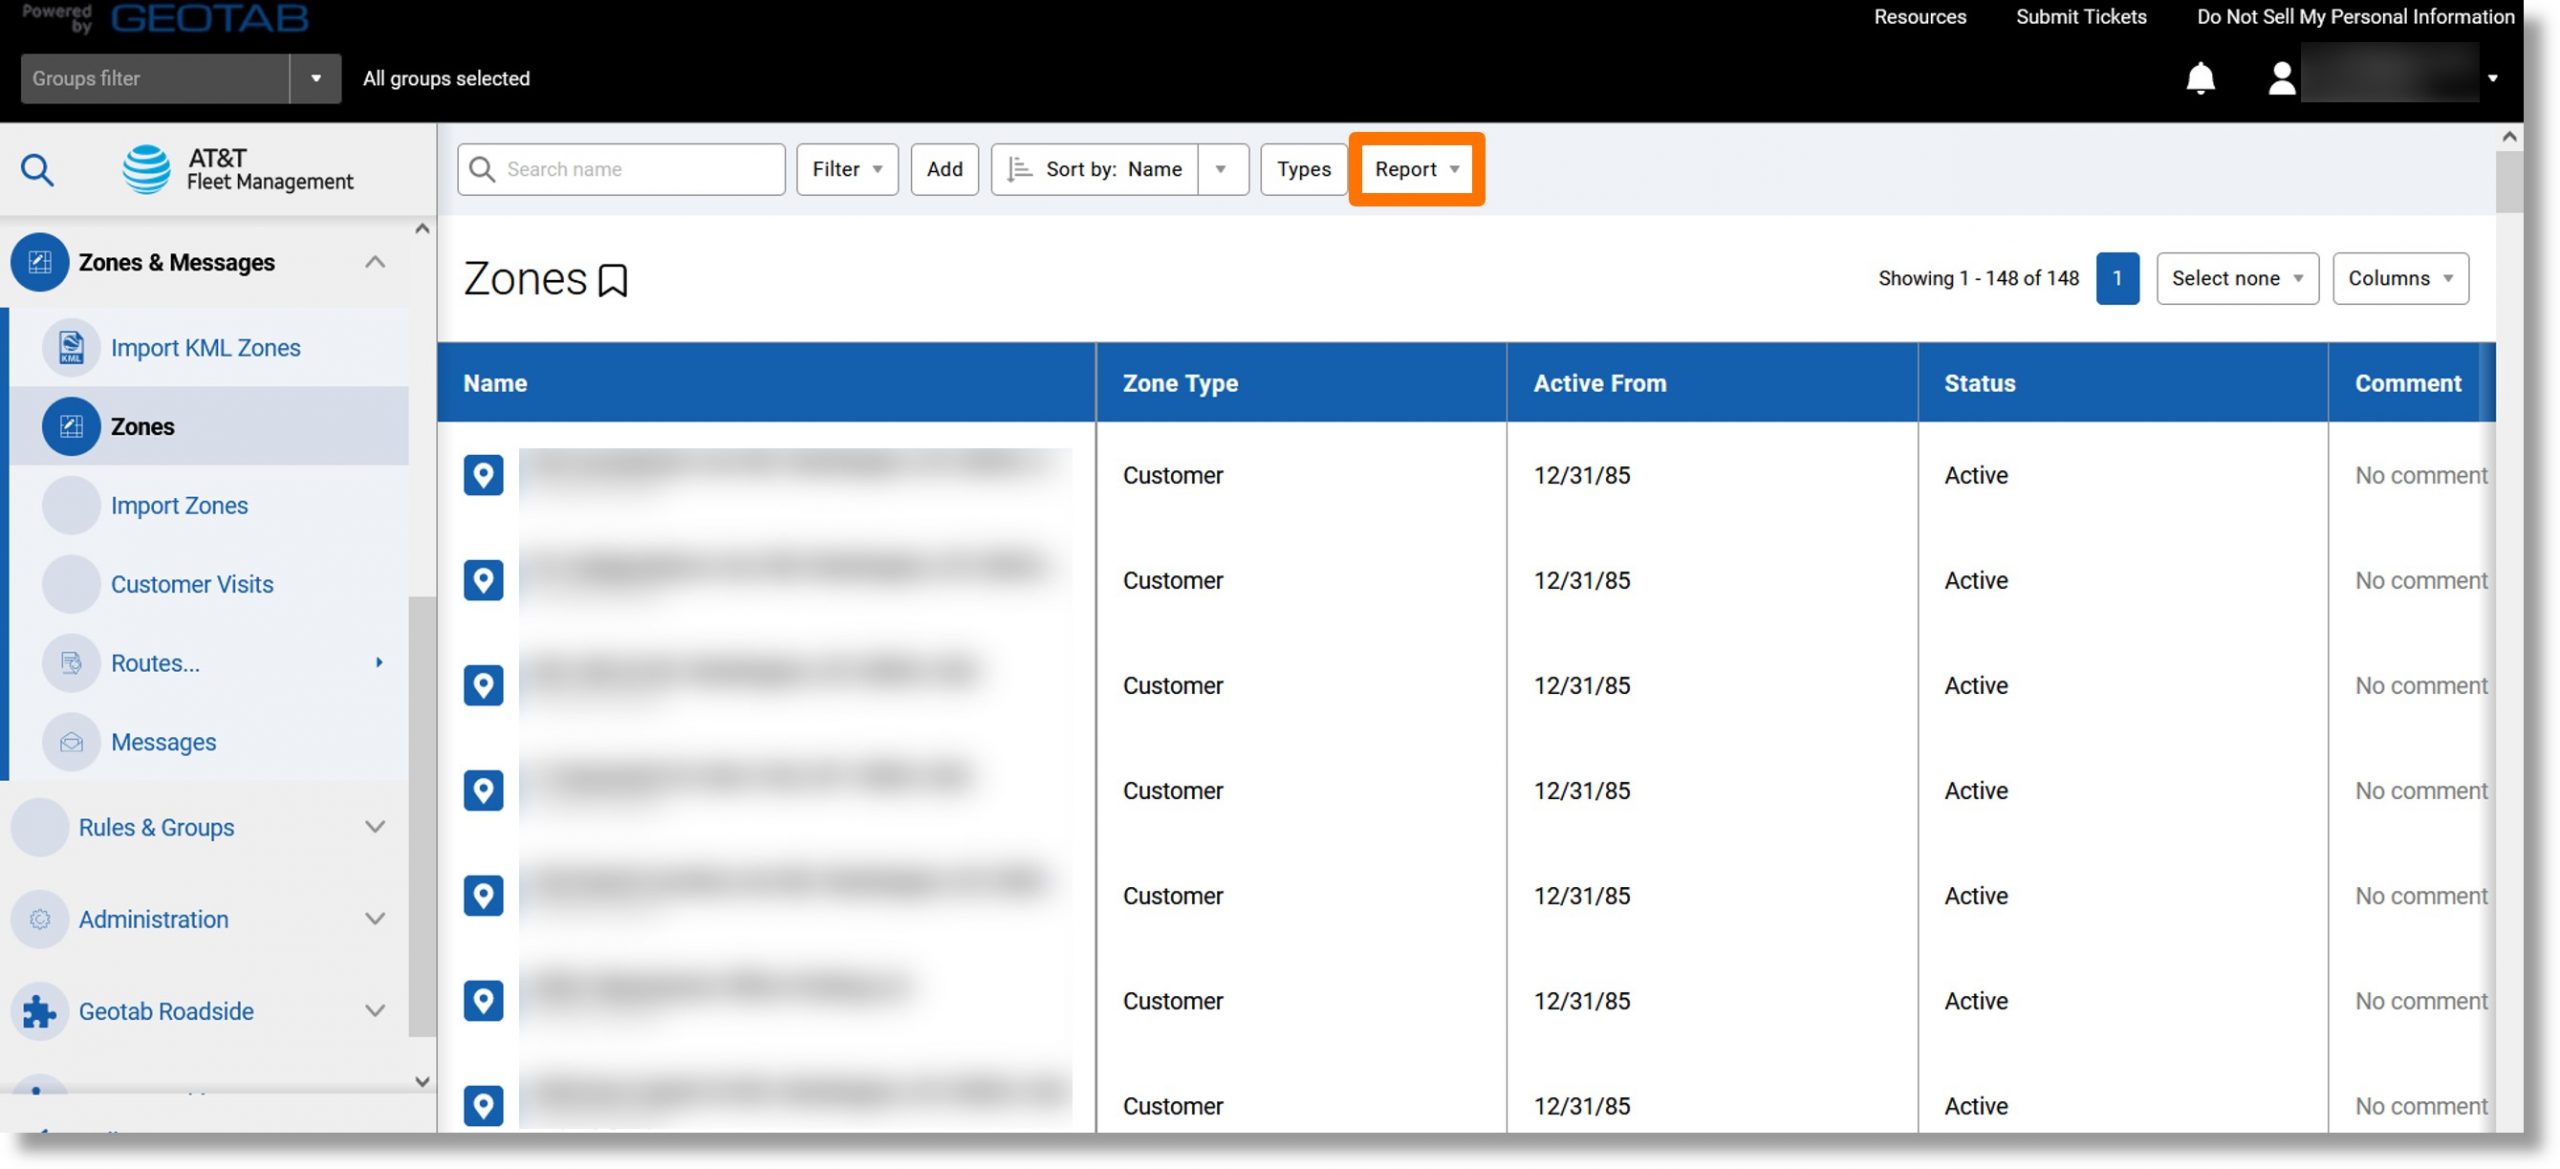
- Click the ellipsis icon
 to the right of either “Standard or “Advanced” and then click on View in browser.
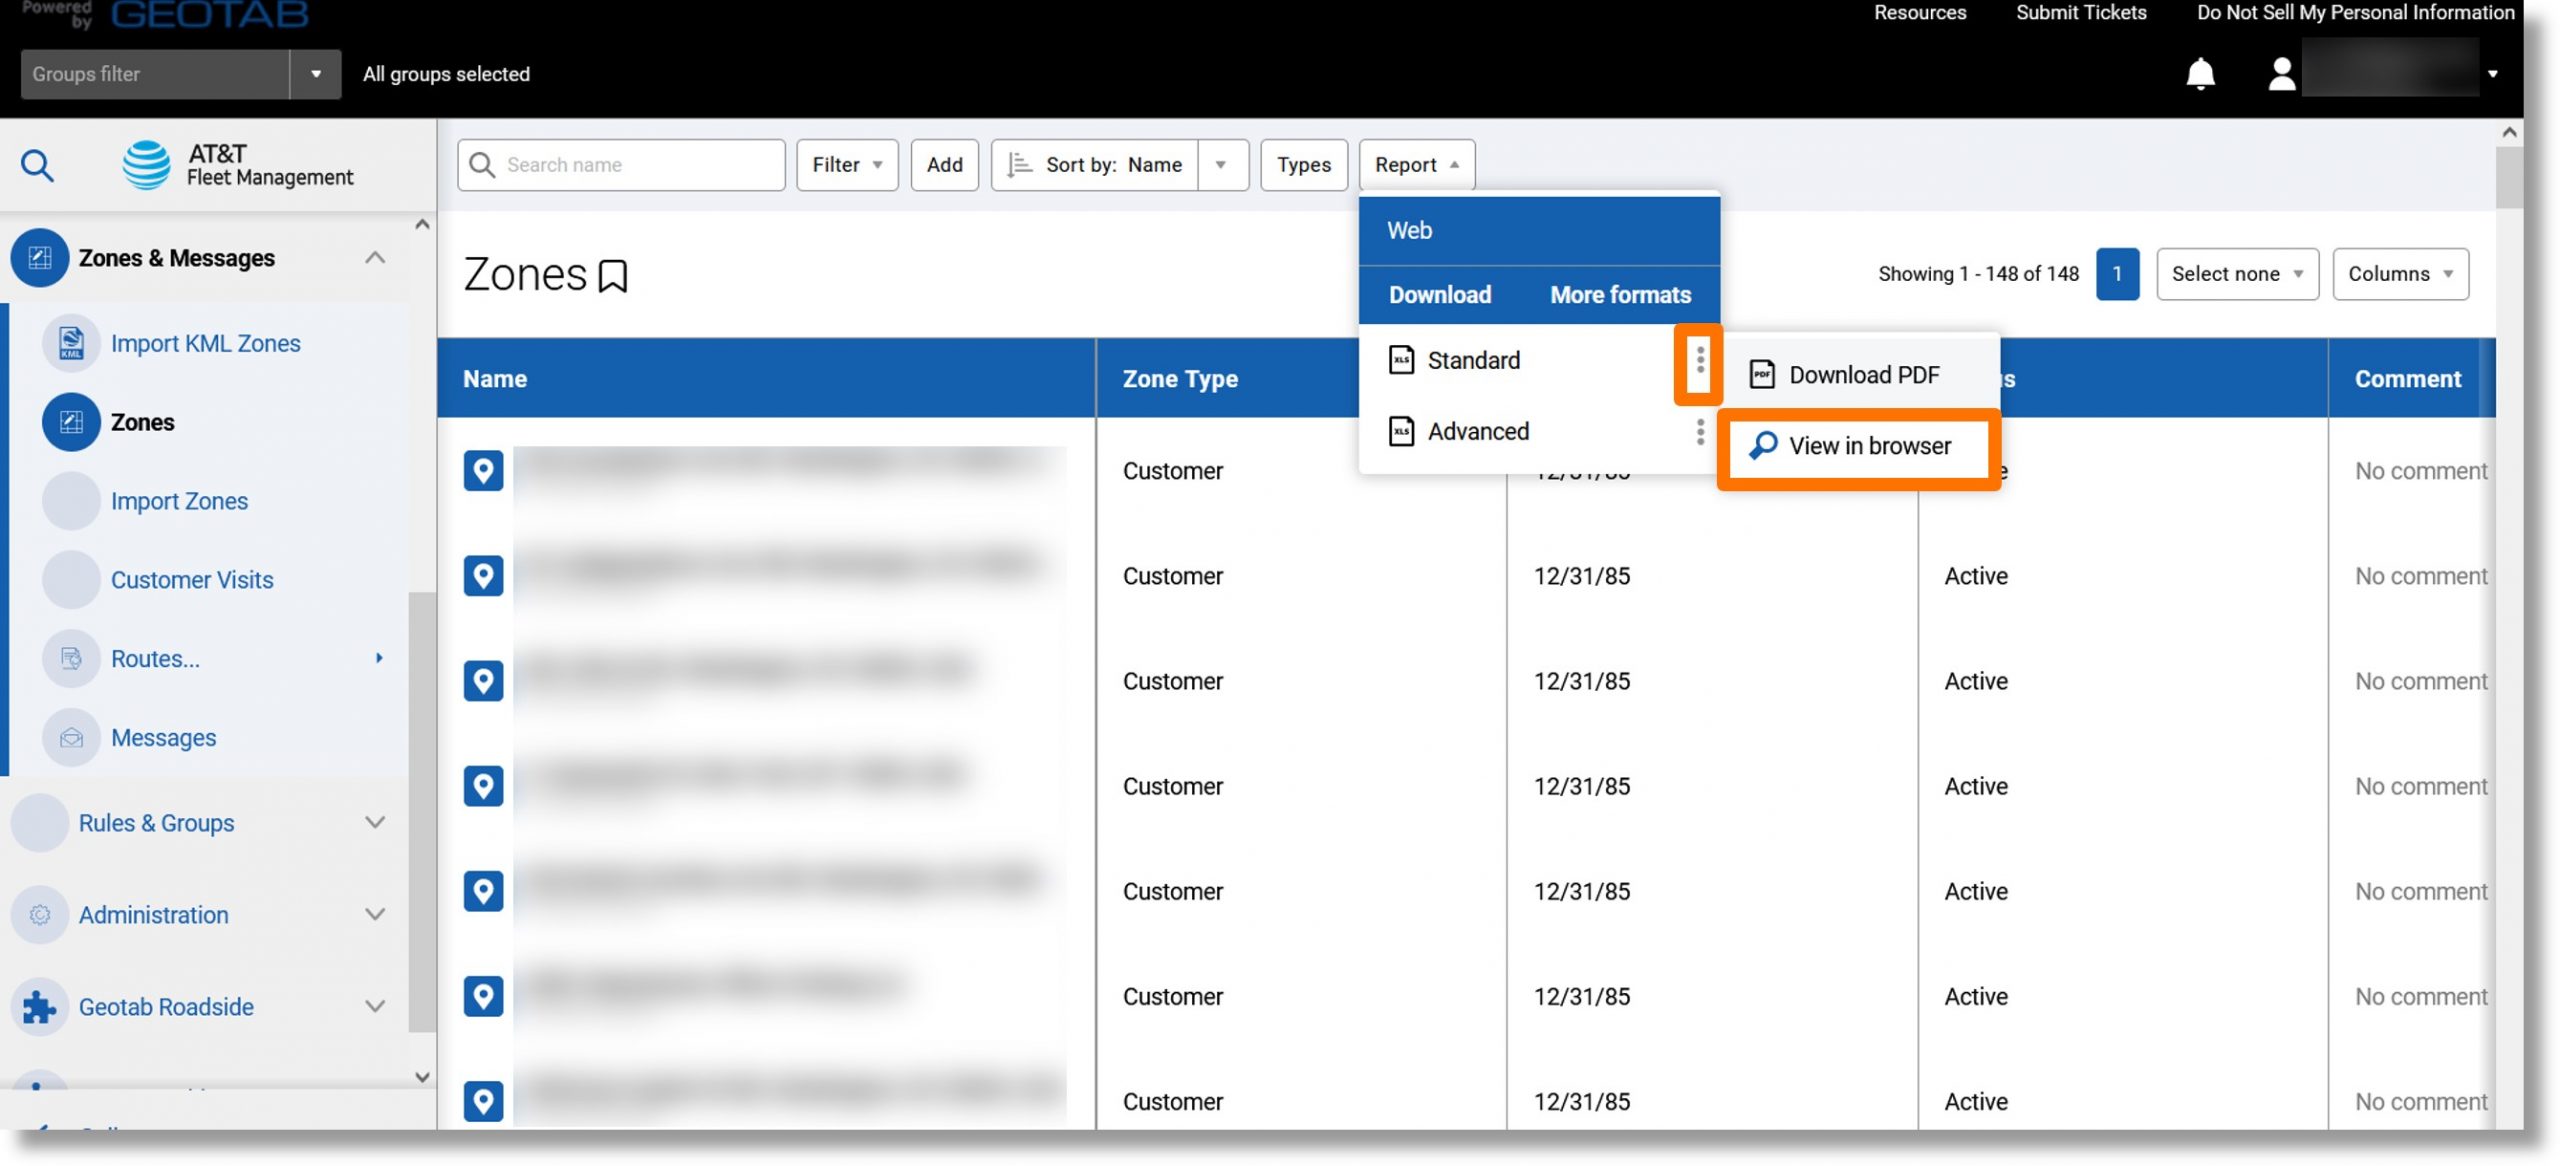
- The report displays.
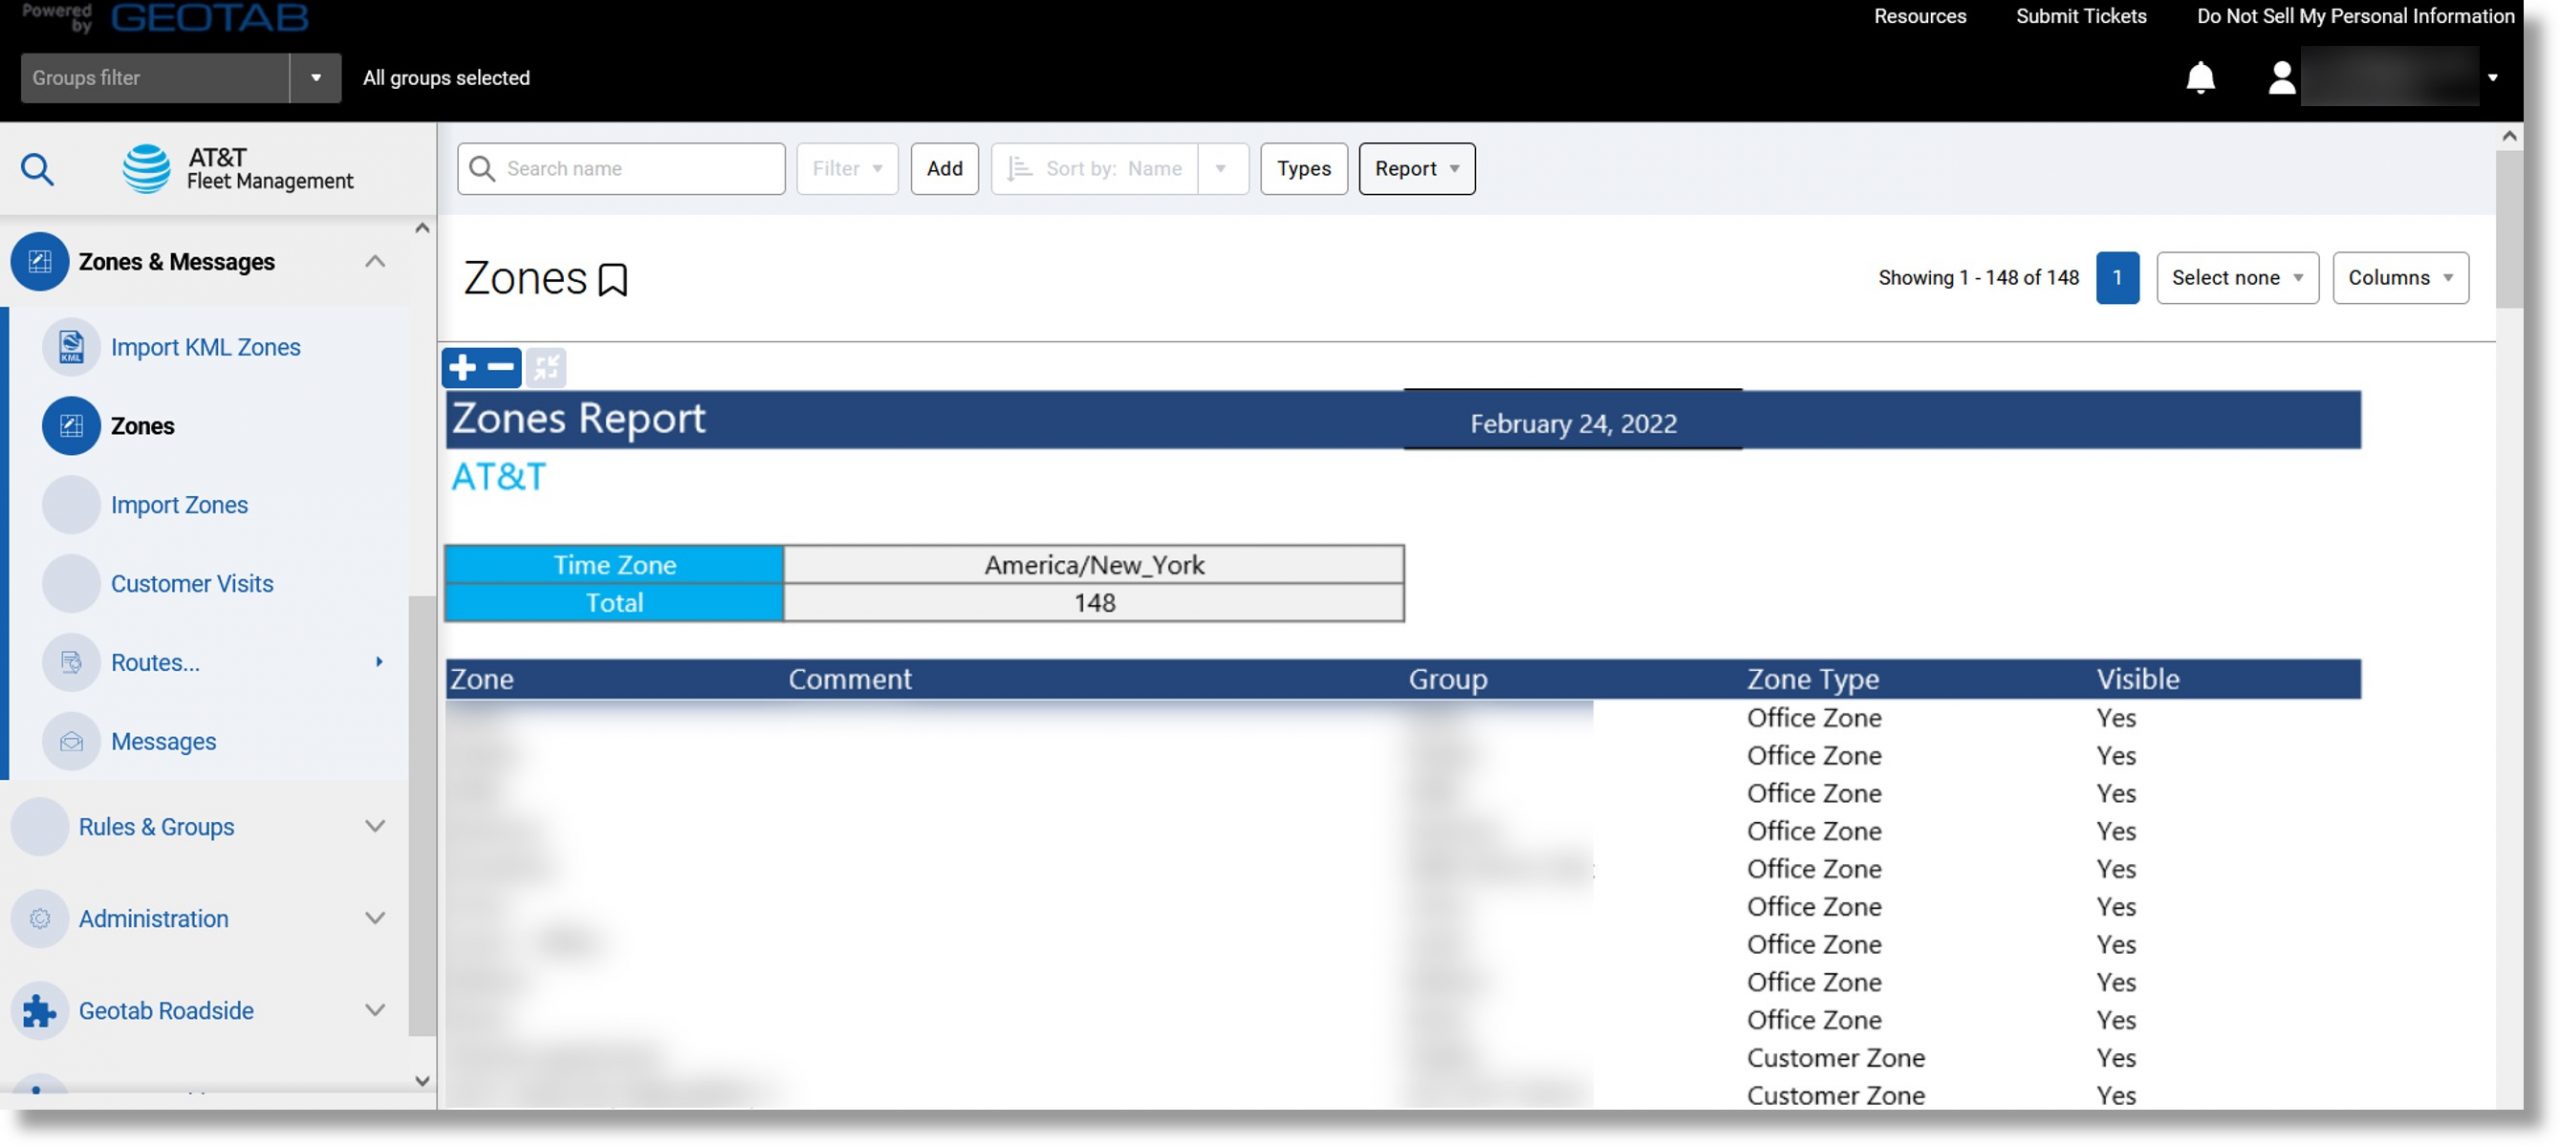
Top
Groups Report
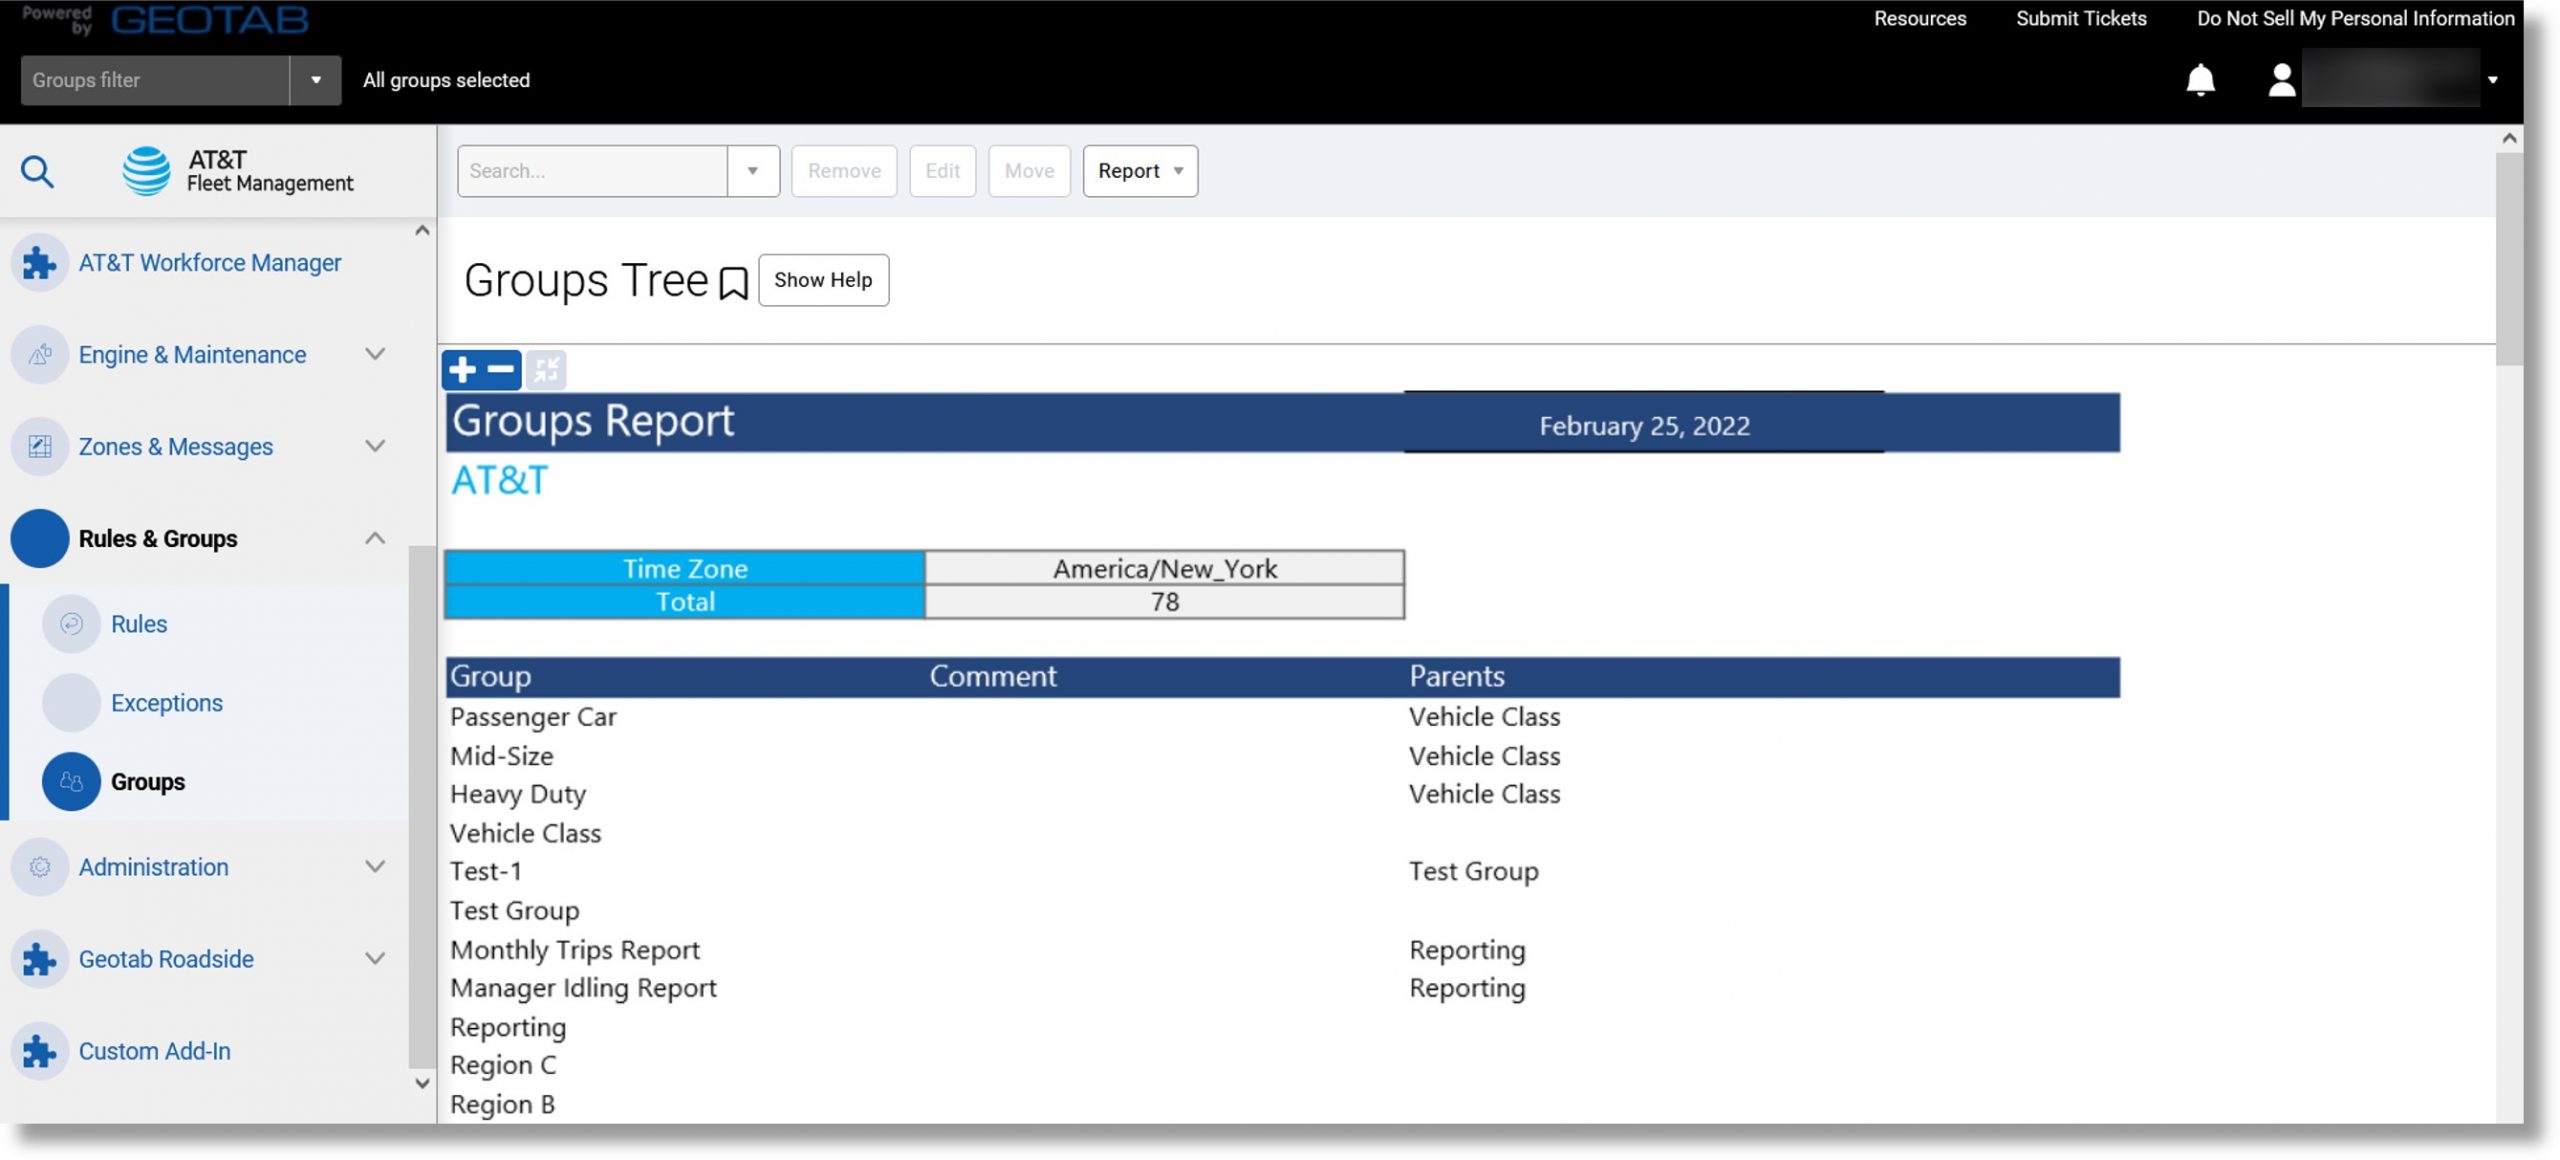
Use: Lists the groups created in the database
Information included: Group name, comments, parent group
Accessing the report:
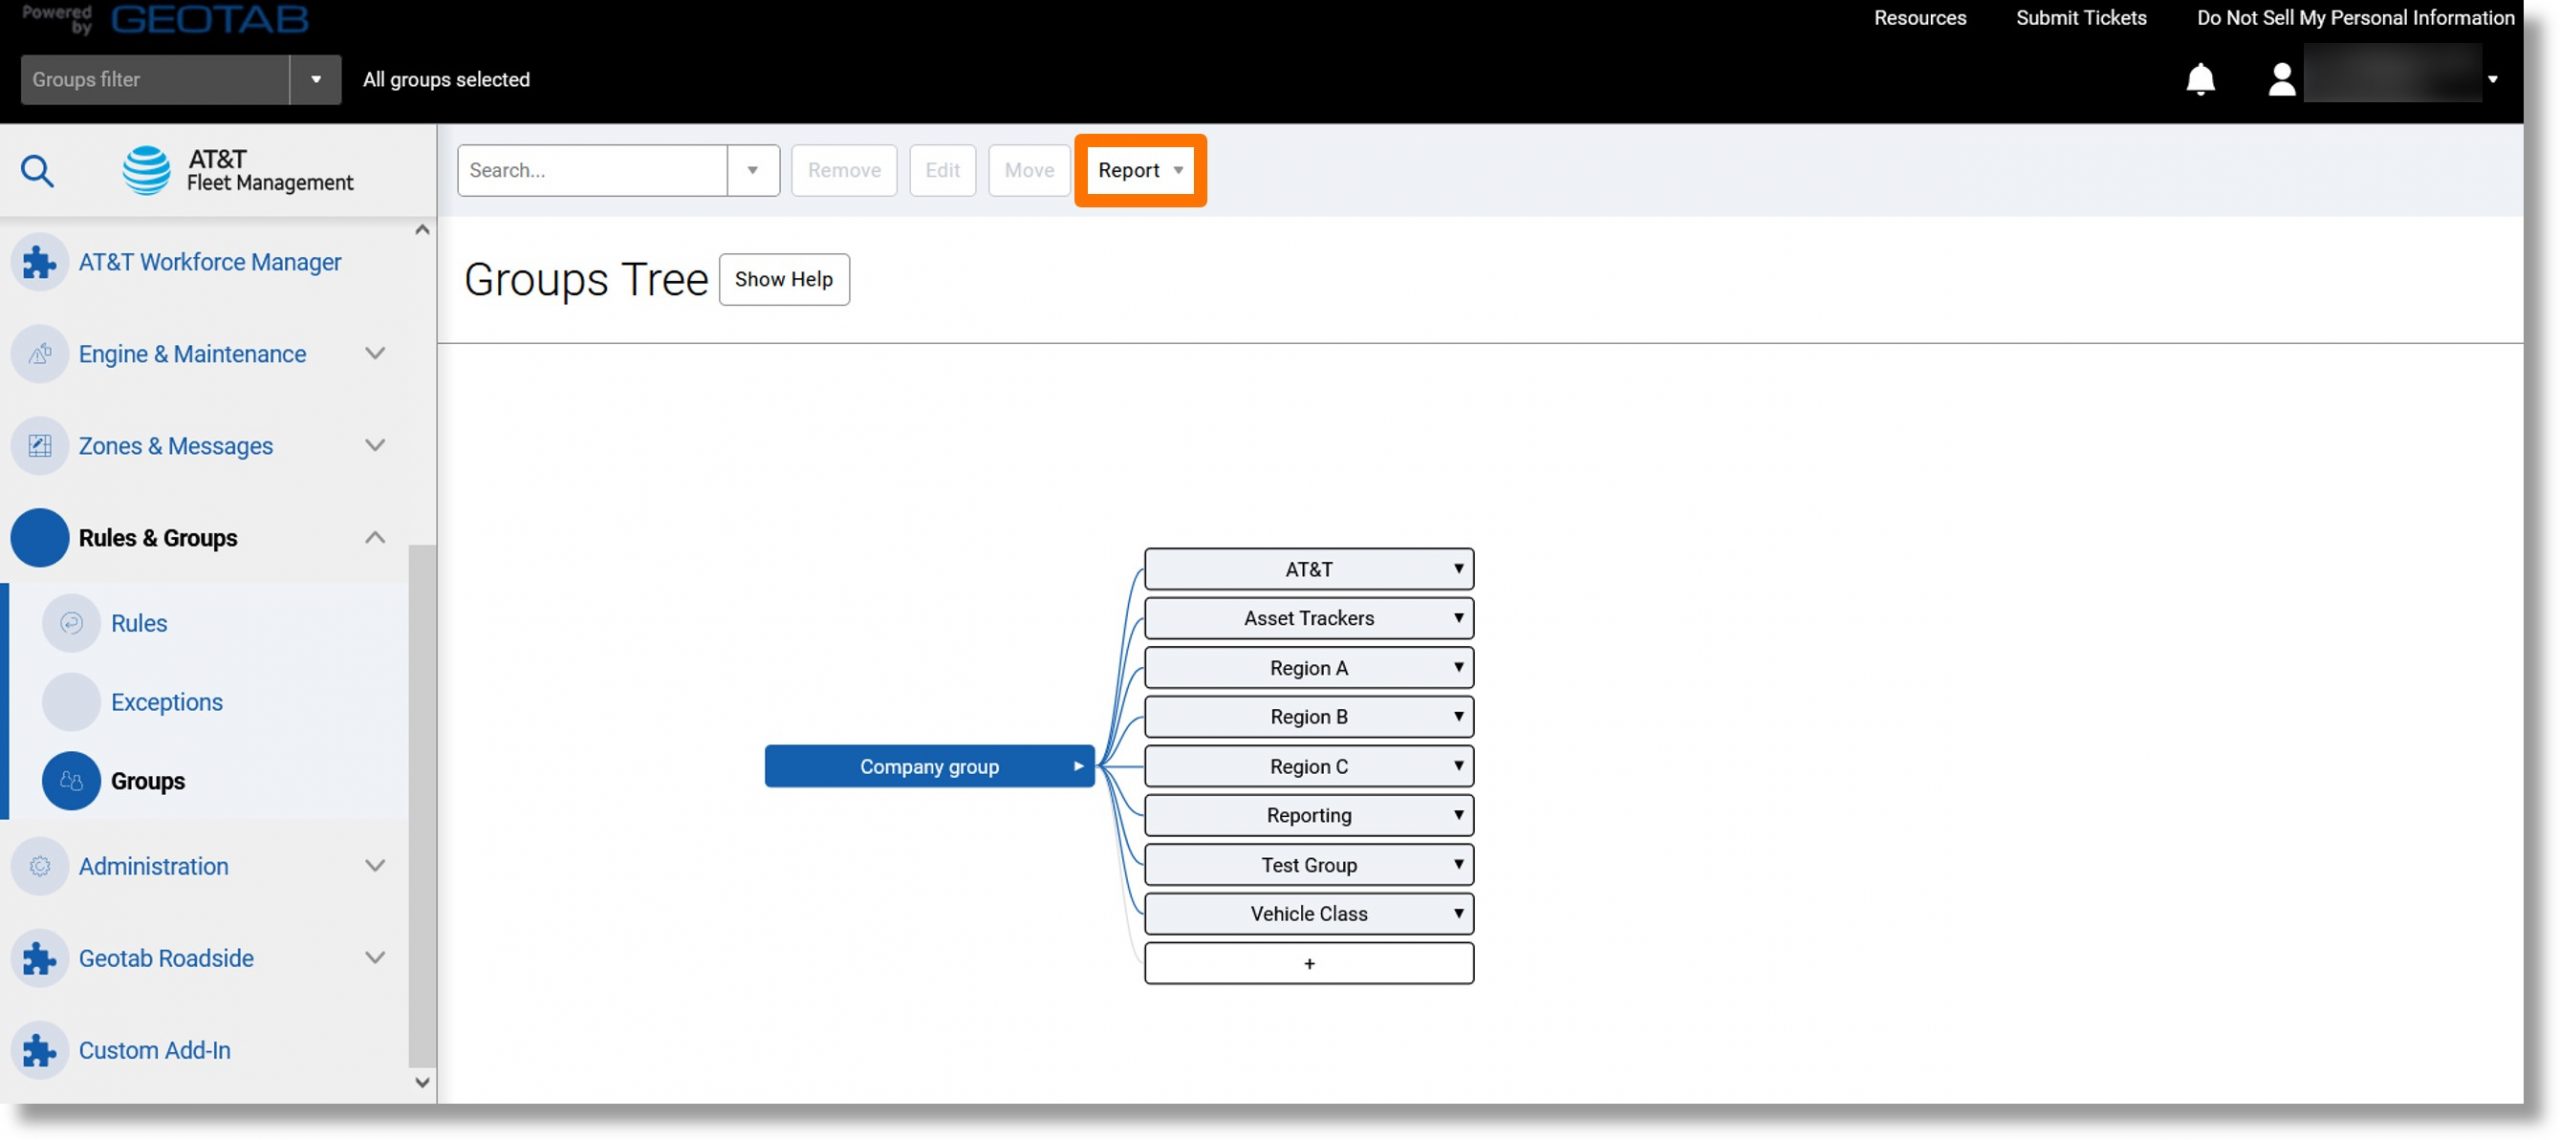
- Click on Rules & Groups in the menu on the left.
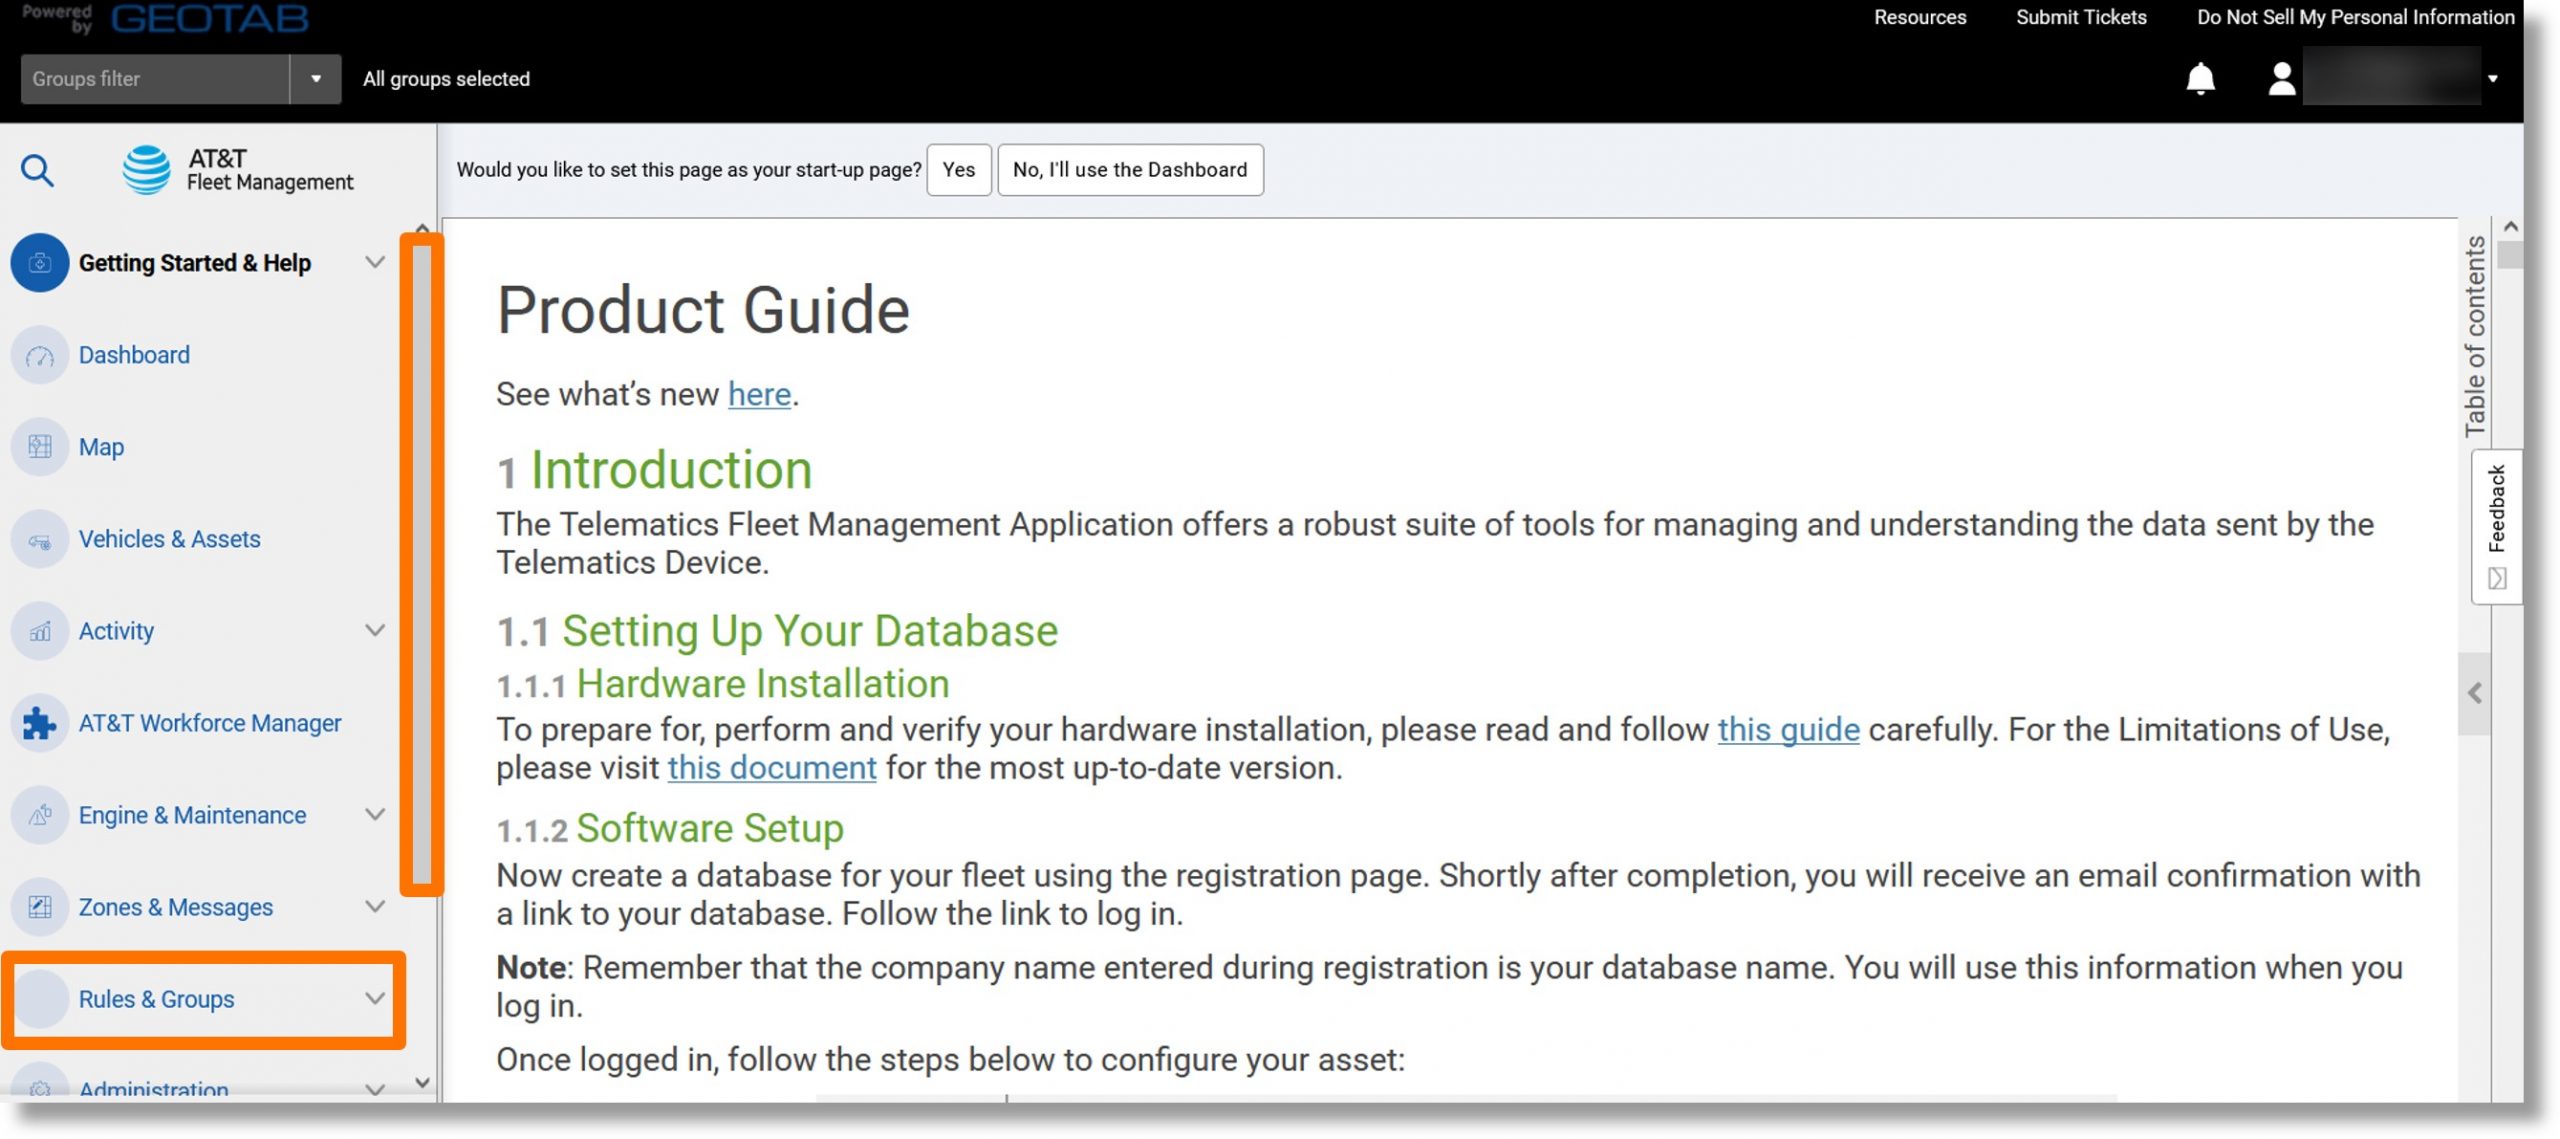
- Click on Groups.
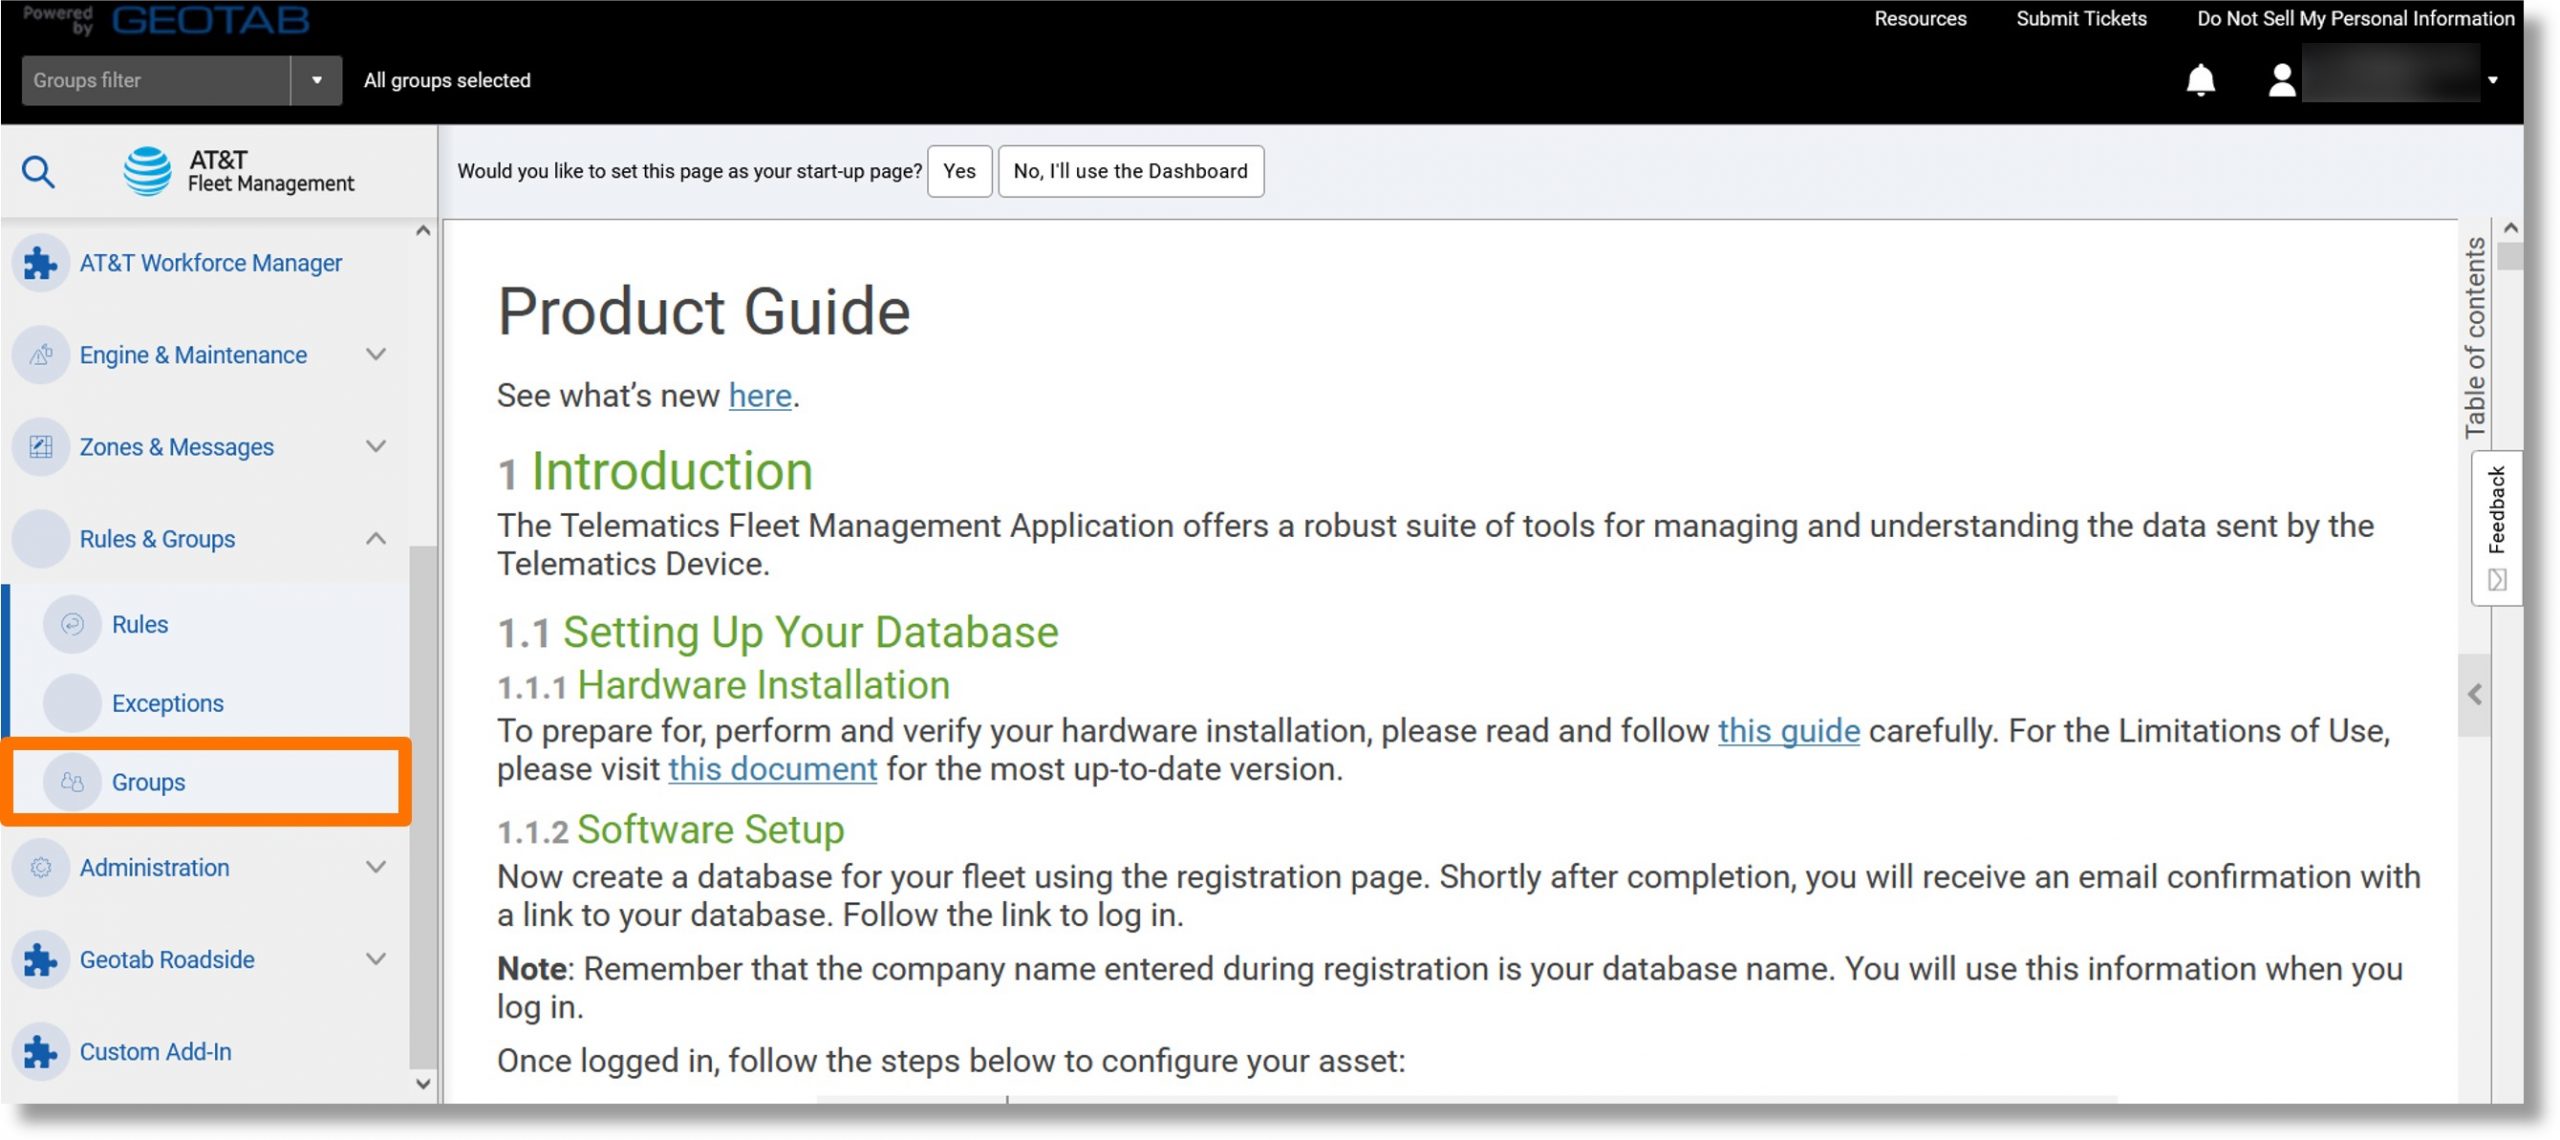
- Click on the Report dropdown.
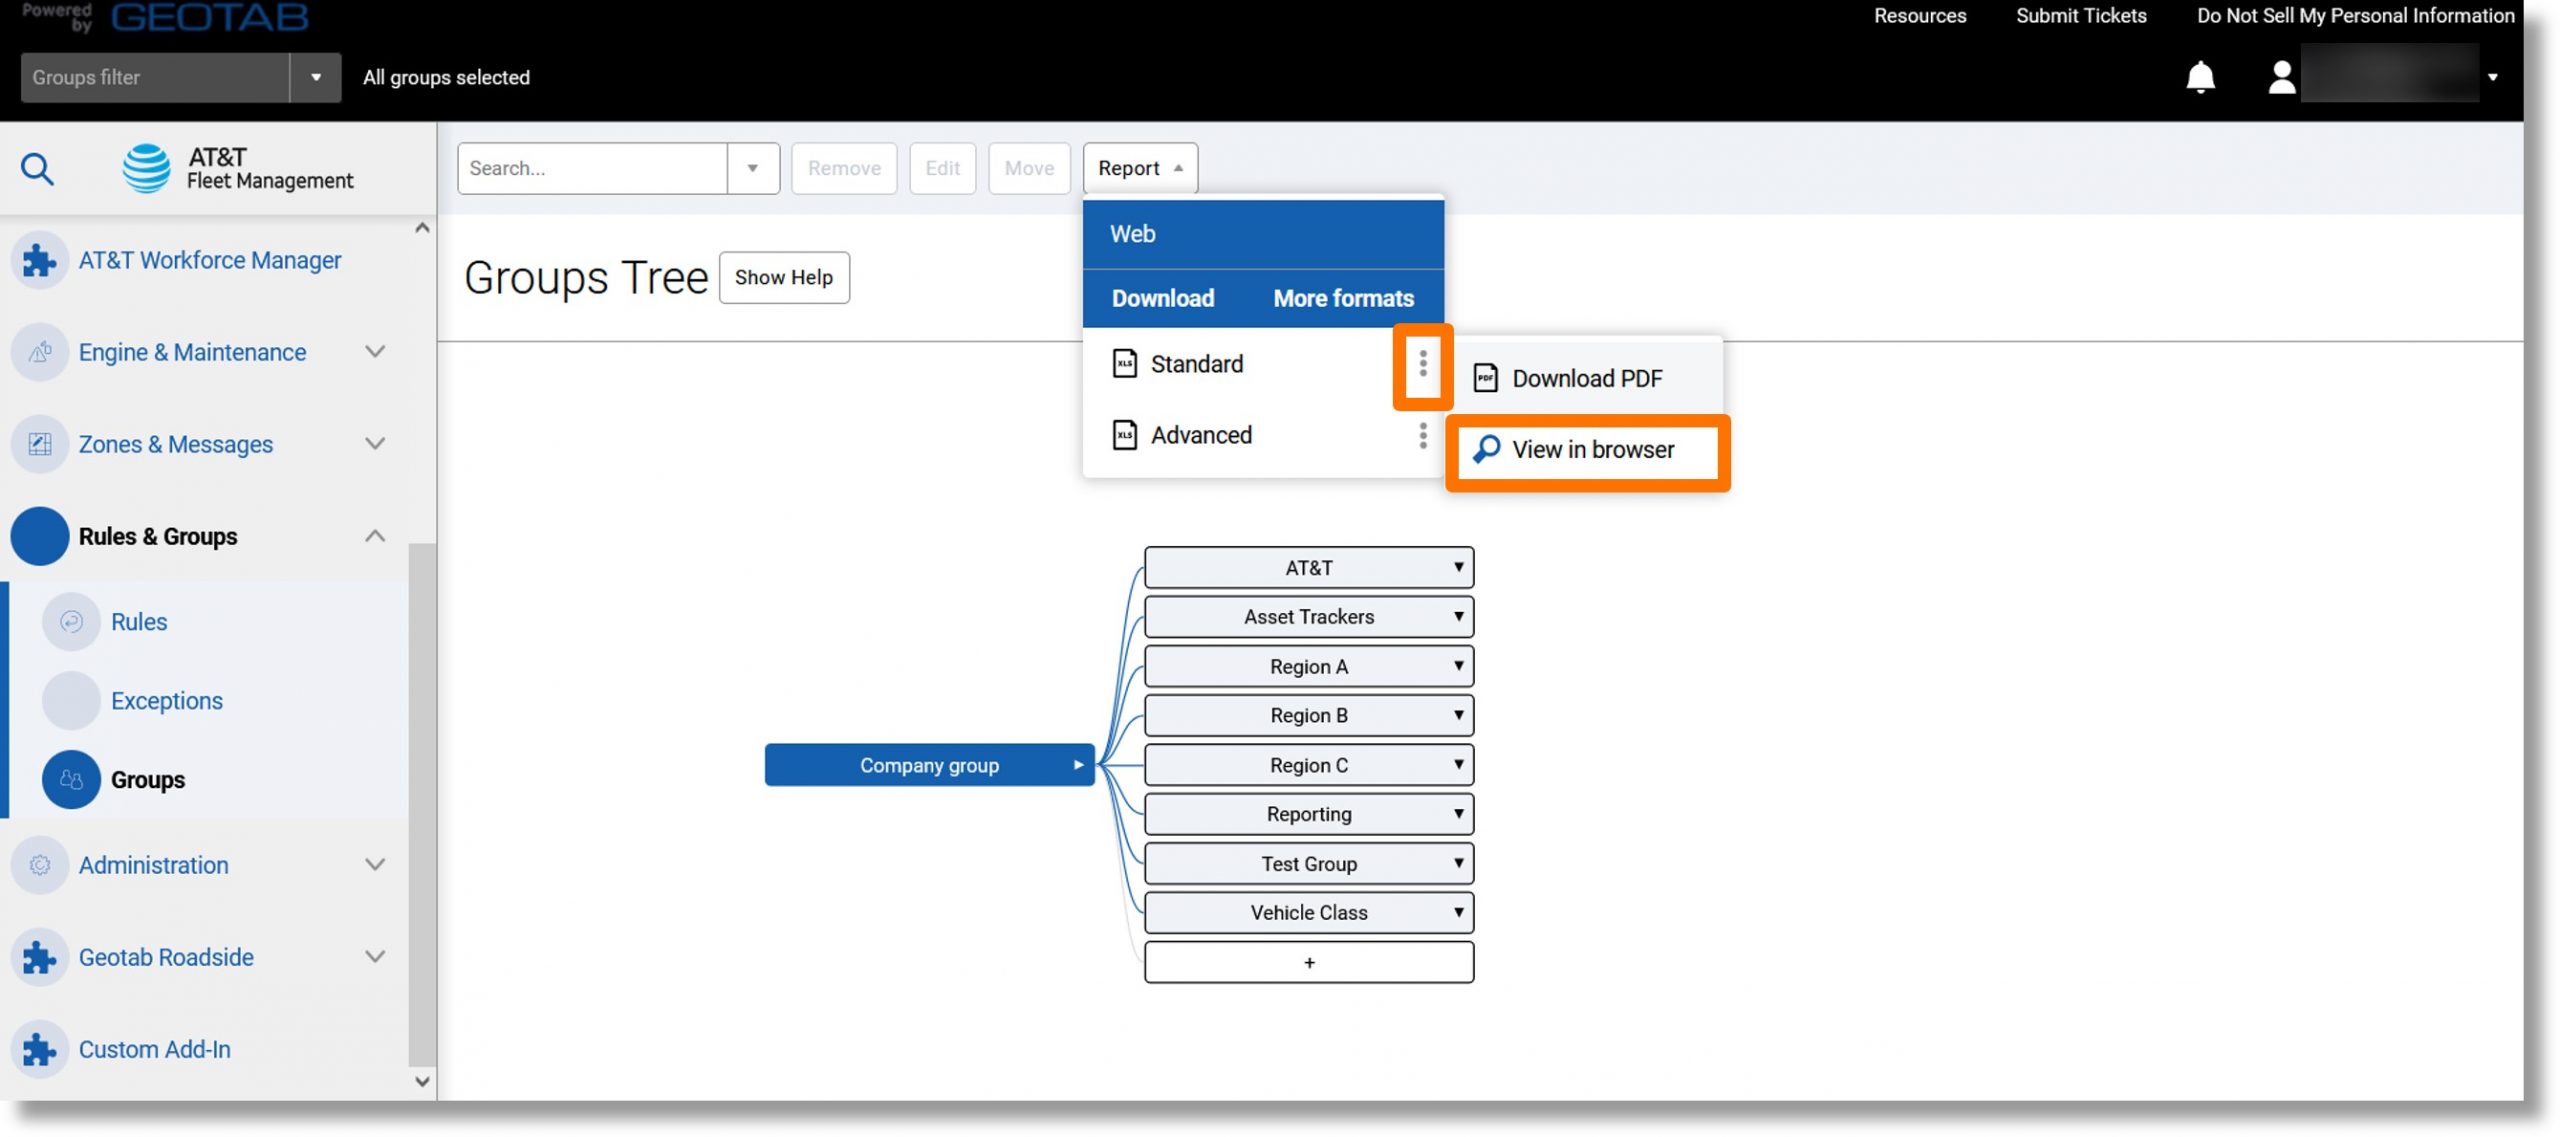
- Click on the ellipsis icon
 to the right of either “Standard” or “Advanced” and then click on View in browser.
- The Groups report displays.
Top
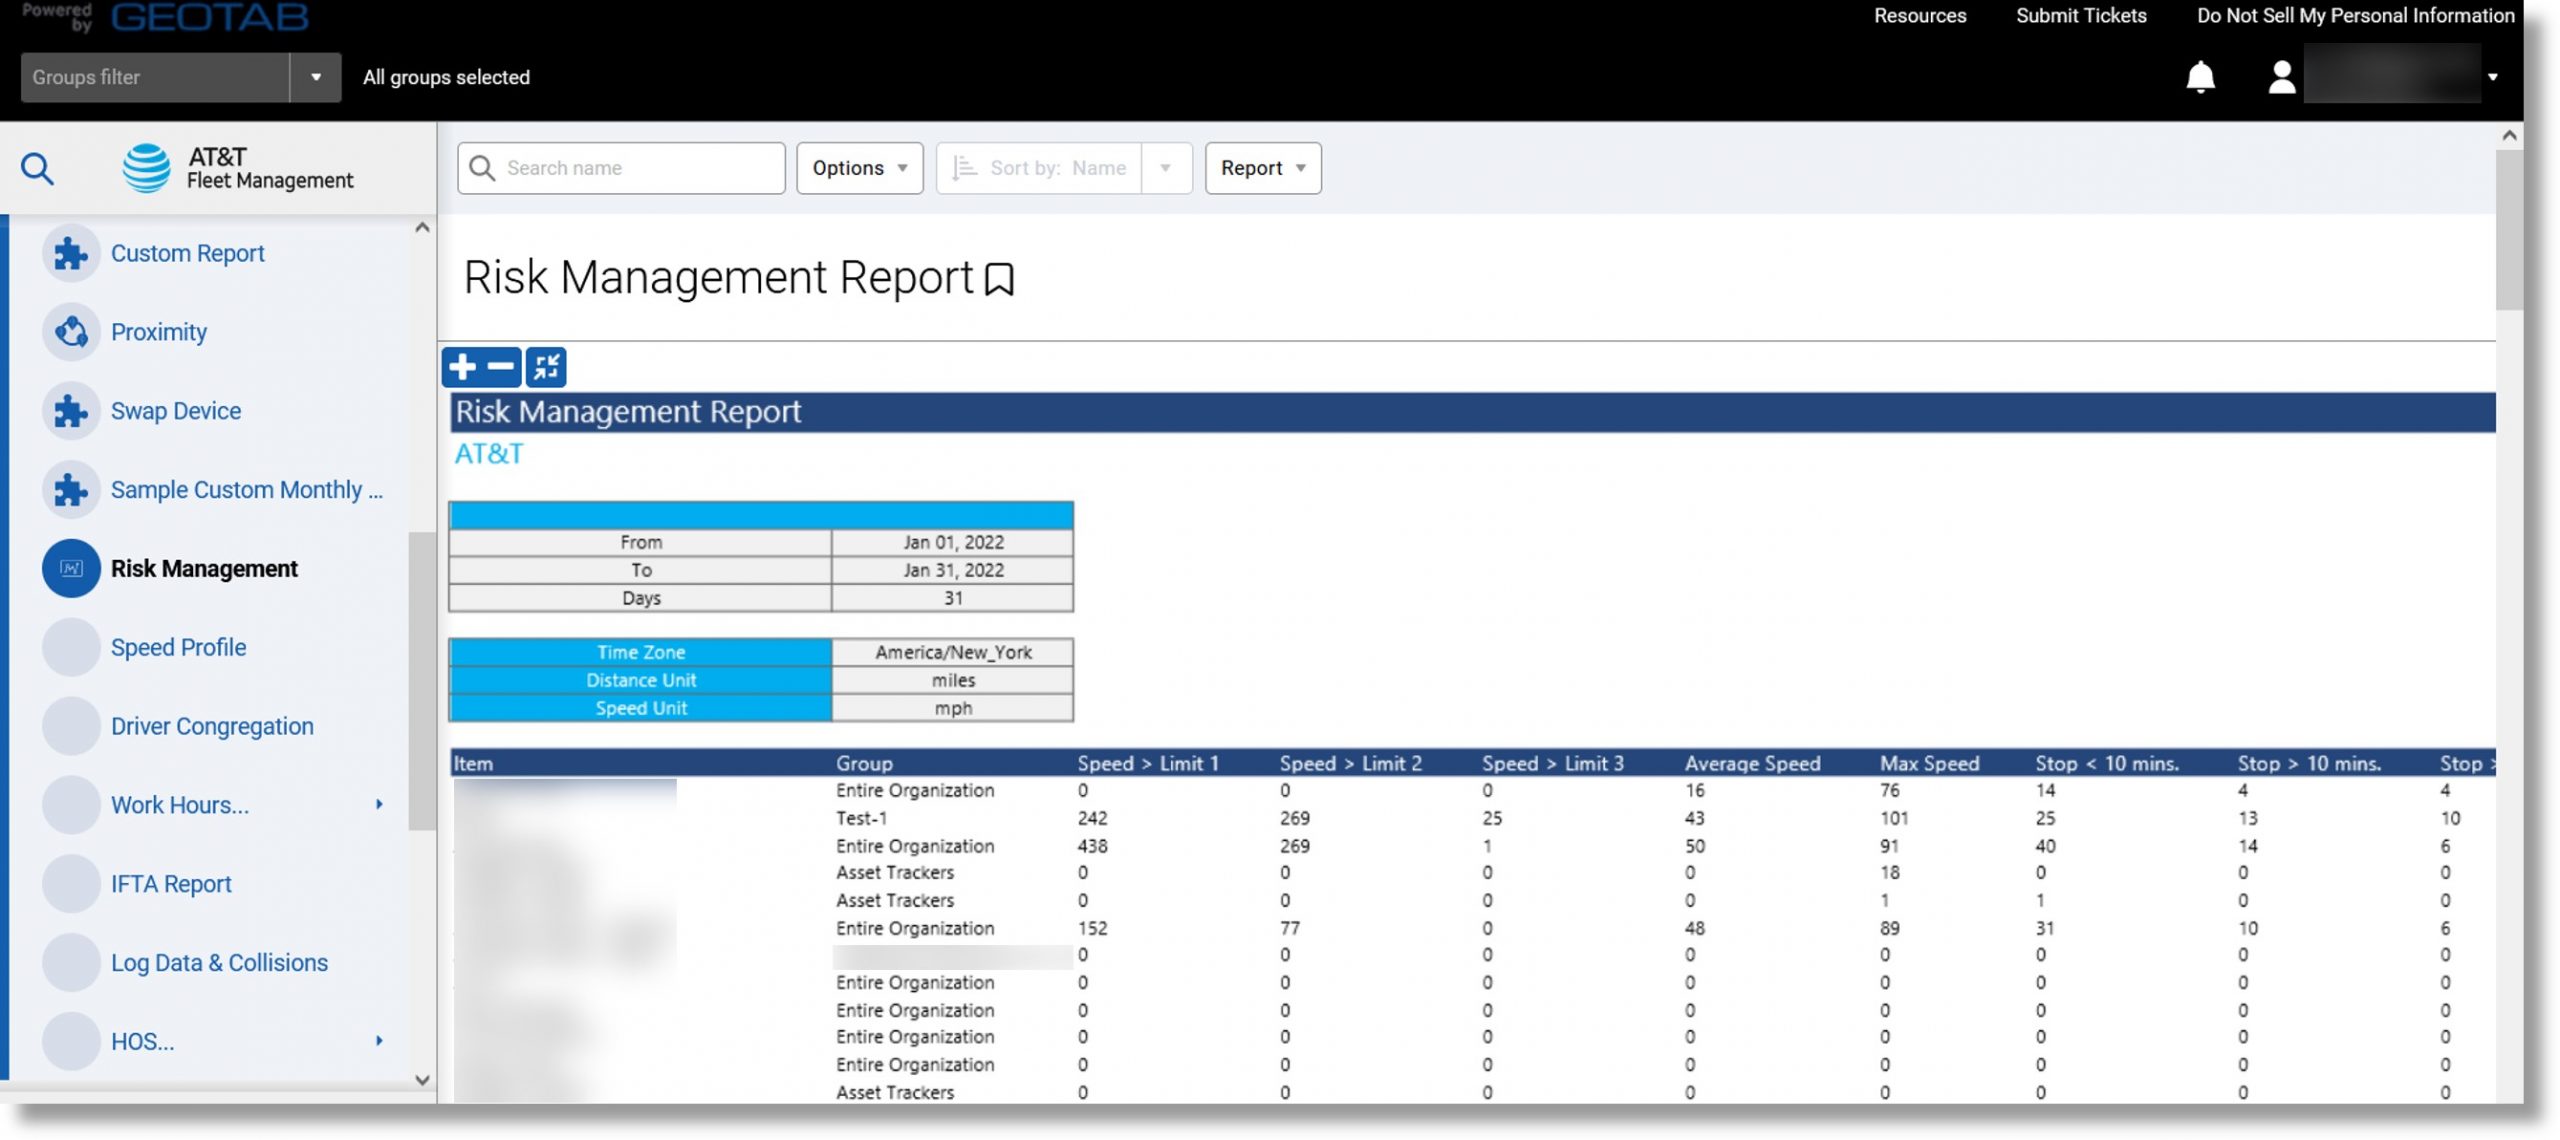
Risk Management Report
Use: The report is often used as a template to create various meaningful reports. For example, driver scorecard – manage driver performance.
Information included: Idling time, distance traveled, average speed, up to 6 exception events (duration, count, and distance), number of after hour trips and a number of stops over certain time thresholds.
Additional Information when exported: Speed bands, total stop count, average speed, total driving duration, etc.
Accessing the report:
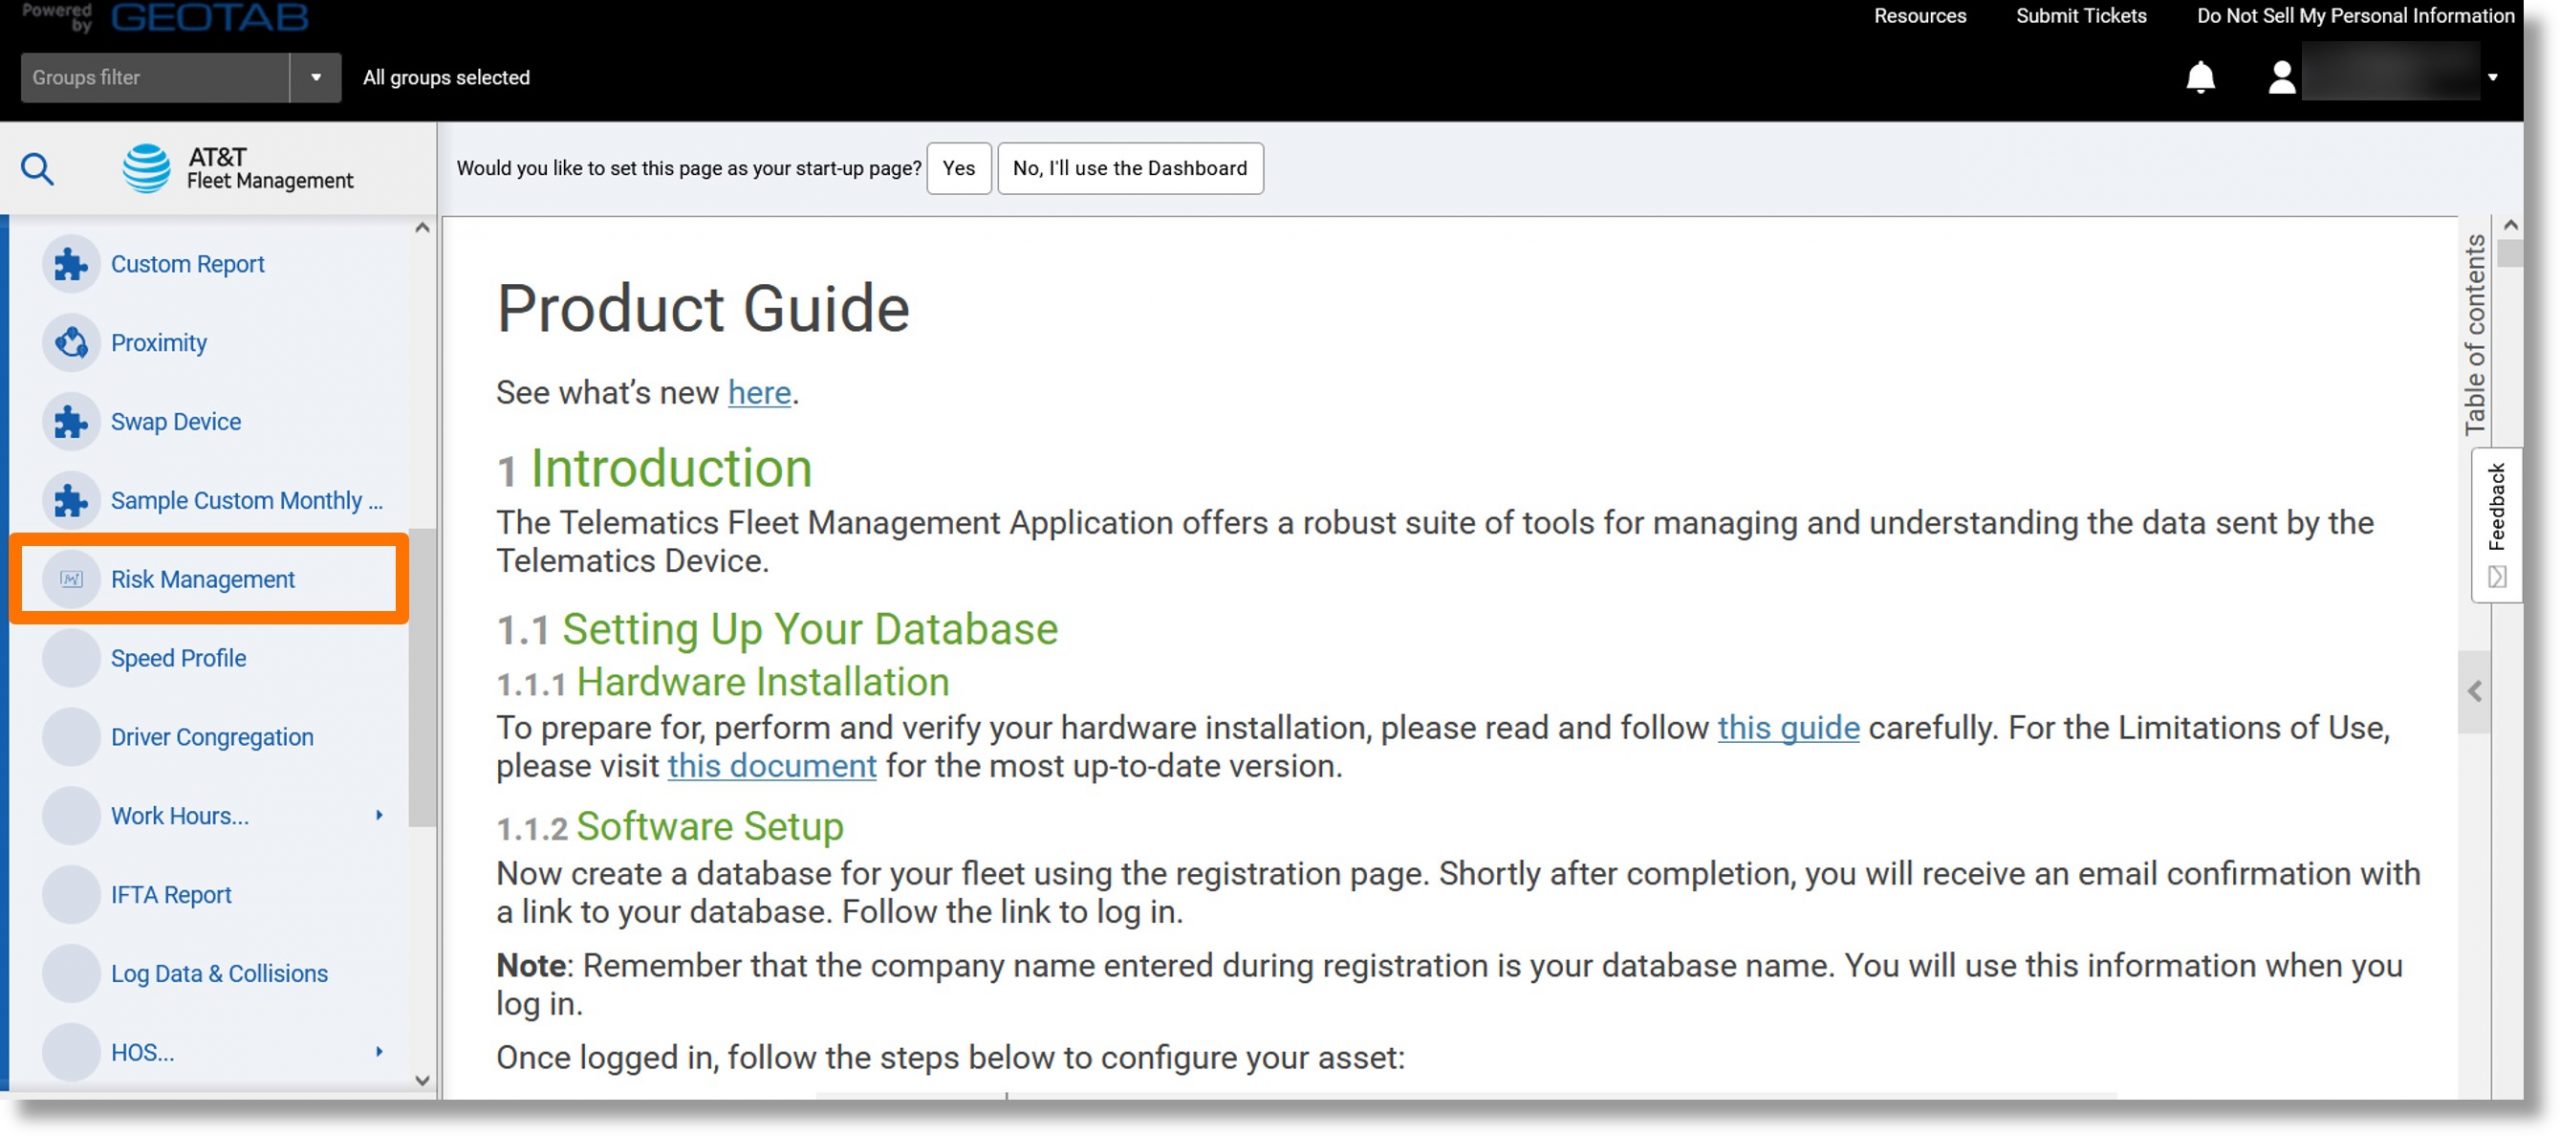
- Click on Activity in the menu on the left and scroll down.
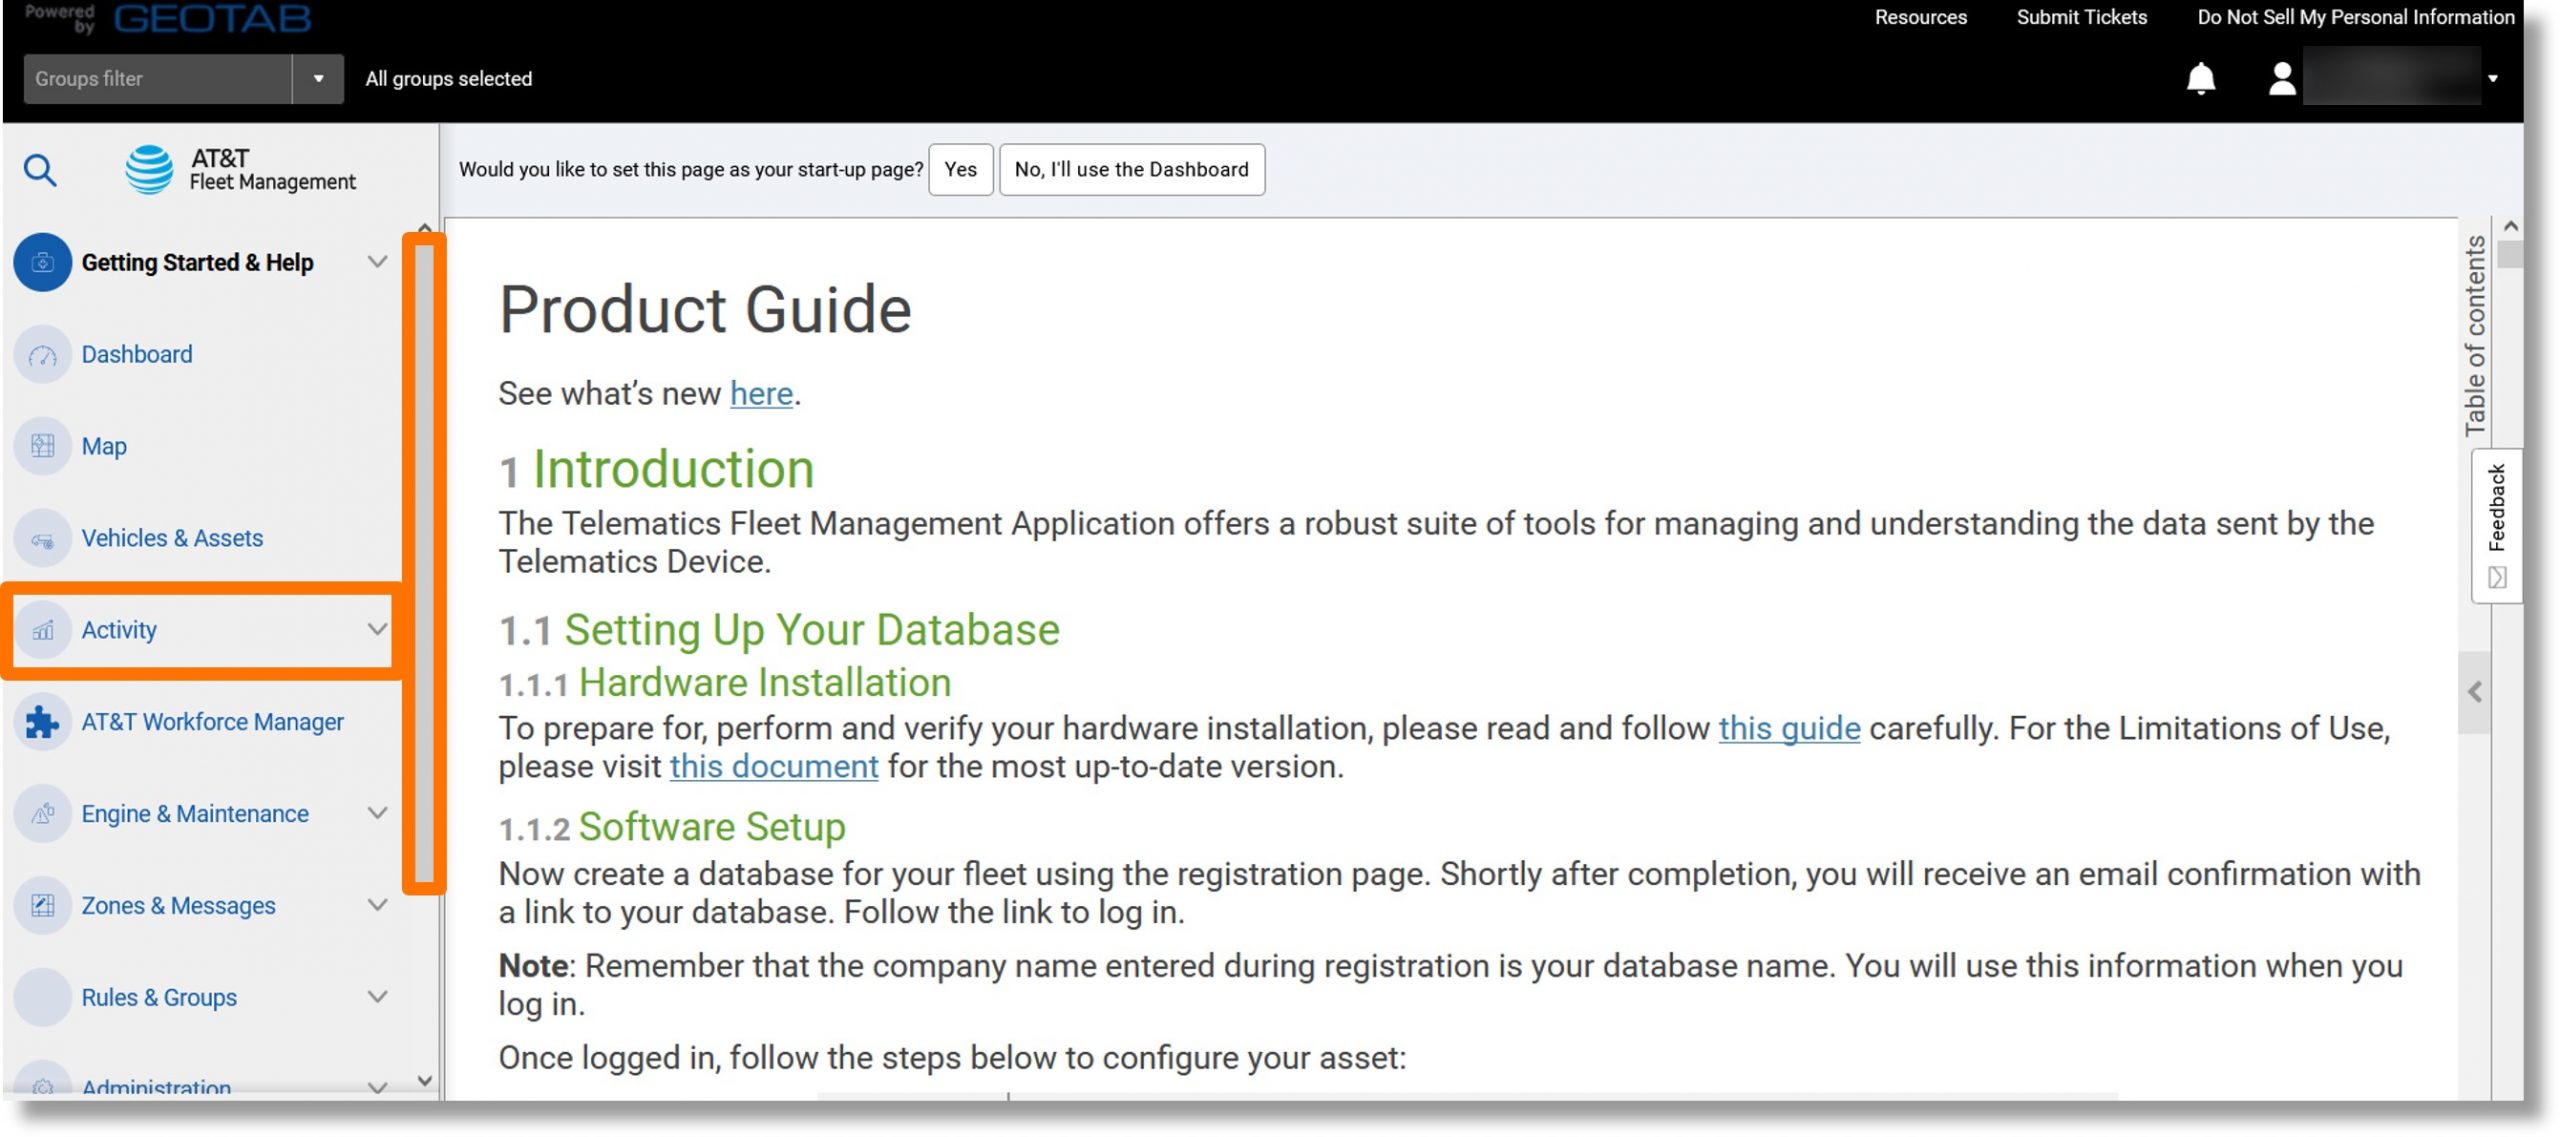
- Click on Risk Management.
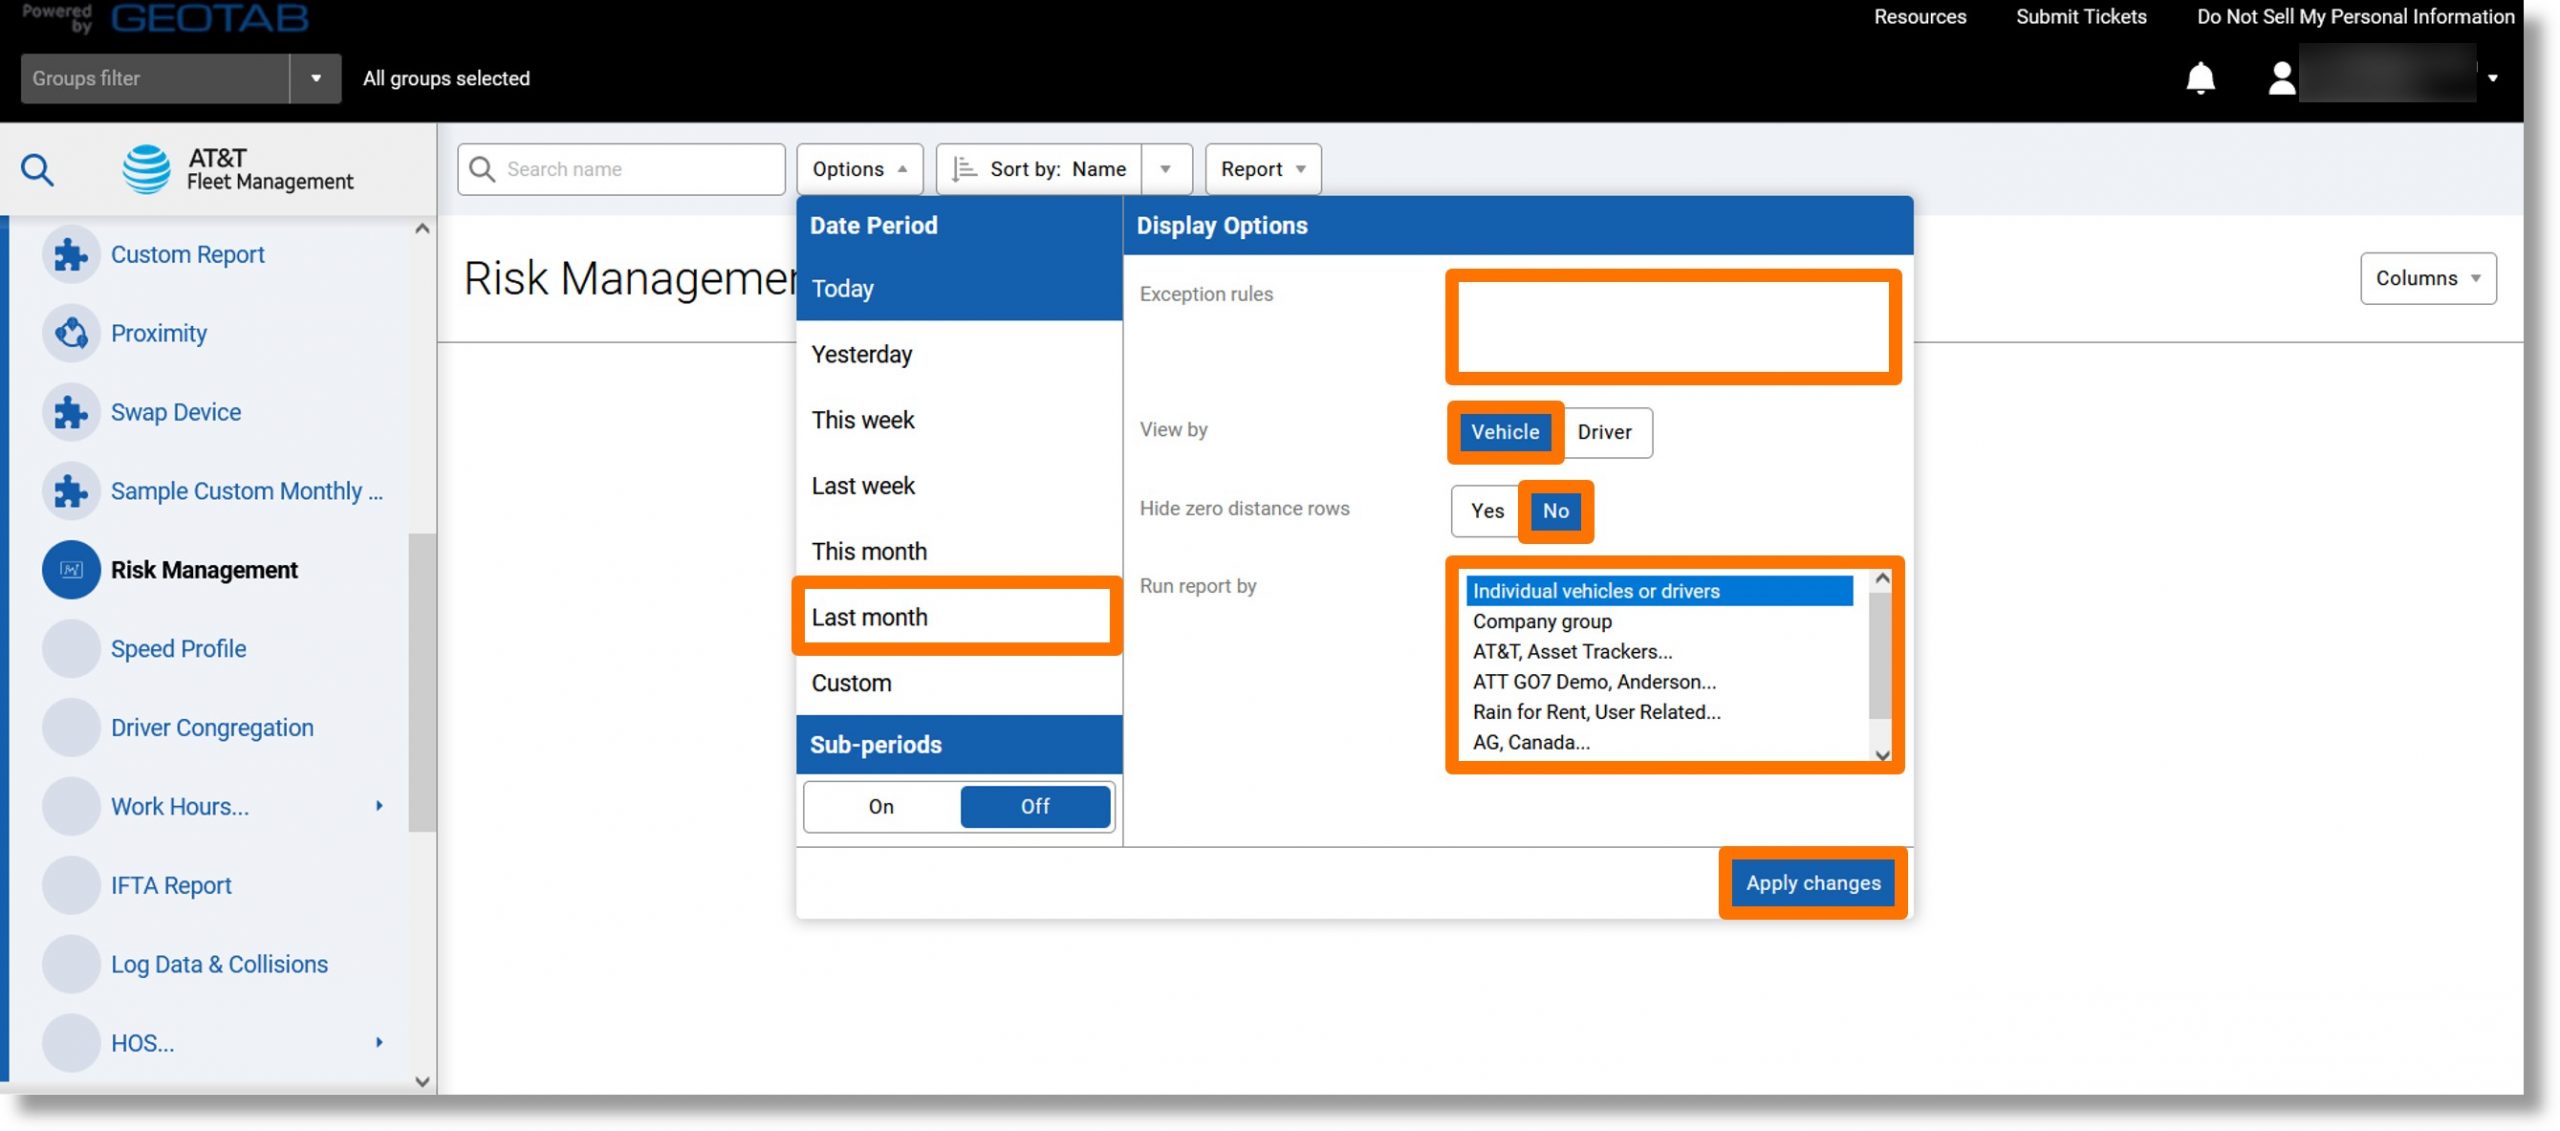
- Select the desired parameters and click the Apply changes button.
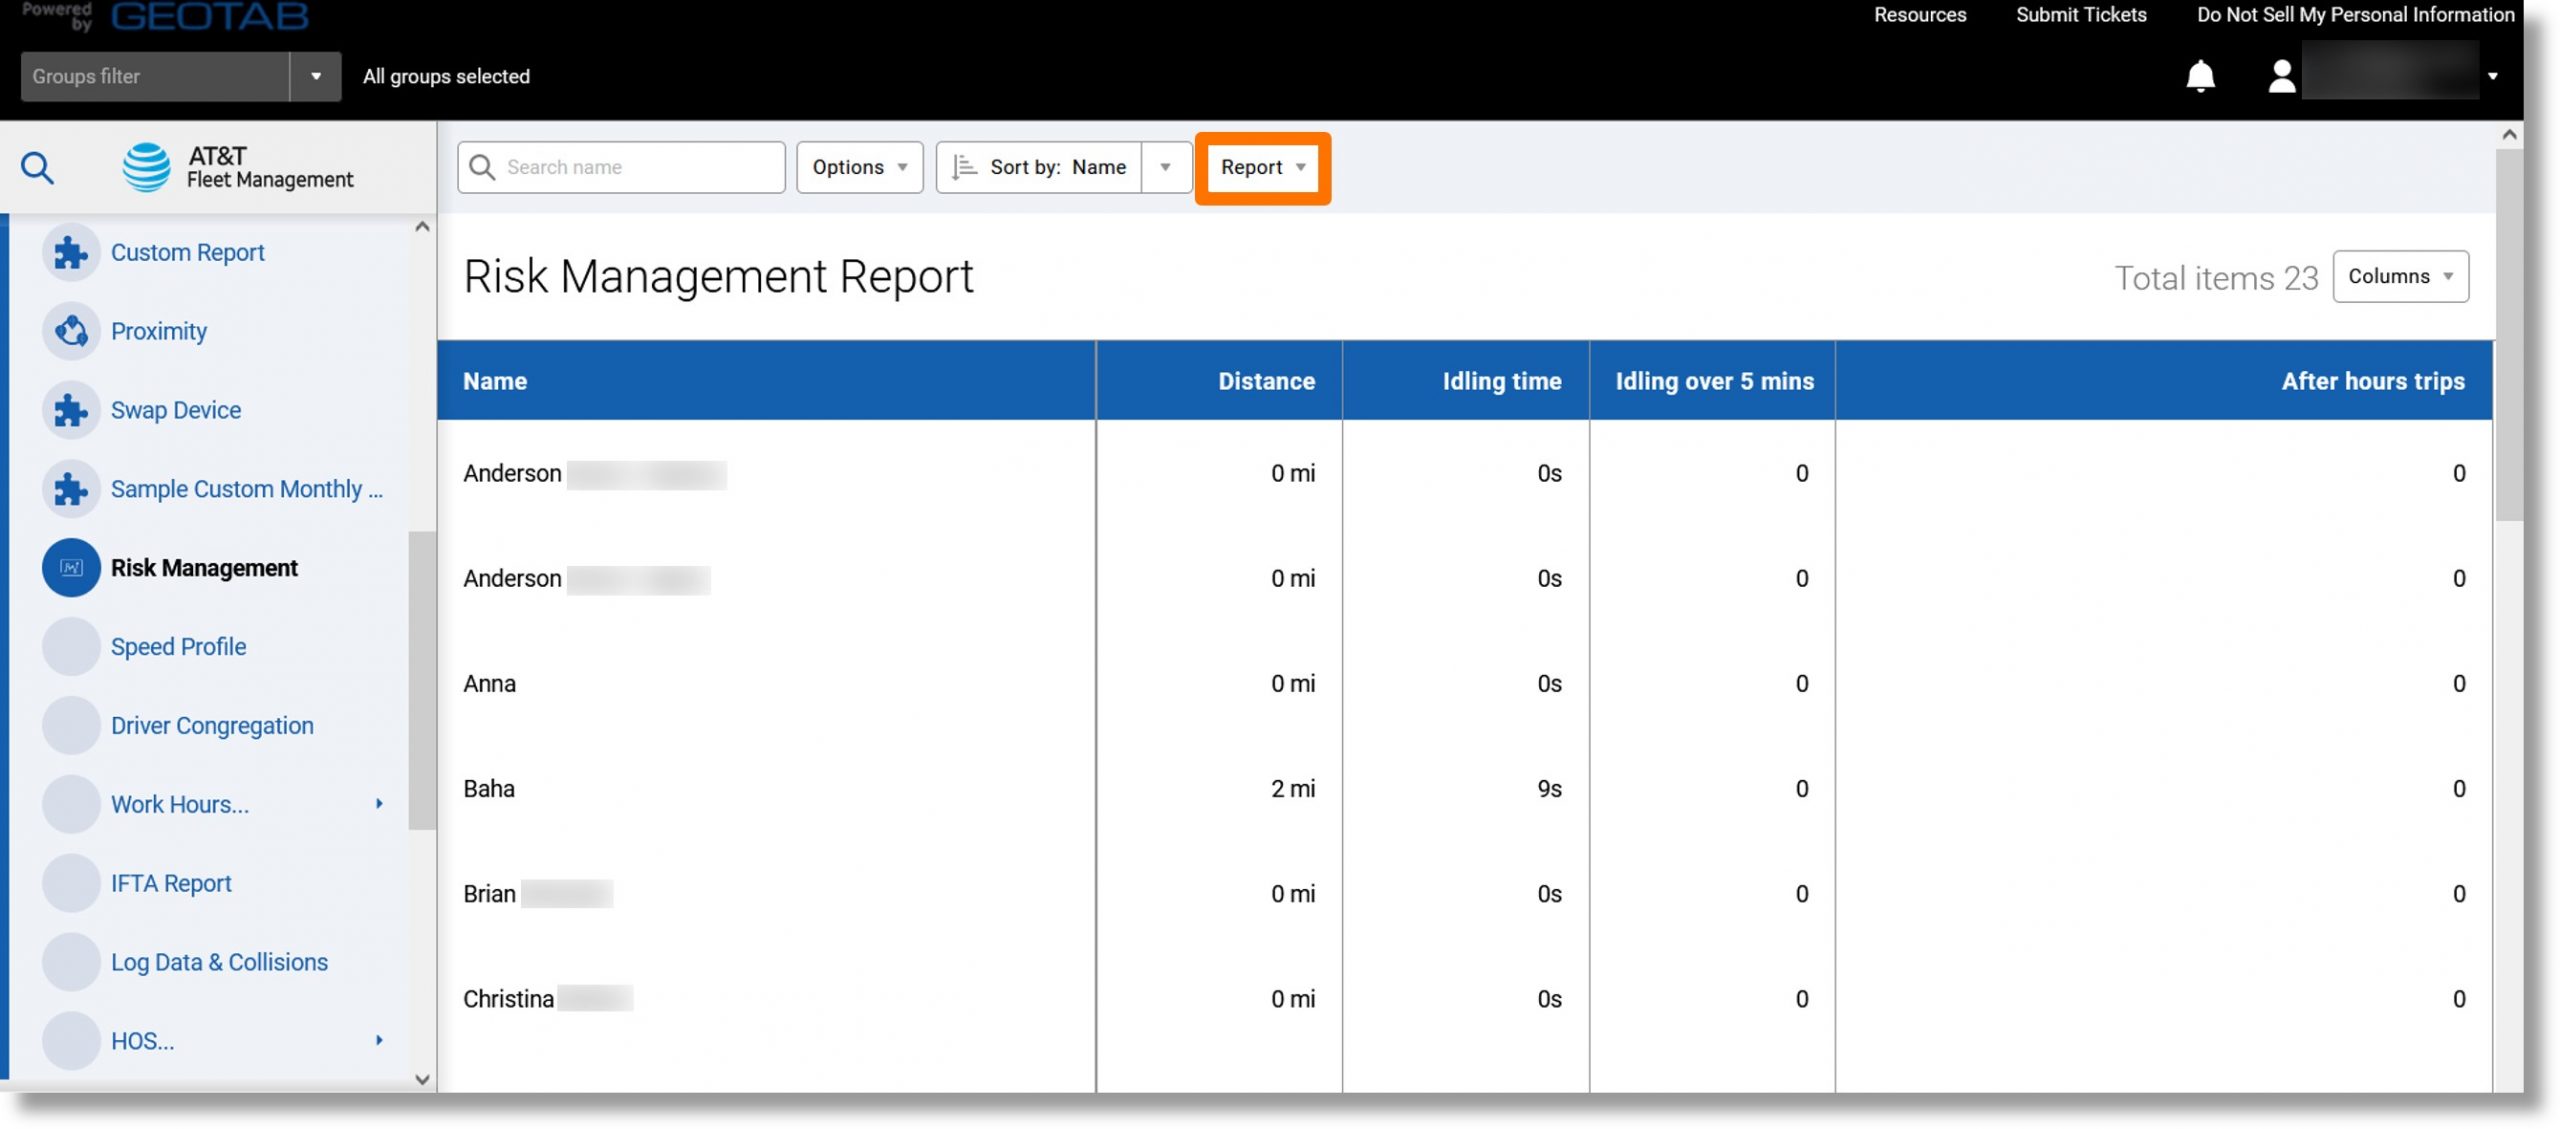
- Click on the Report dropdown.
- Click on the ellipsis icon
 to the right of either “Standard” or “Advanced”.
Note: The list may also include custom reports.
- Click on View in browser.
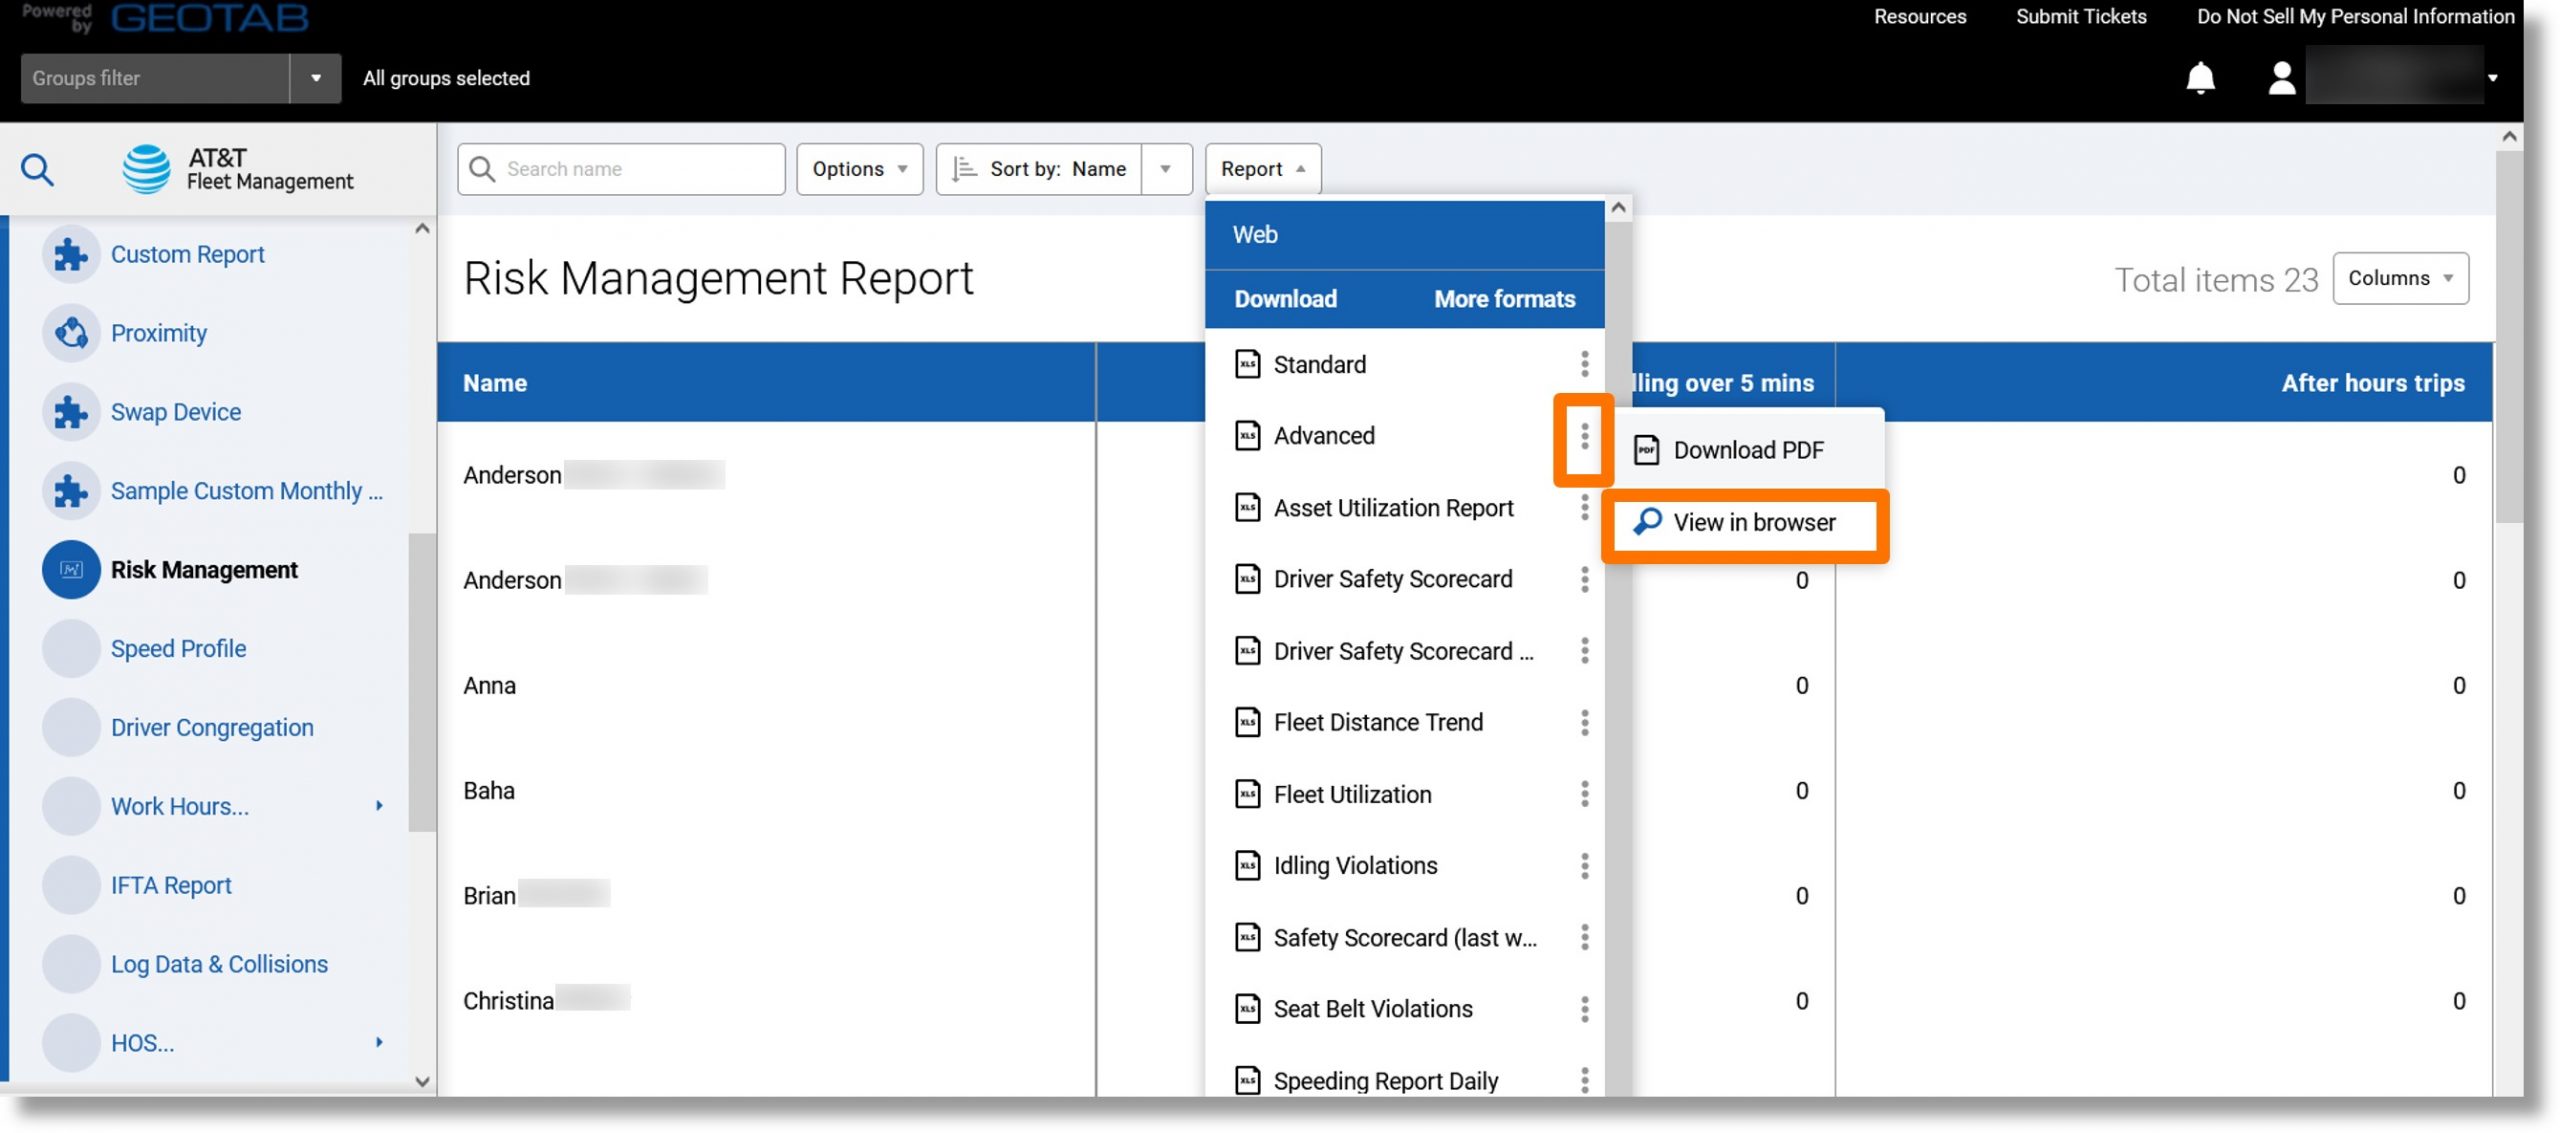
- The Risk Management Report Displays.
Top
Congregation Report
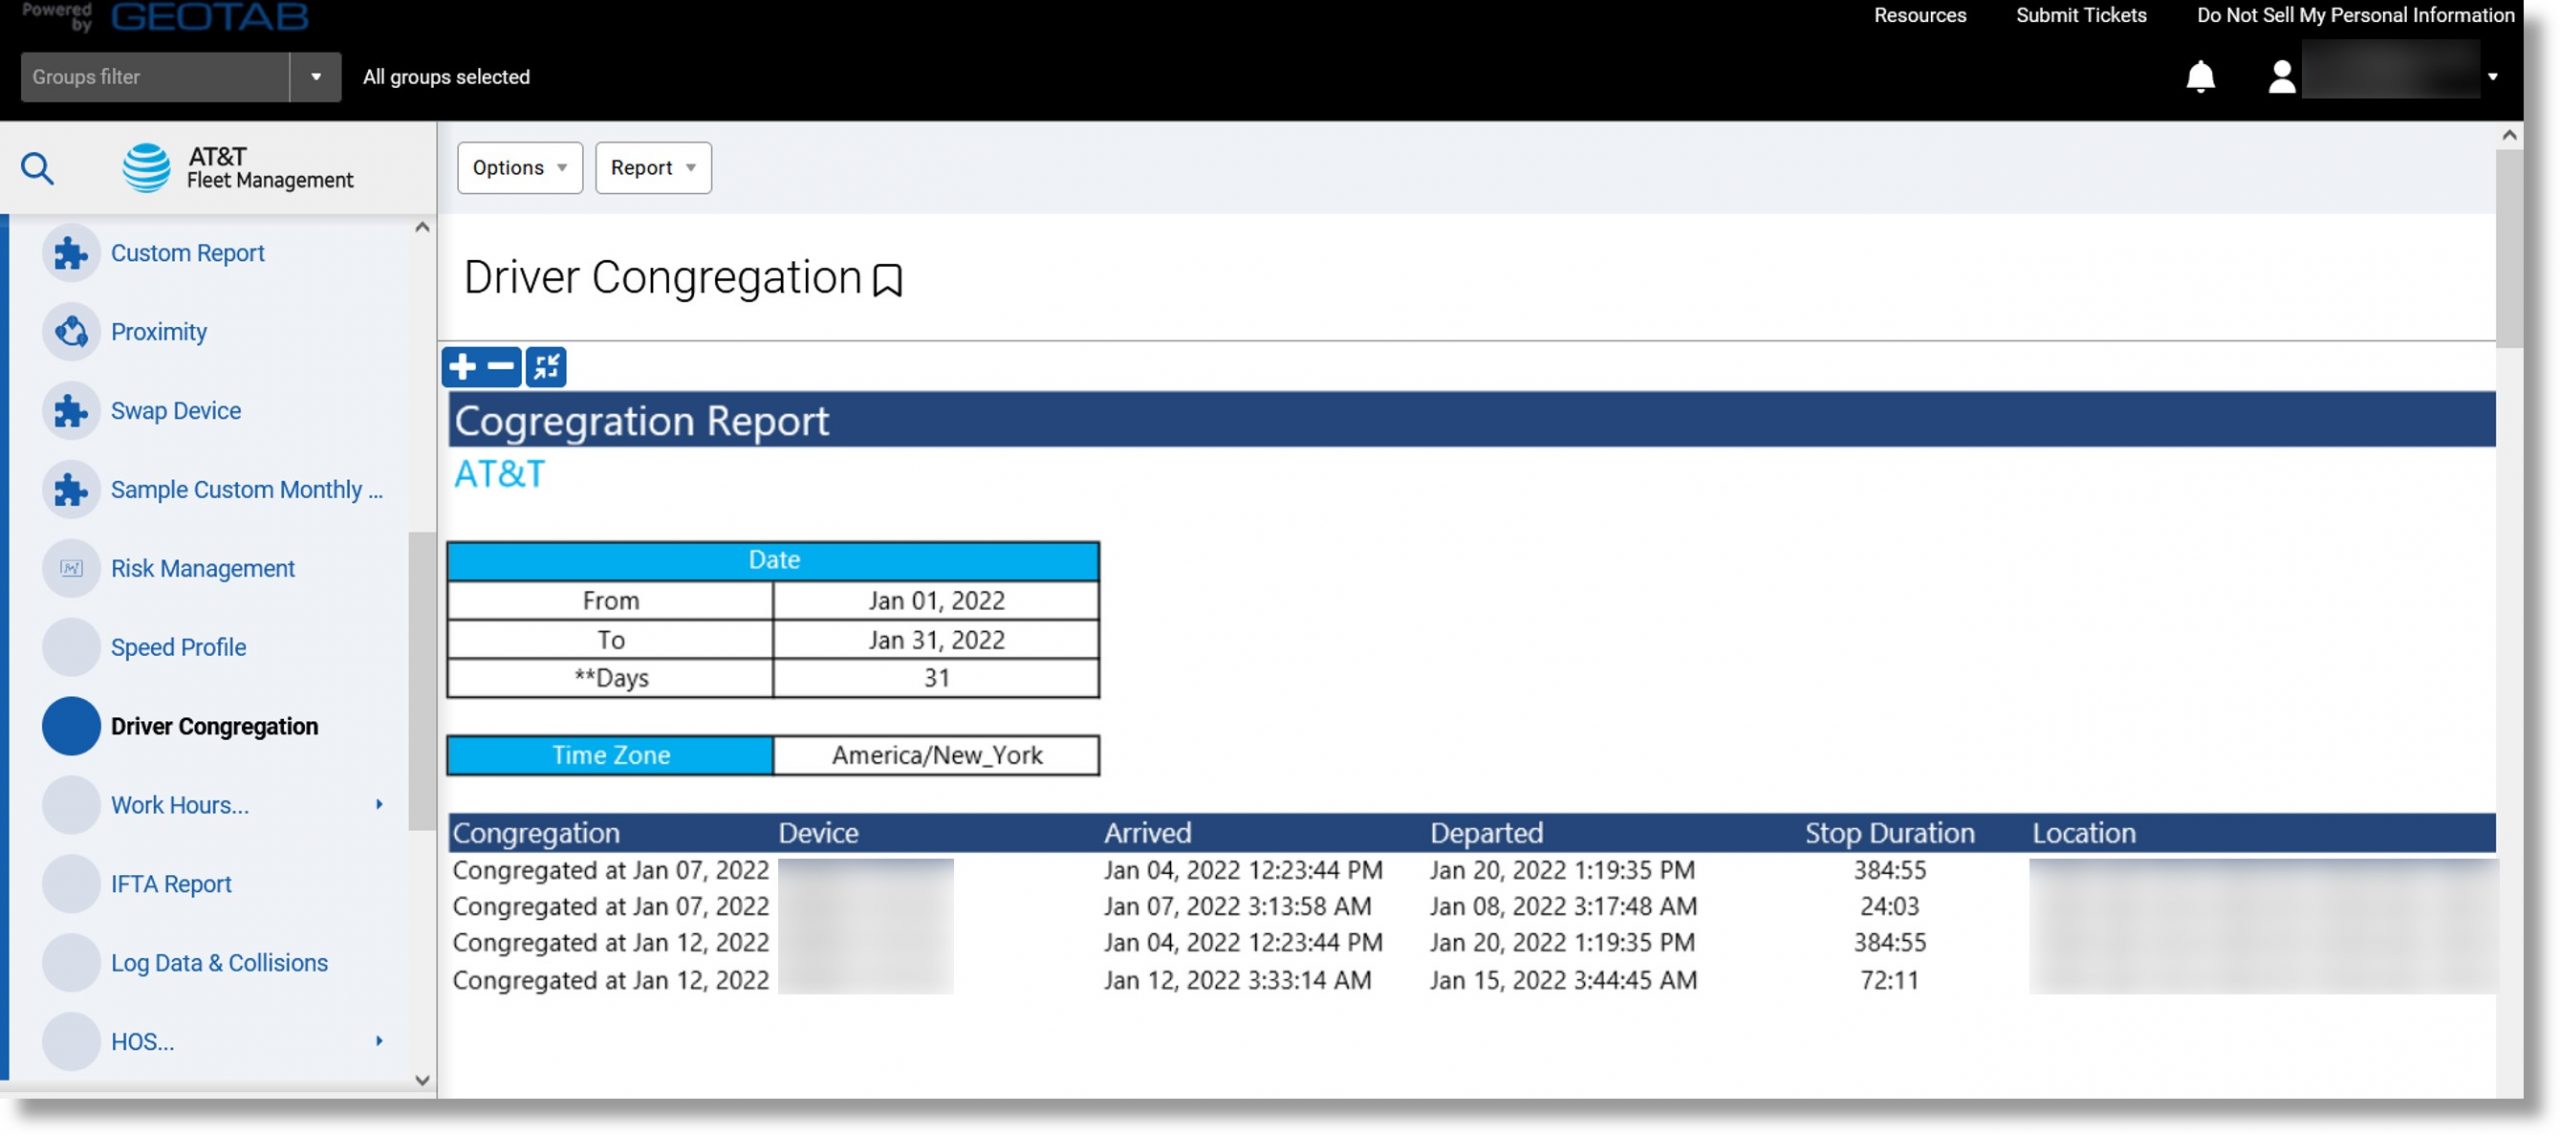
Use: Determine when more than one vehicle/drivers are close to each other. This report can be used to monitor the productivity of your fleet and ensure there is no unnecessary congregating of vehicles/drivers.
Information included: Vehicle, driver, stop location, date, duration, arrival and departure times
Additional Information when exported: Device group, location zone type, etc.
Accessing the report:
- Click on Activity to the left and then scroll down.
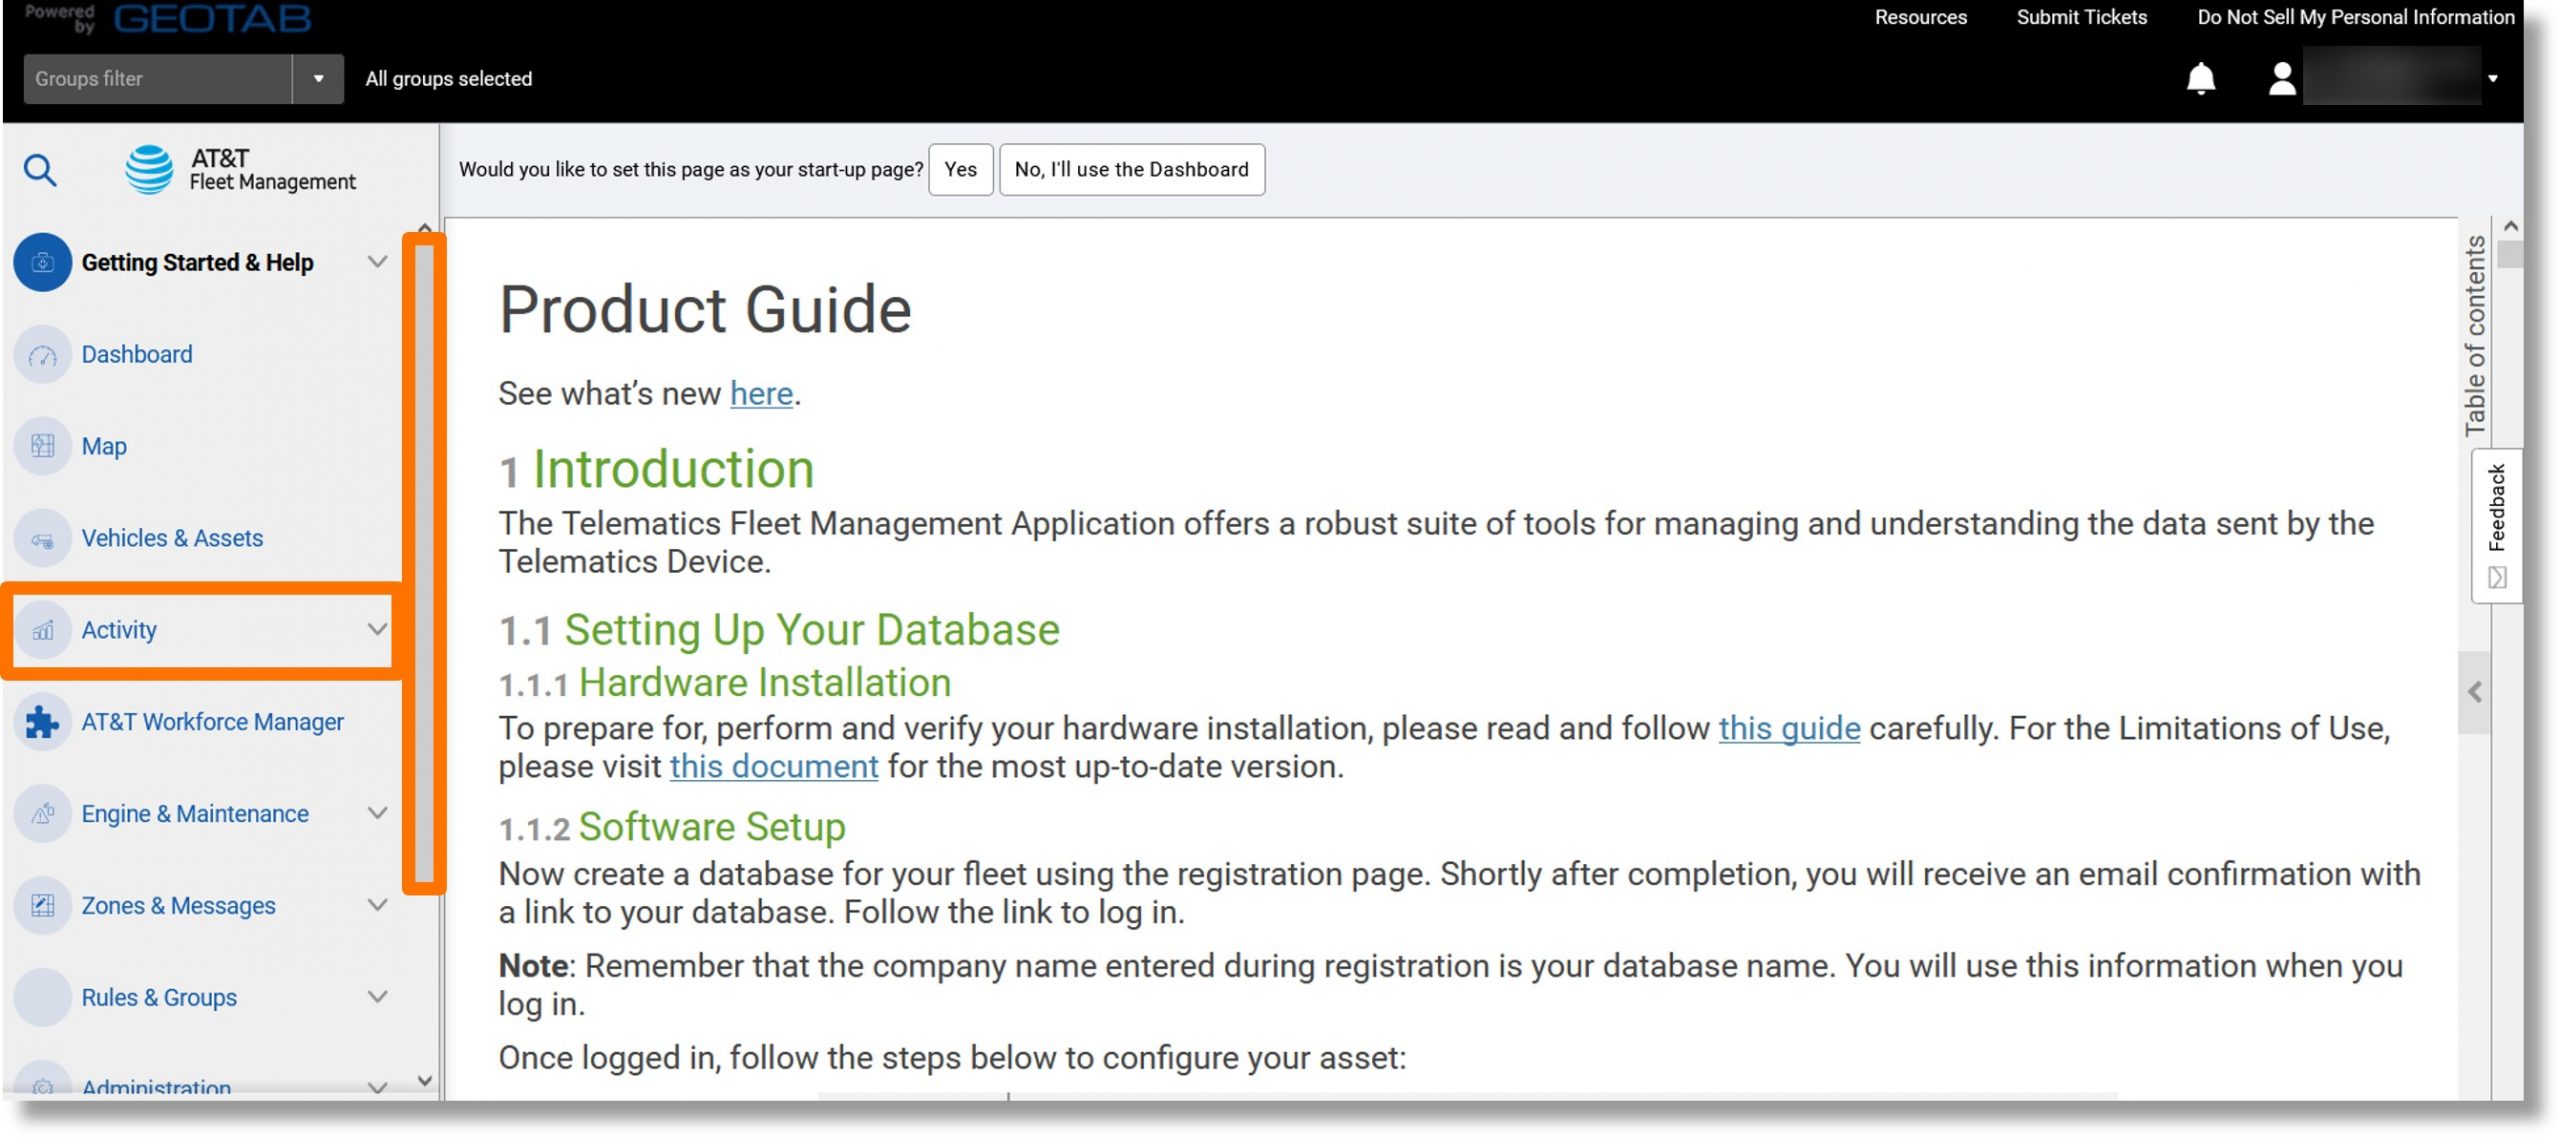
- Click on Driver Congregation.
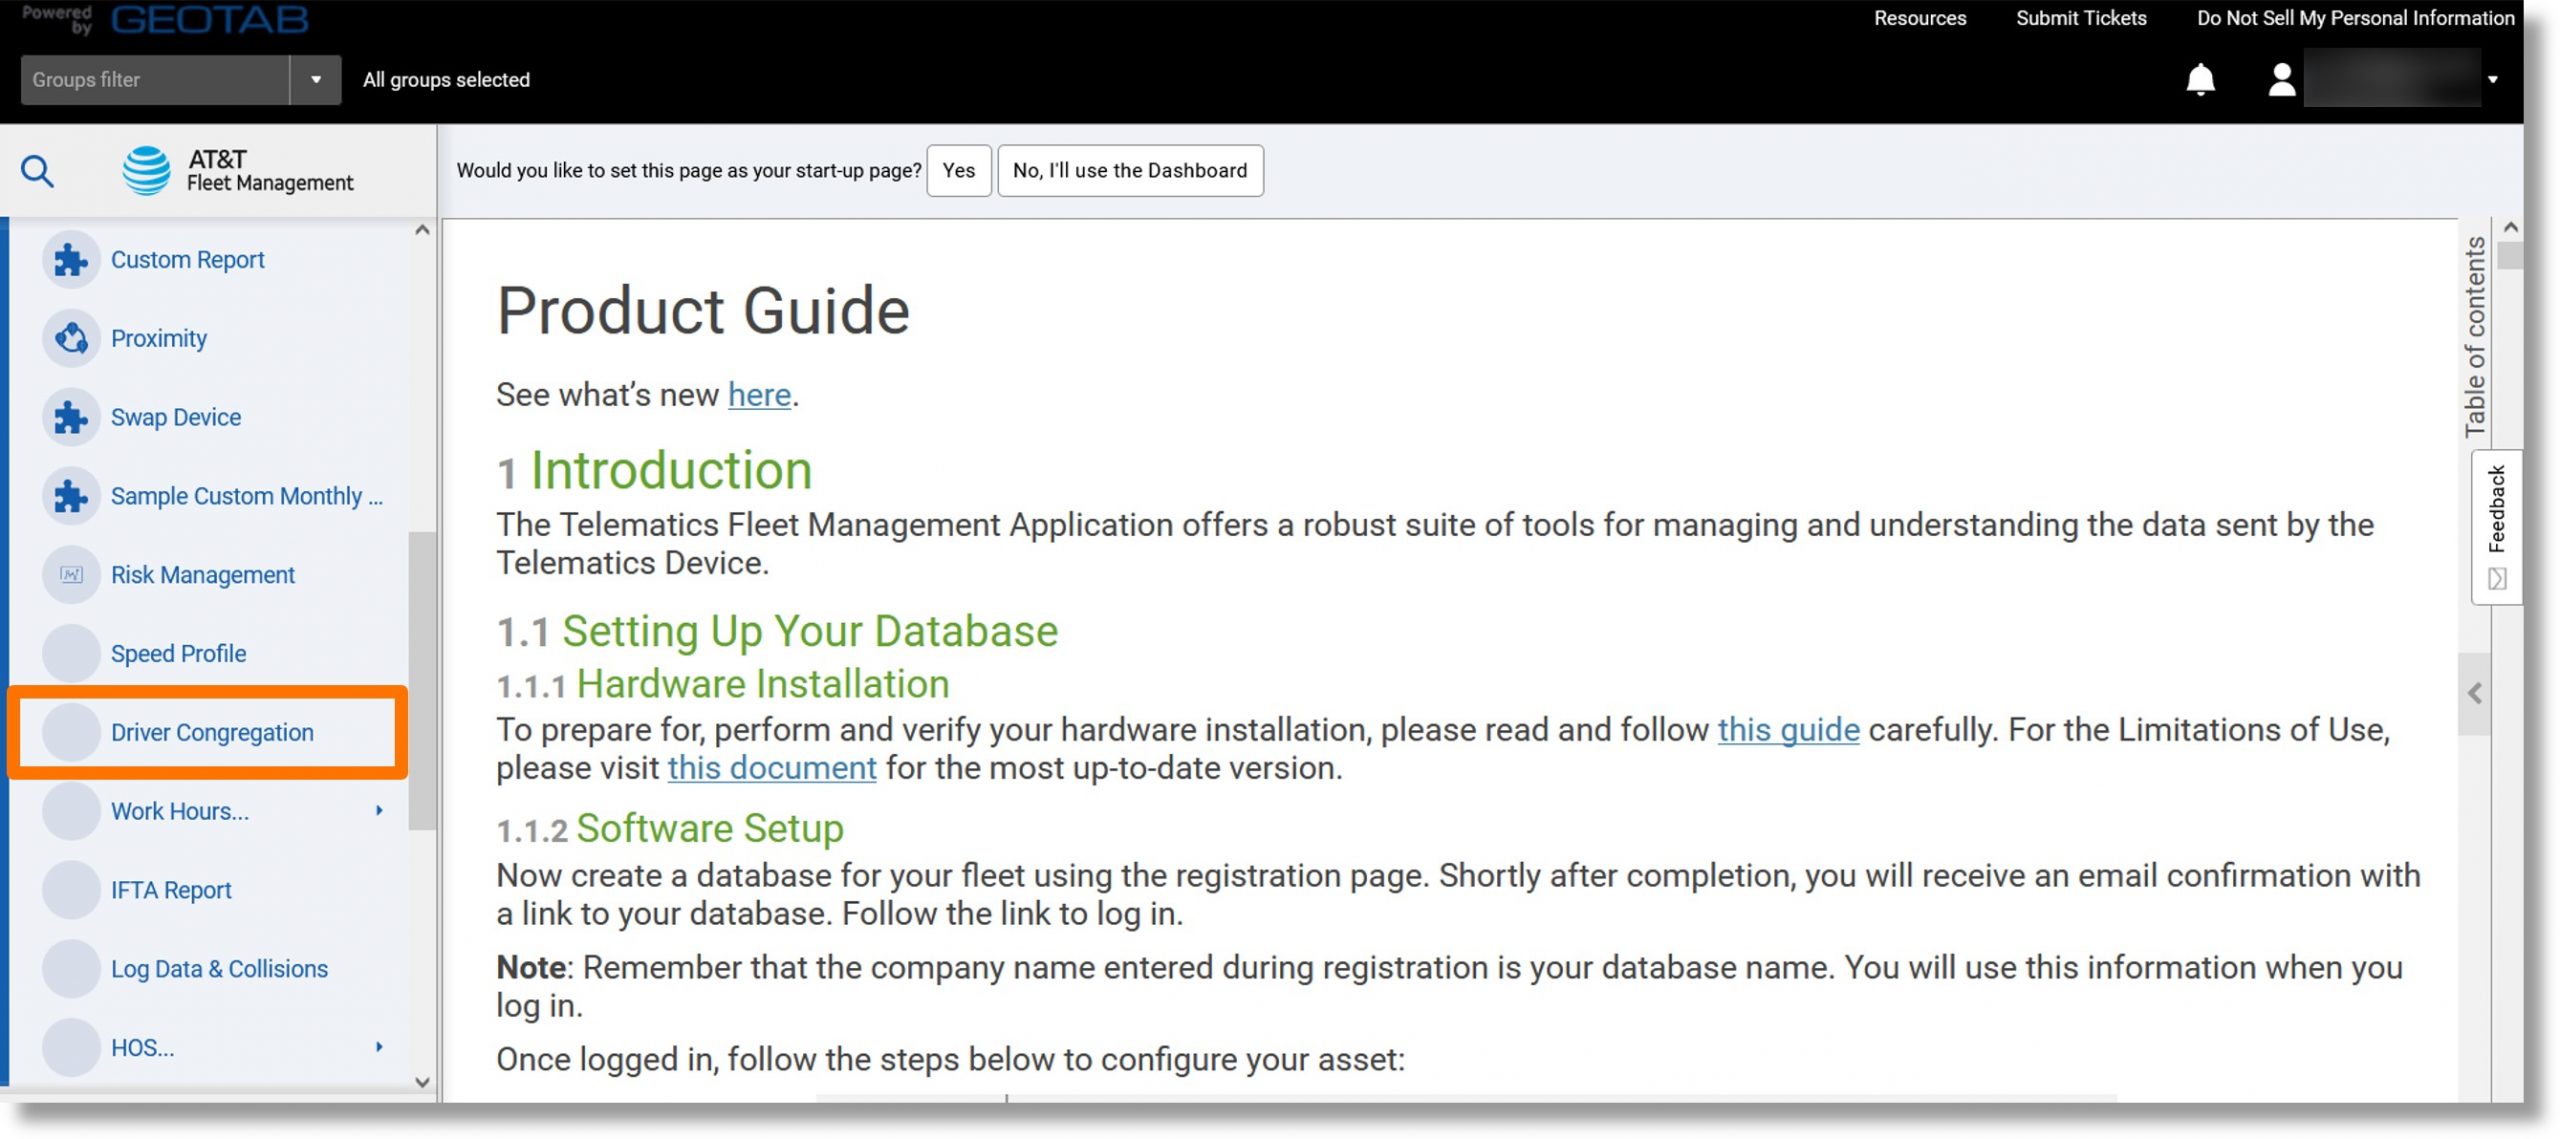
- The “Options” menu populates.
- Click on the desired timeframe under “Date Period”.
- Click on Vehicle or Driver to the right of “View by”.
- Click on Yes or No to the right of “Include archived (historical) data”.
- Click on the dropdown to the right of “Vehicles” to specify a vehicle.
- Use the field to the right of “Distance from one to another”, “Minimum overlap time”, “Maximum number of congregating vehicles”, and “Exclude stops in zone types” to set the desired settings.
- Select the desired parameters and click the Apply changes button.
- The Congregation overview displays.
- Click on the Reports dropdown.
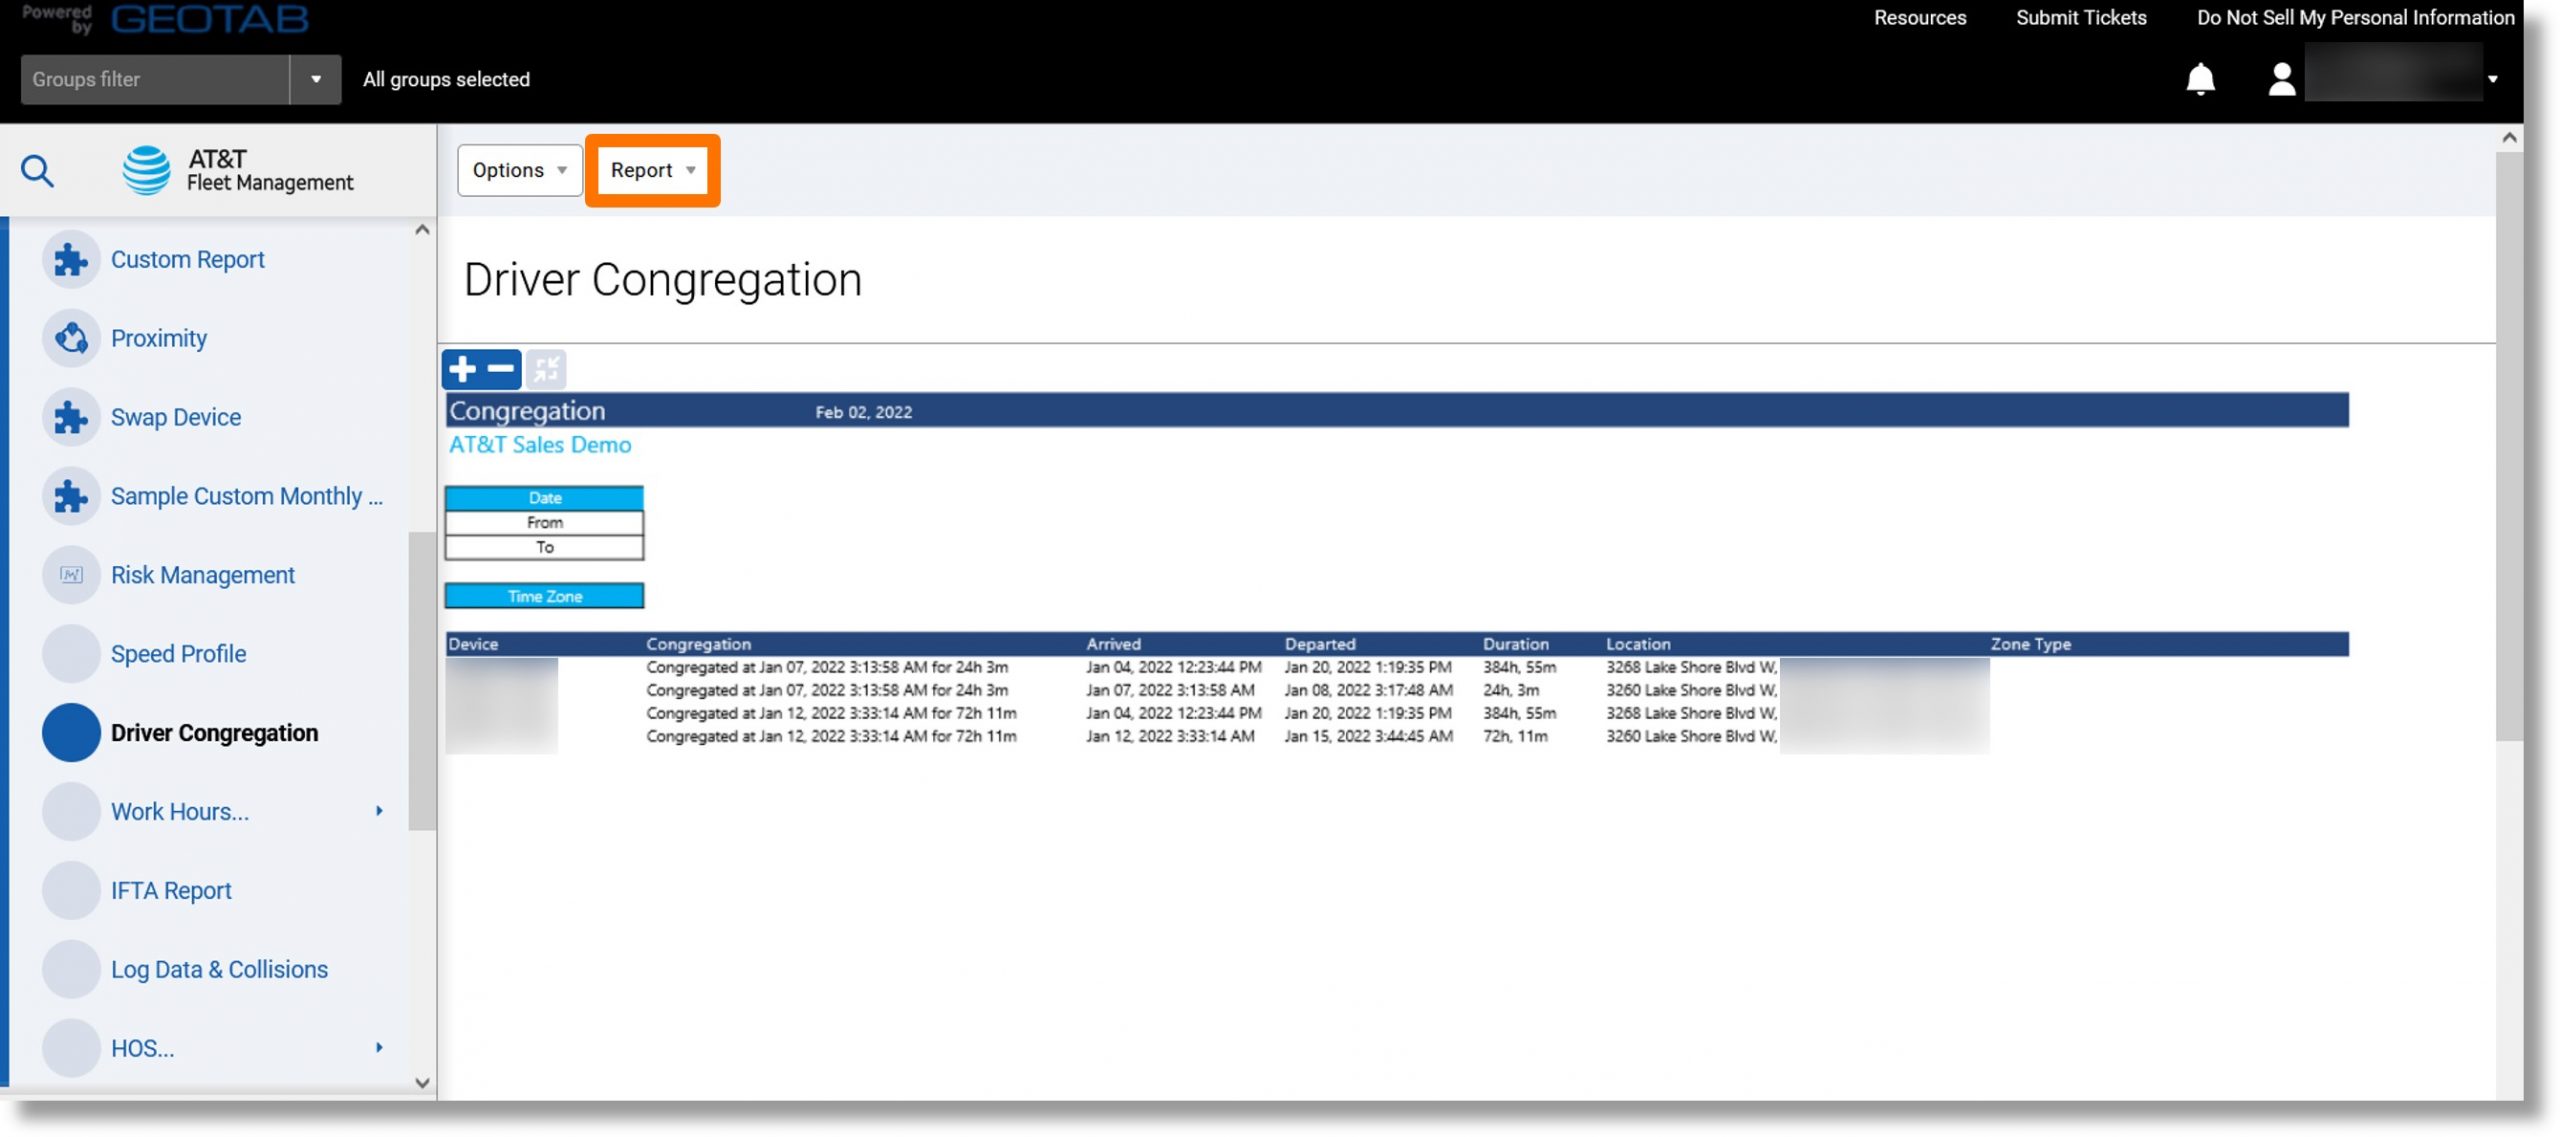
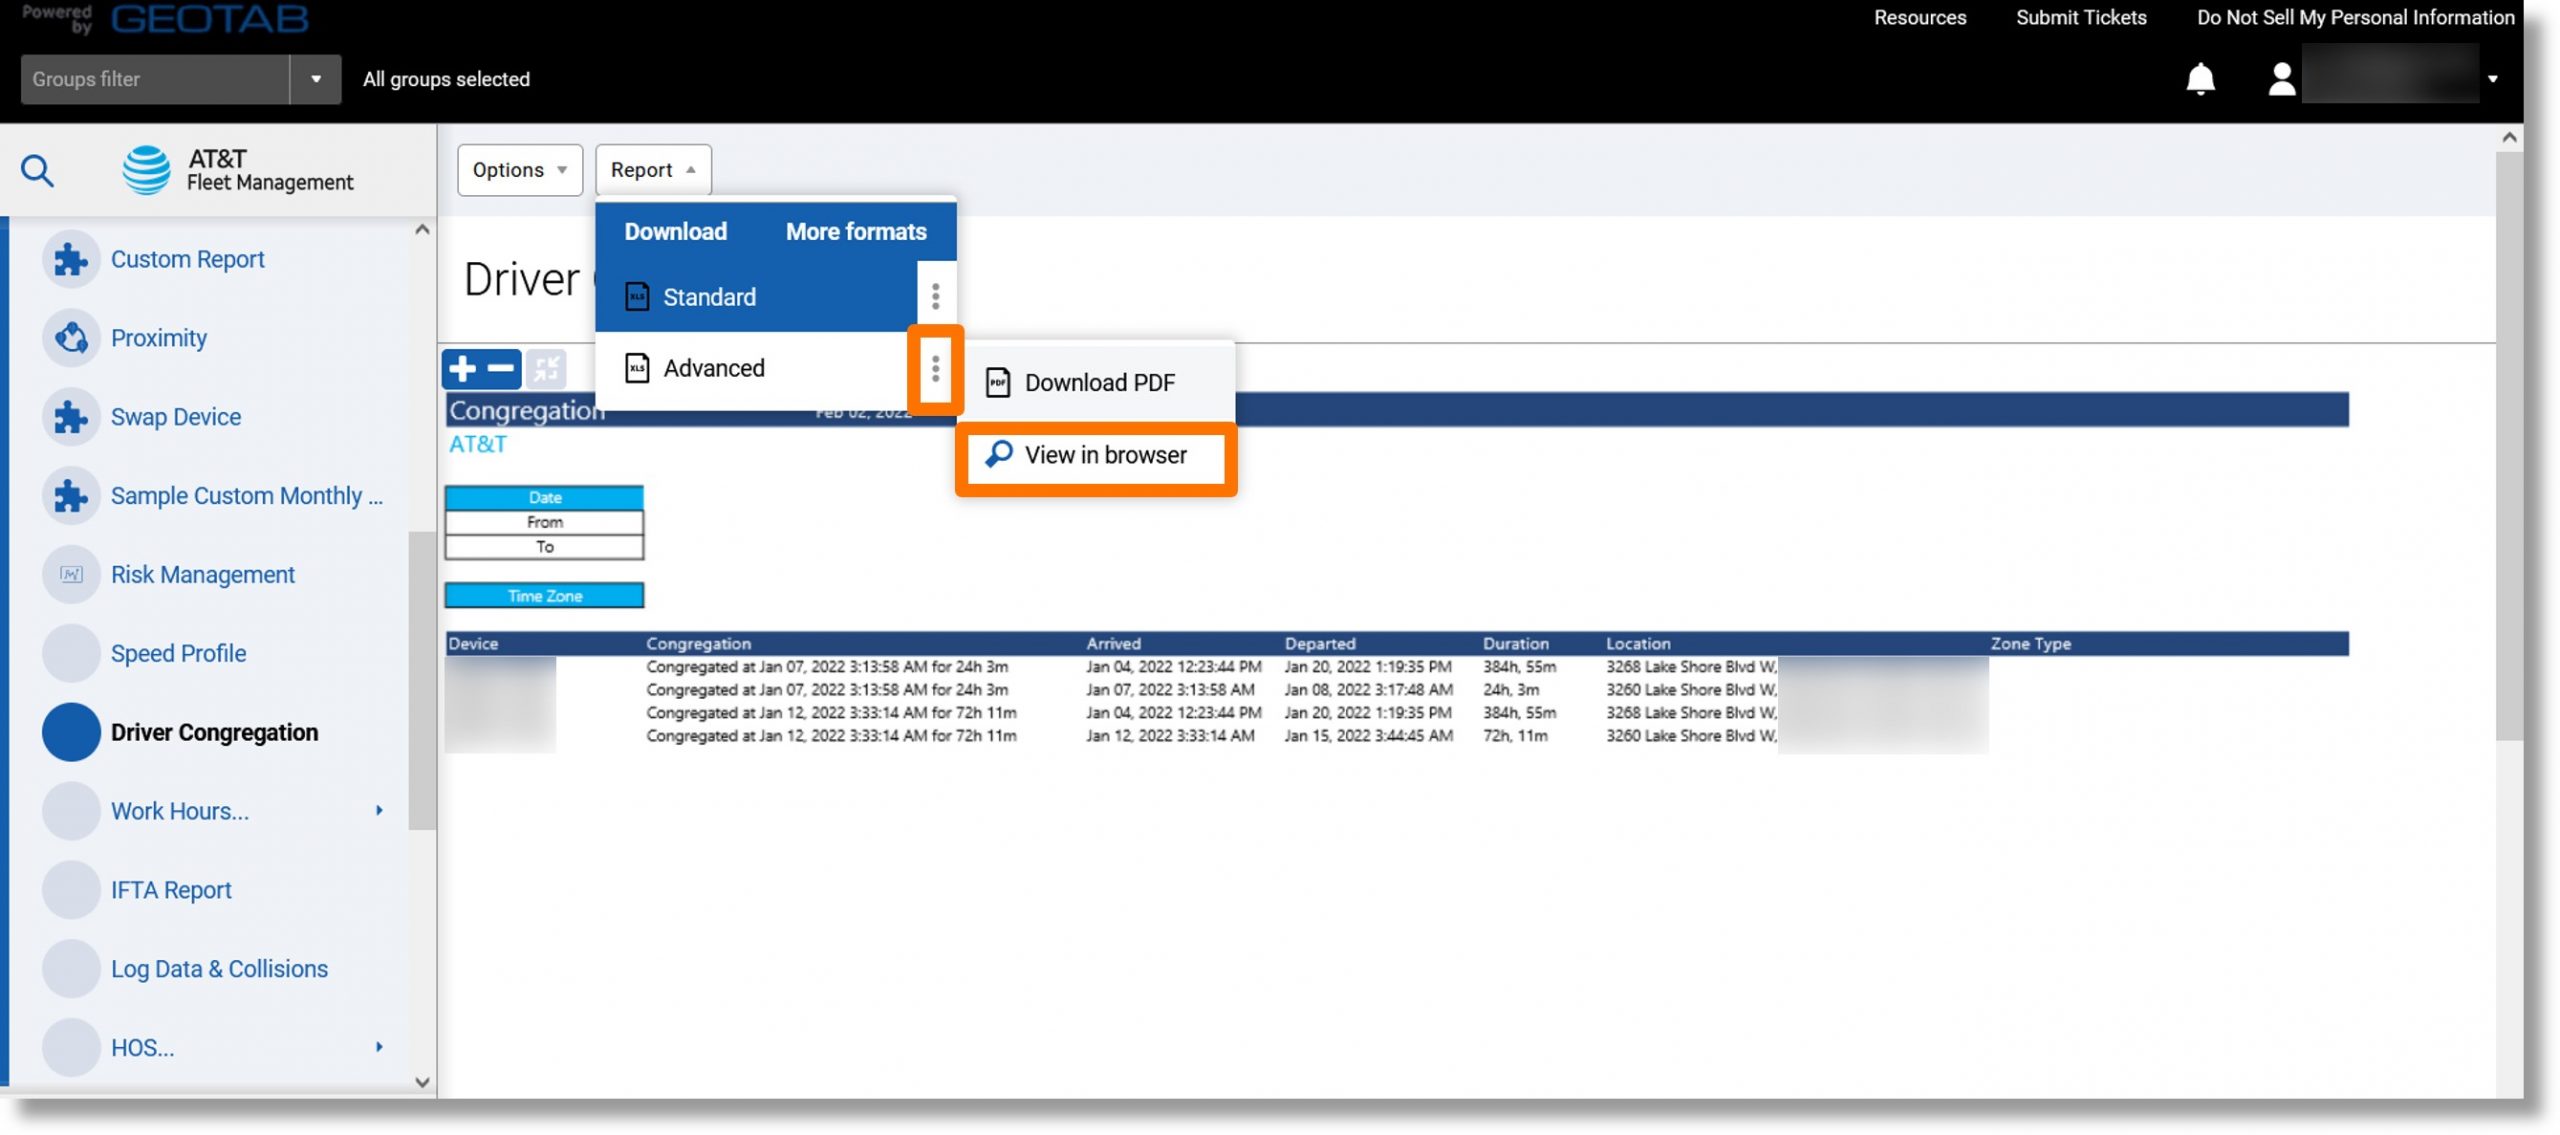
- Click on the ellipsis icon
 to the right of either “Standard” or “Advanced” and then click on View in browser.
- The report displays.
Top
Time Card Report
Use: Record accurate work hours of a vehicle making it easier to ensure productivity is being properly recorded. Identification of vehicle utilization and assisting in vehicle assignments.
Information included: The first and last ignition of the day, driving time, idling duration, the location of the last ignition, and zone type duration
Additional Information when exported: Latitude and longitude, maximum speed, location zone type, etc.
Accessing the report:
- Click on Activity in the column on the left and scroll down.
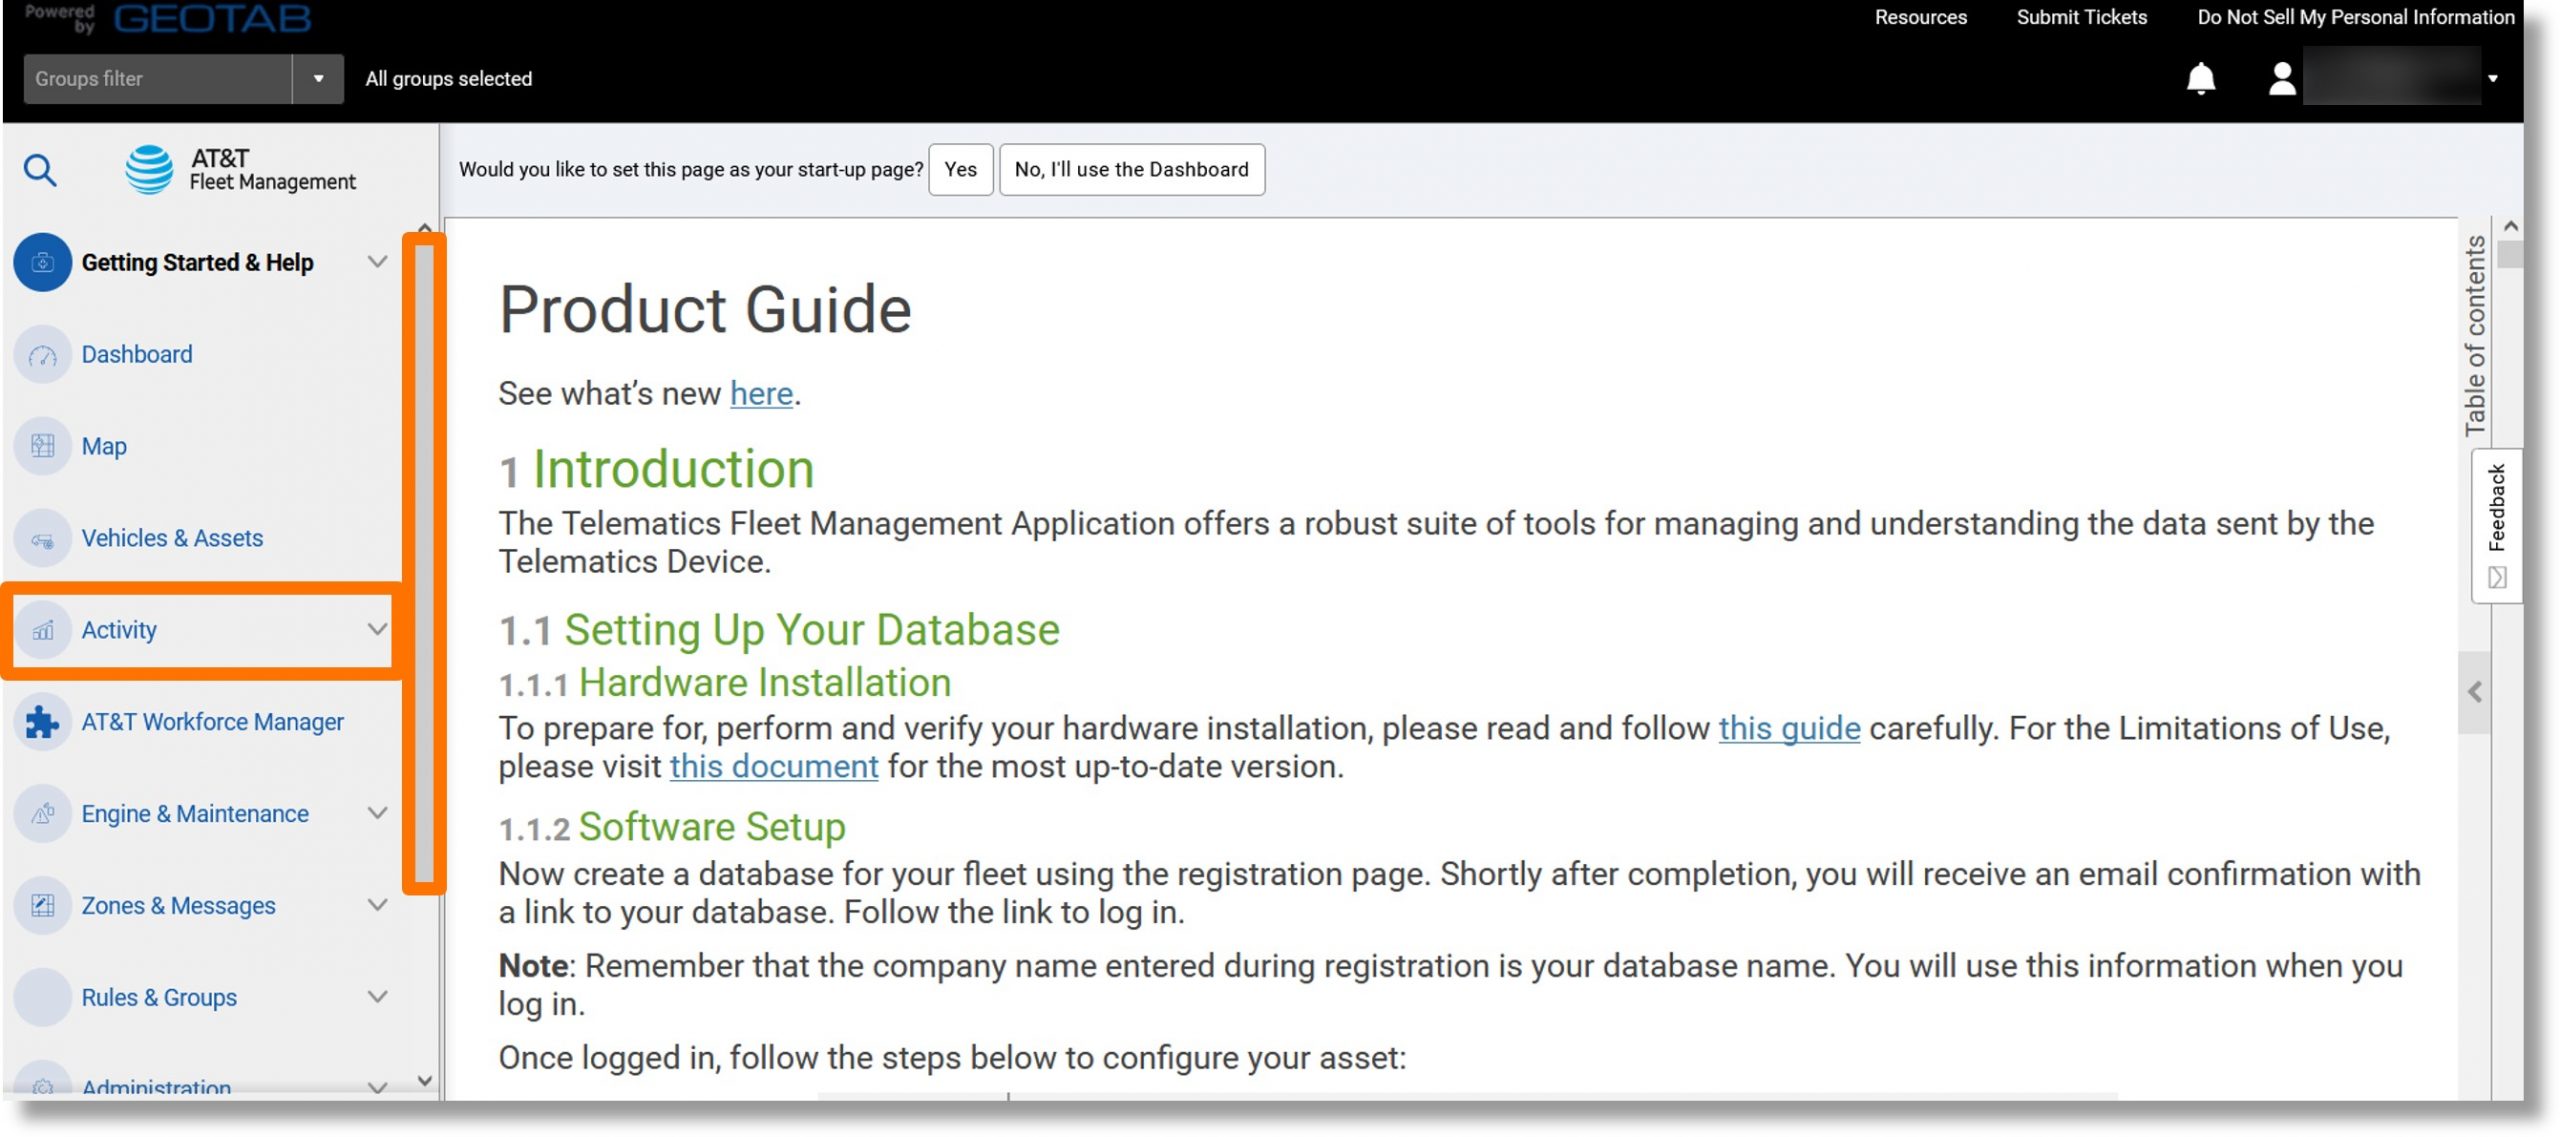
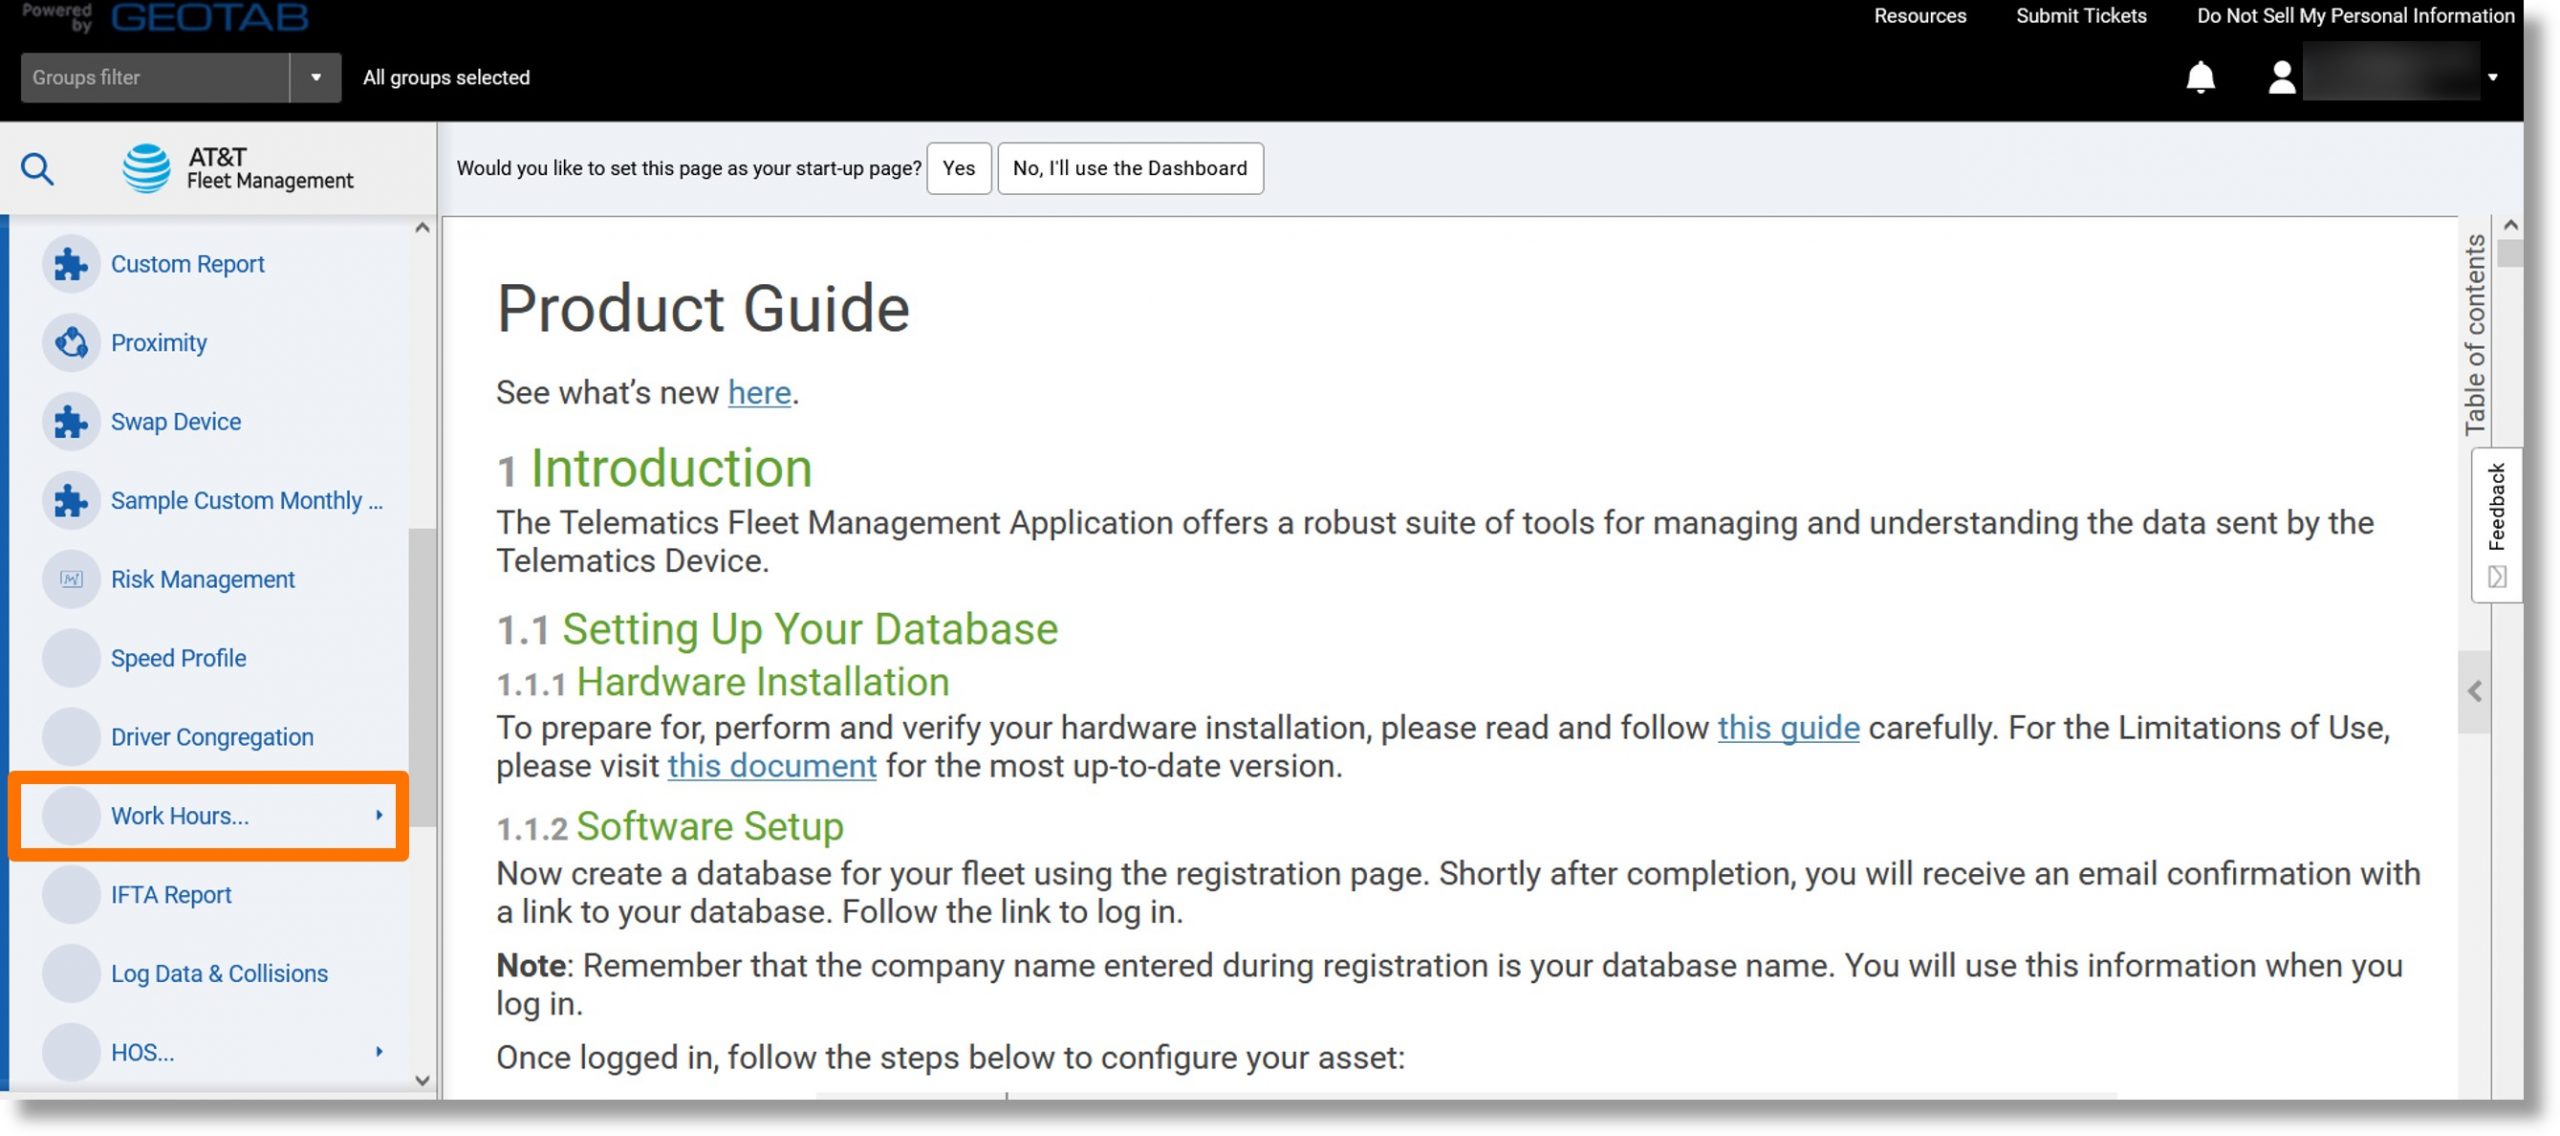
- Click on Work Hours….
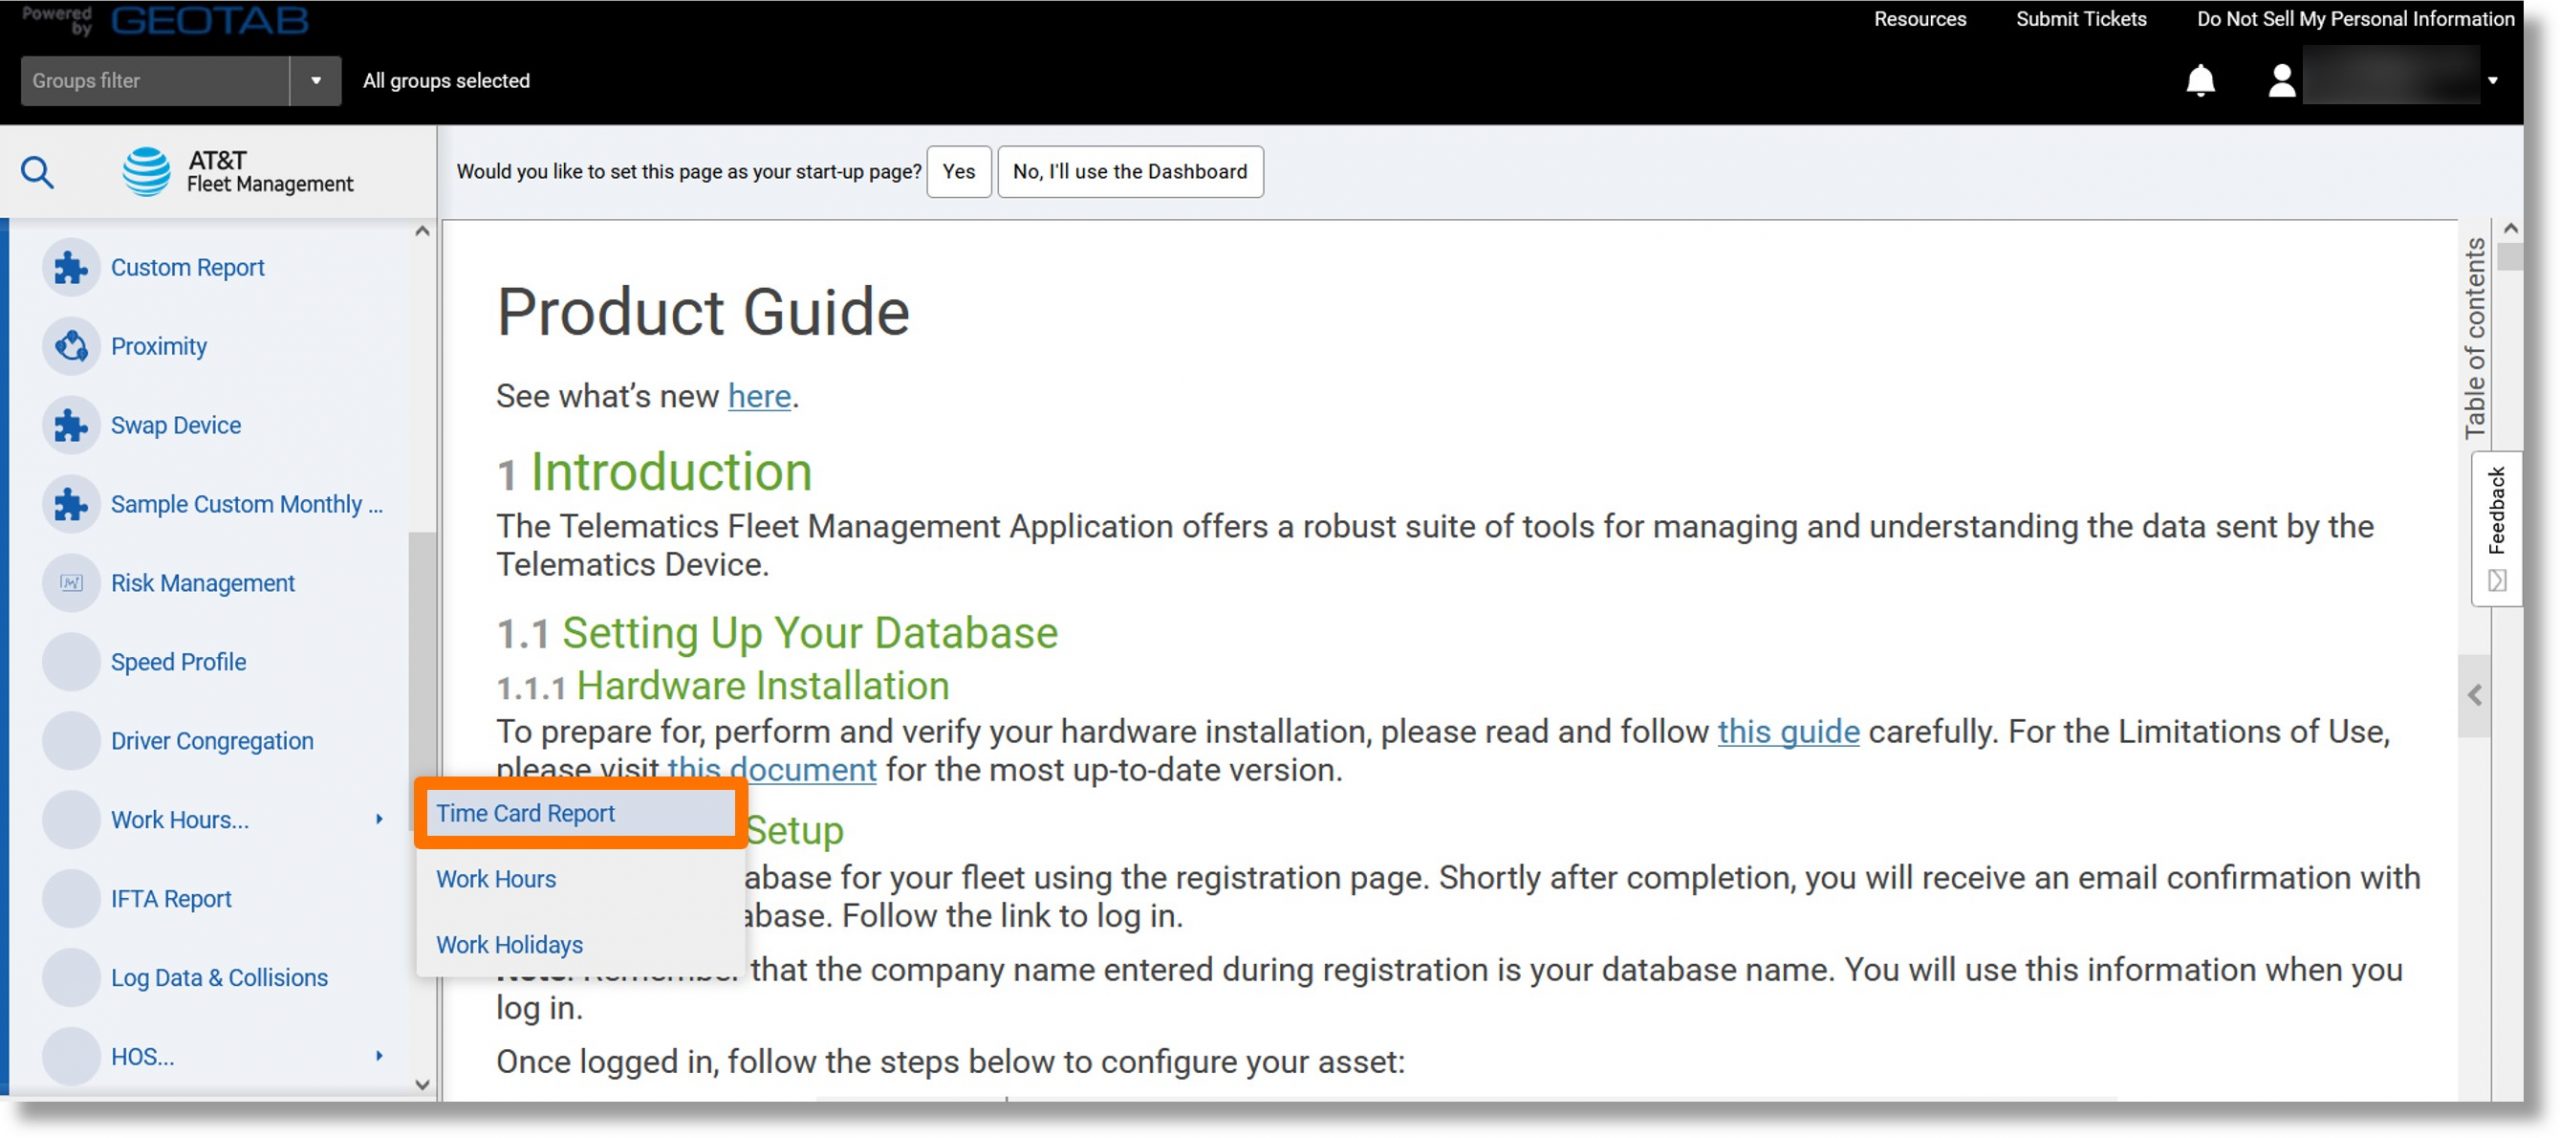
- Click on Time Card Report.
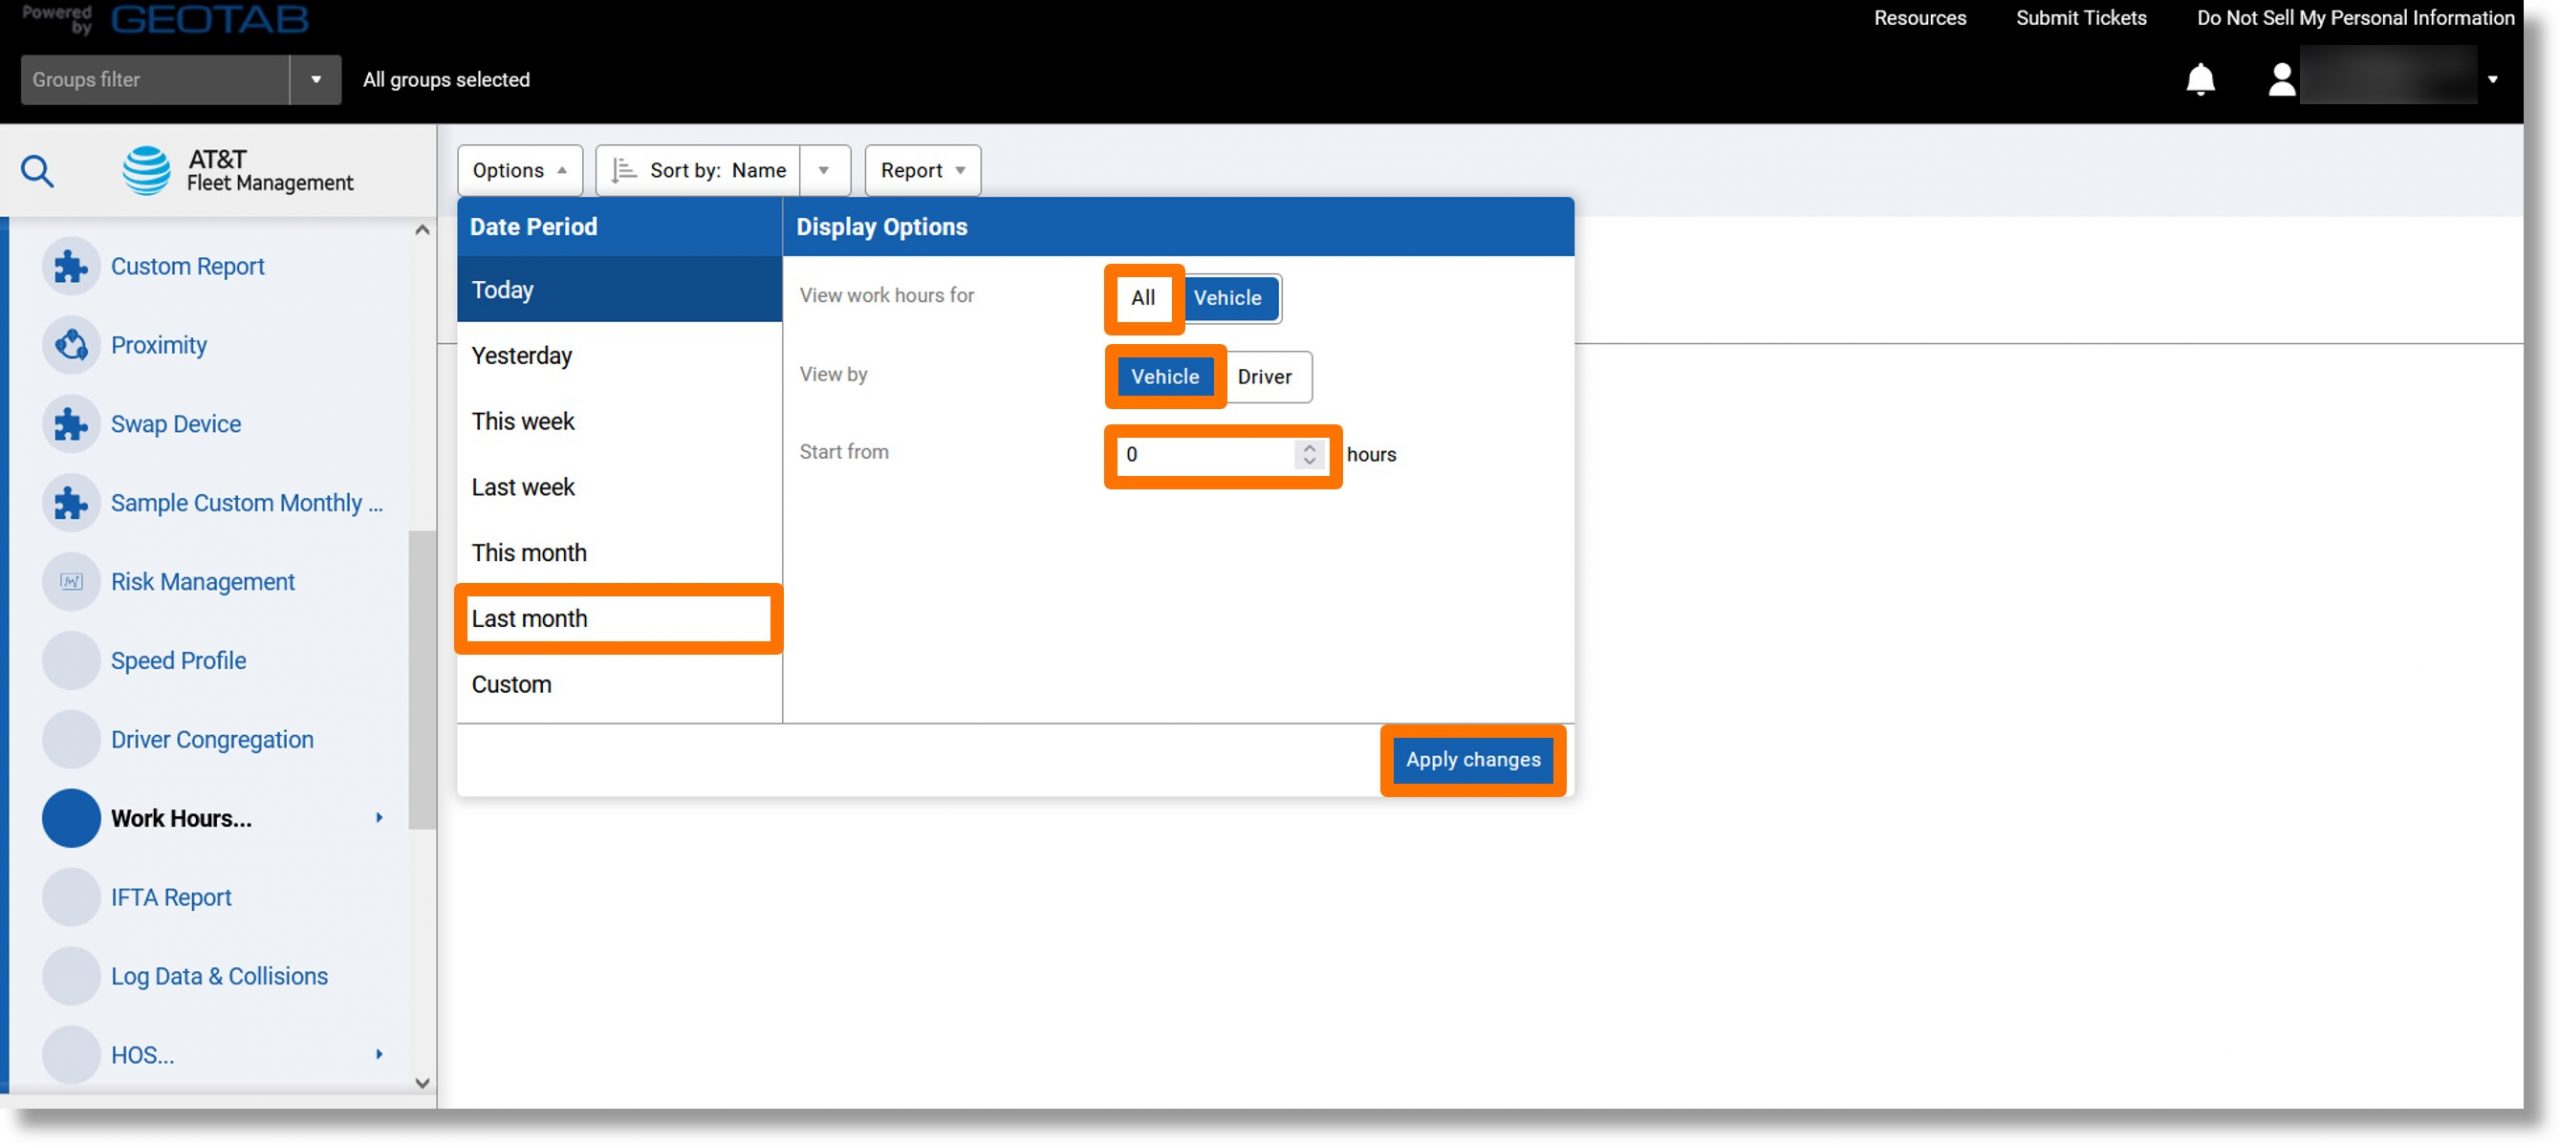
- Click on the desired timeframe under “DATE PERIOD”.
- Click on either the All or Vehicle button to the right of “View work hours for”.
- Click on either the Vehicle or Driver button to the right of “View by”.
- Click in the field to the right of “Start from” and enter the desired hours.
- Click on the Apply changes button.
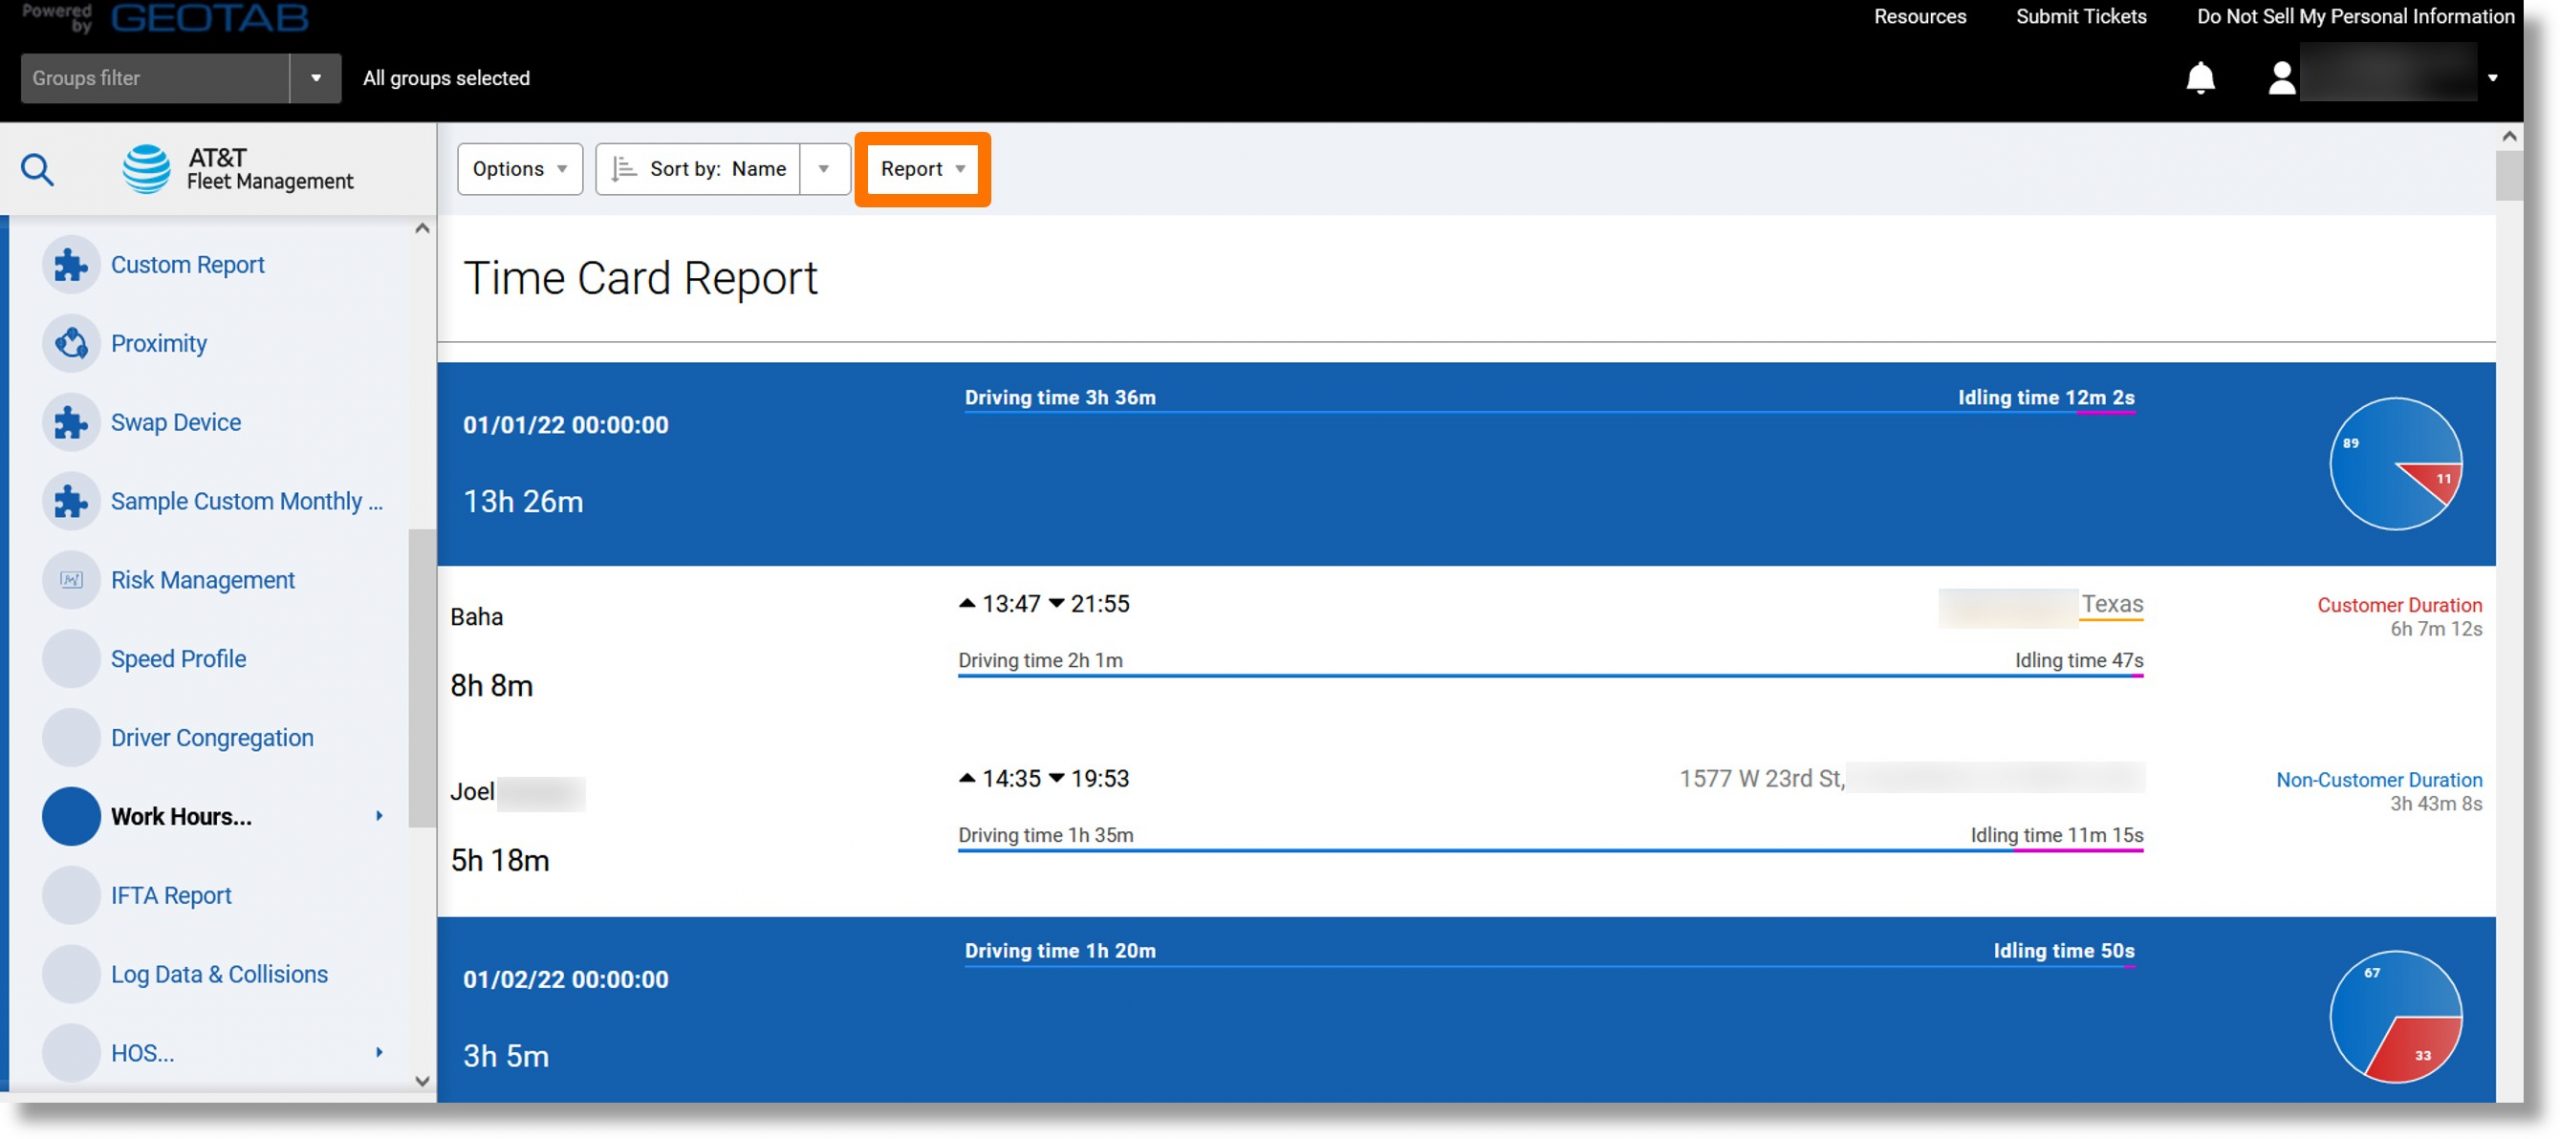
- The Time Card overview displays.
- Click on the Report dropdown.
- Click on the ellipsis icon
 to the right of either “Standard” or “Advanced” and click on View in browser.
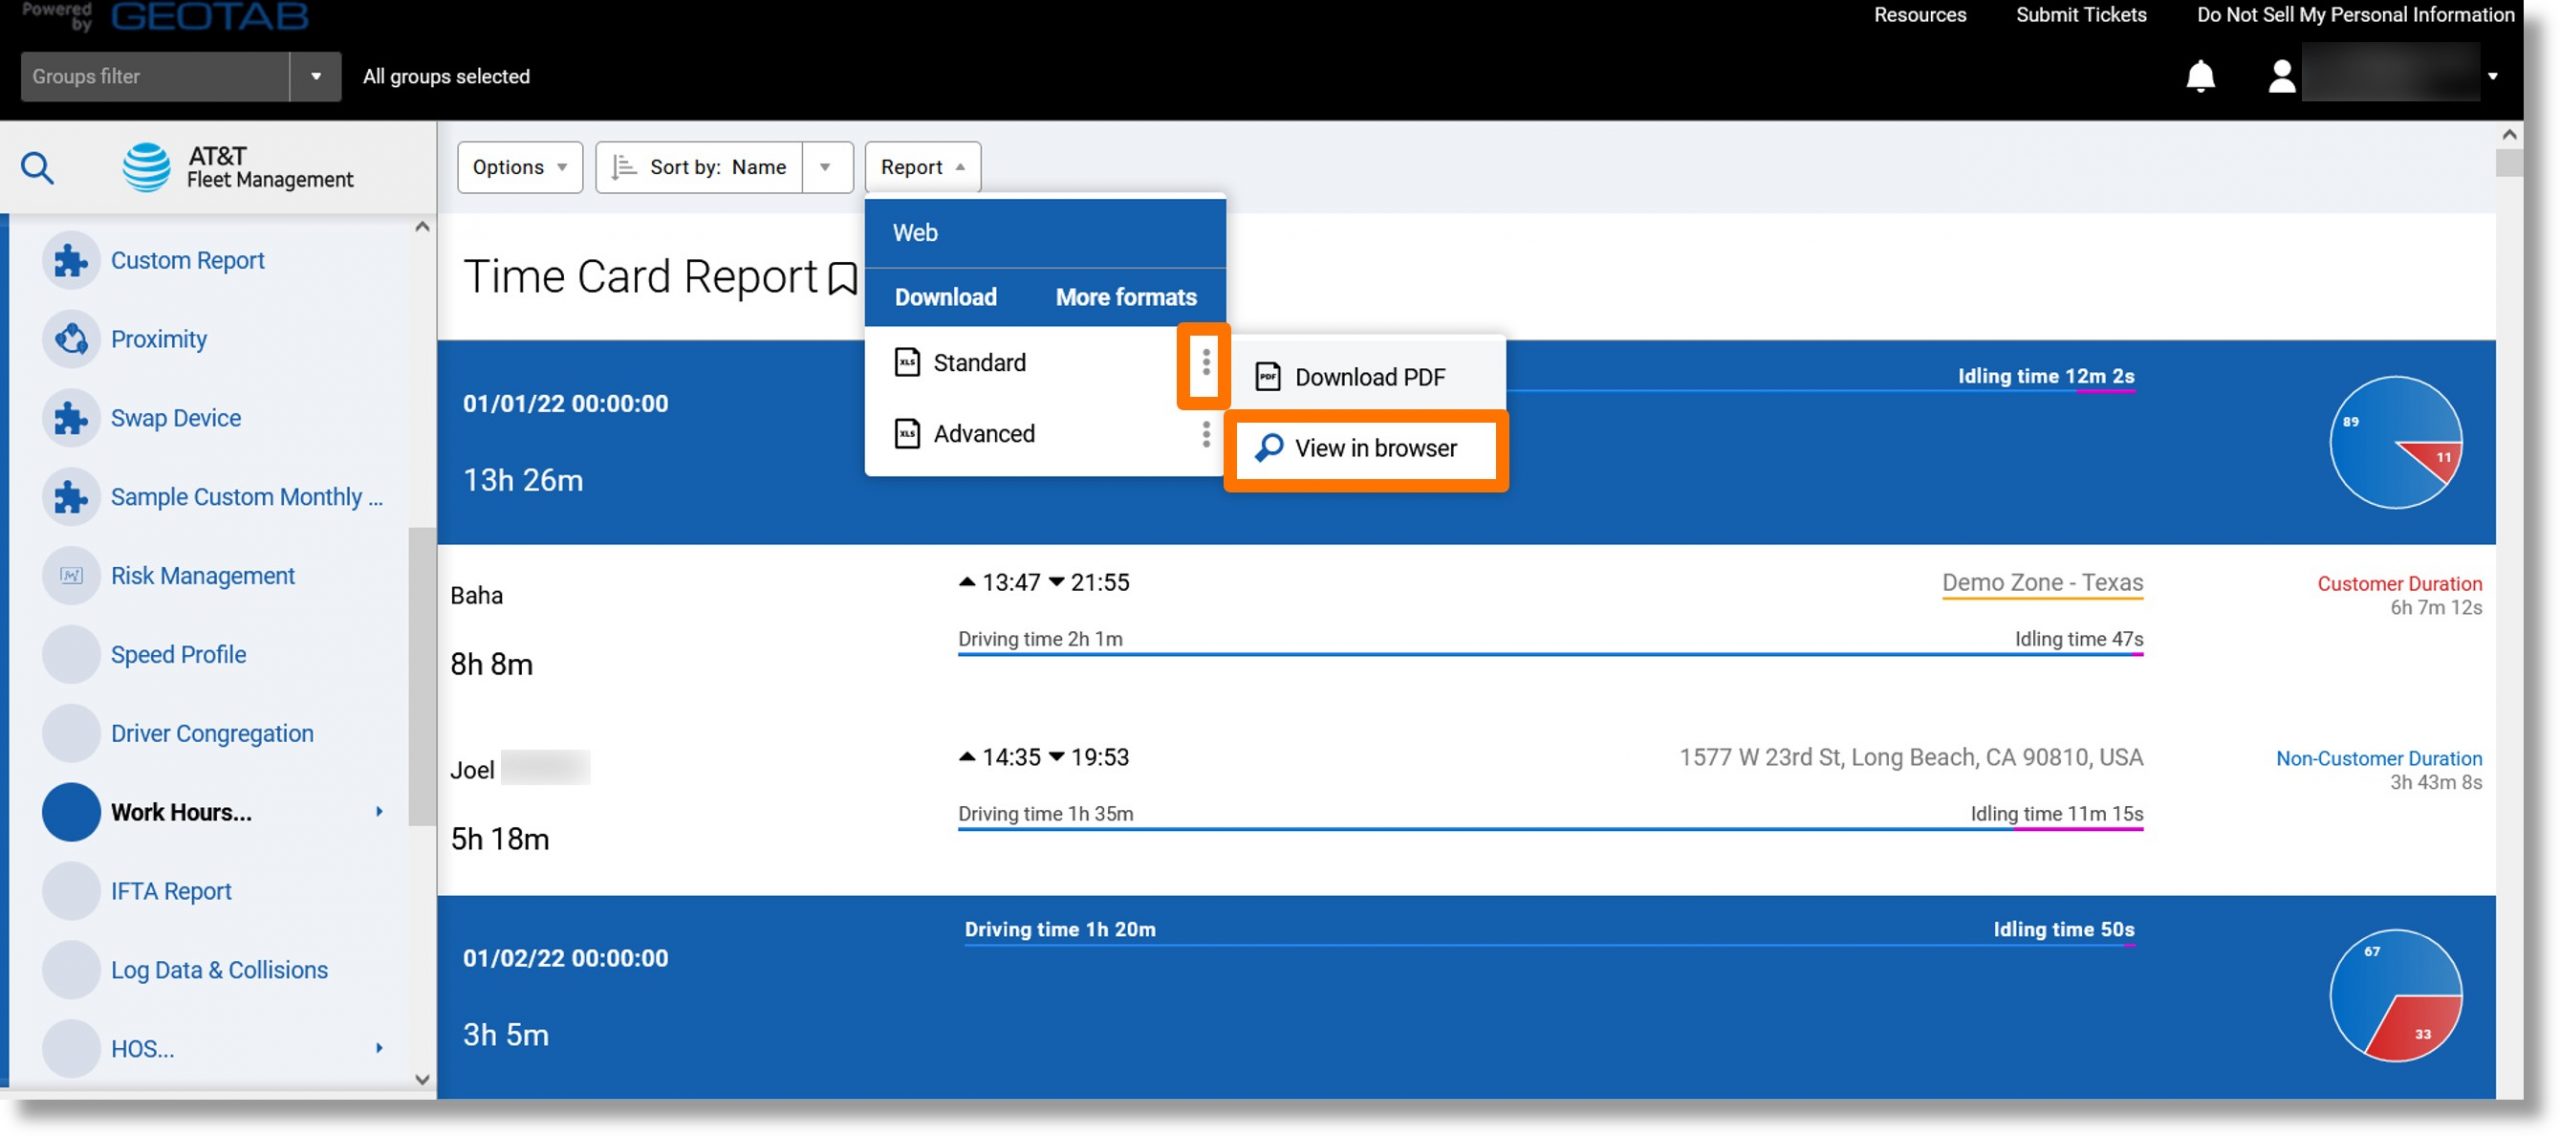
- The report downloads and displays.
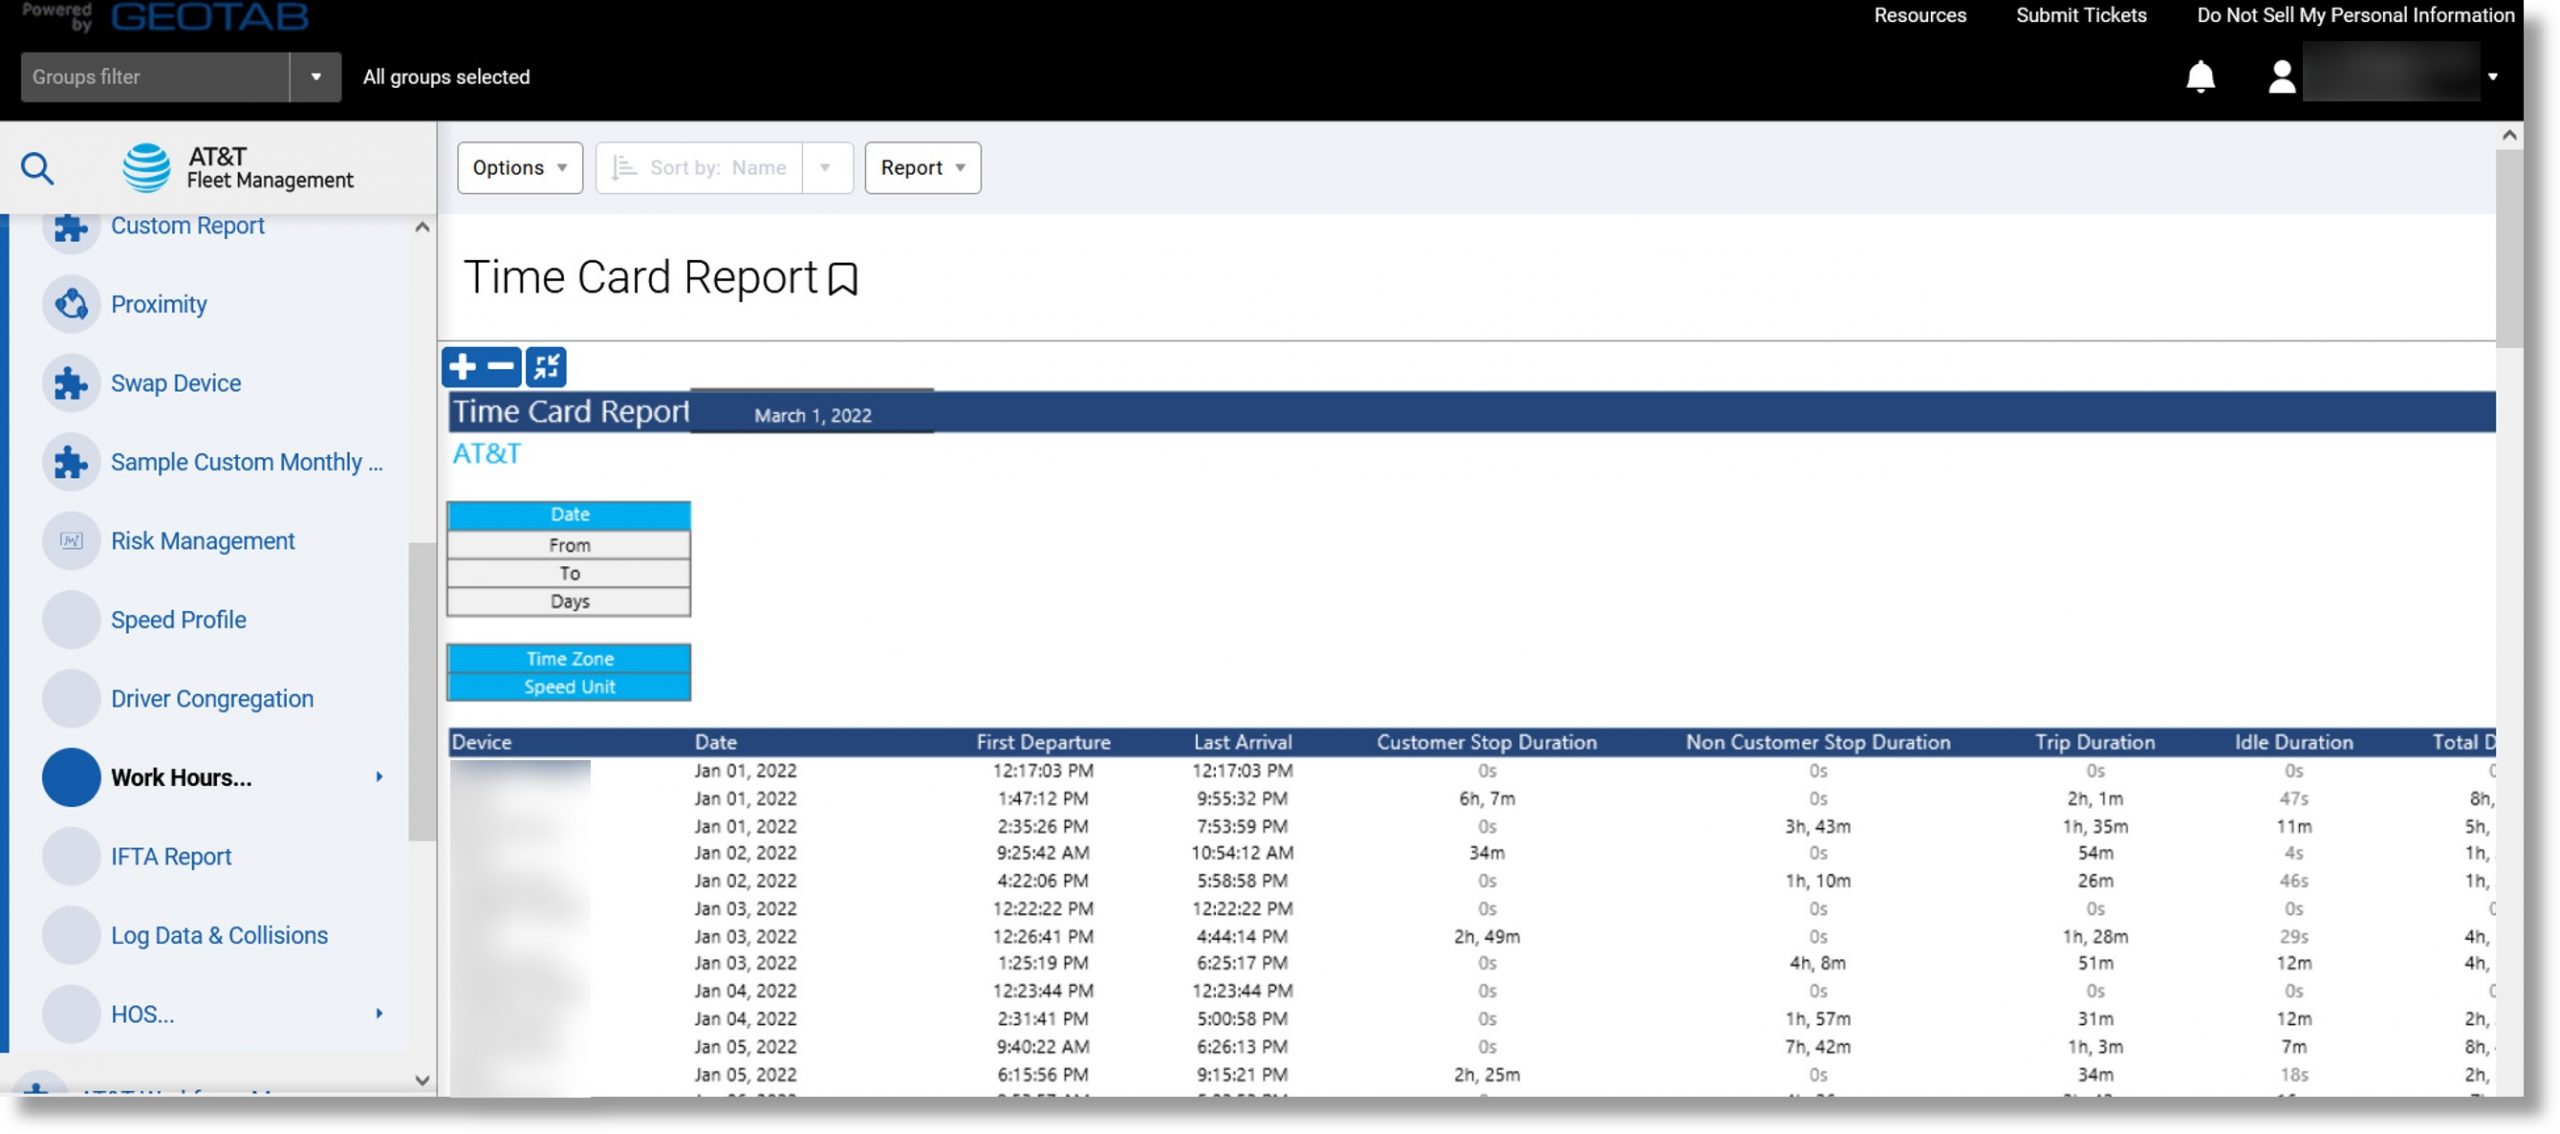
Top
IFTA Report
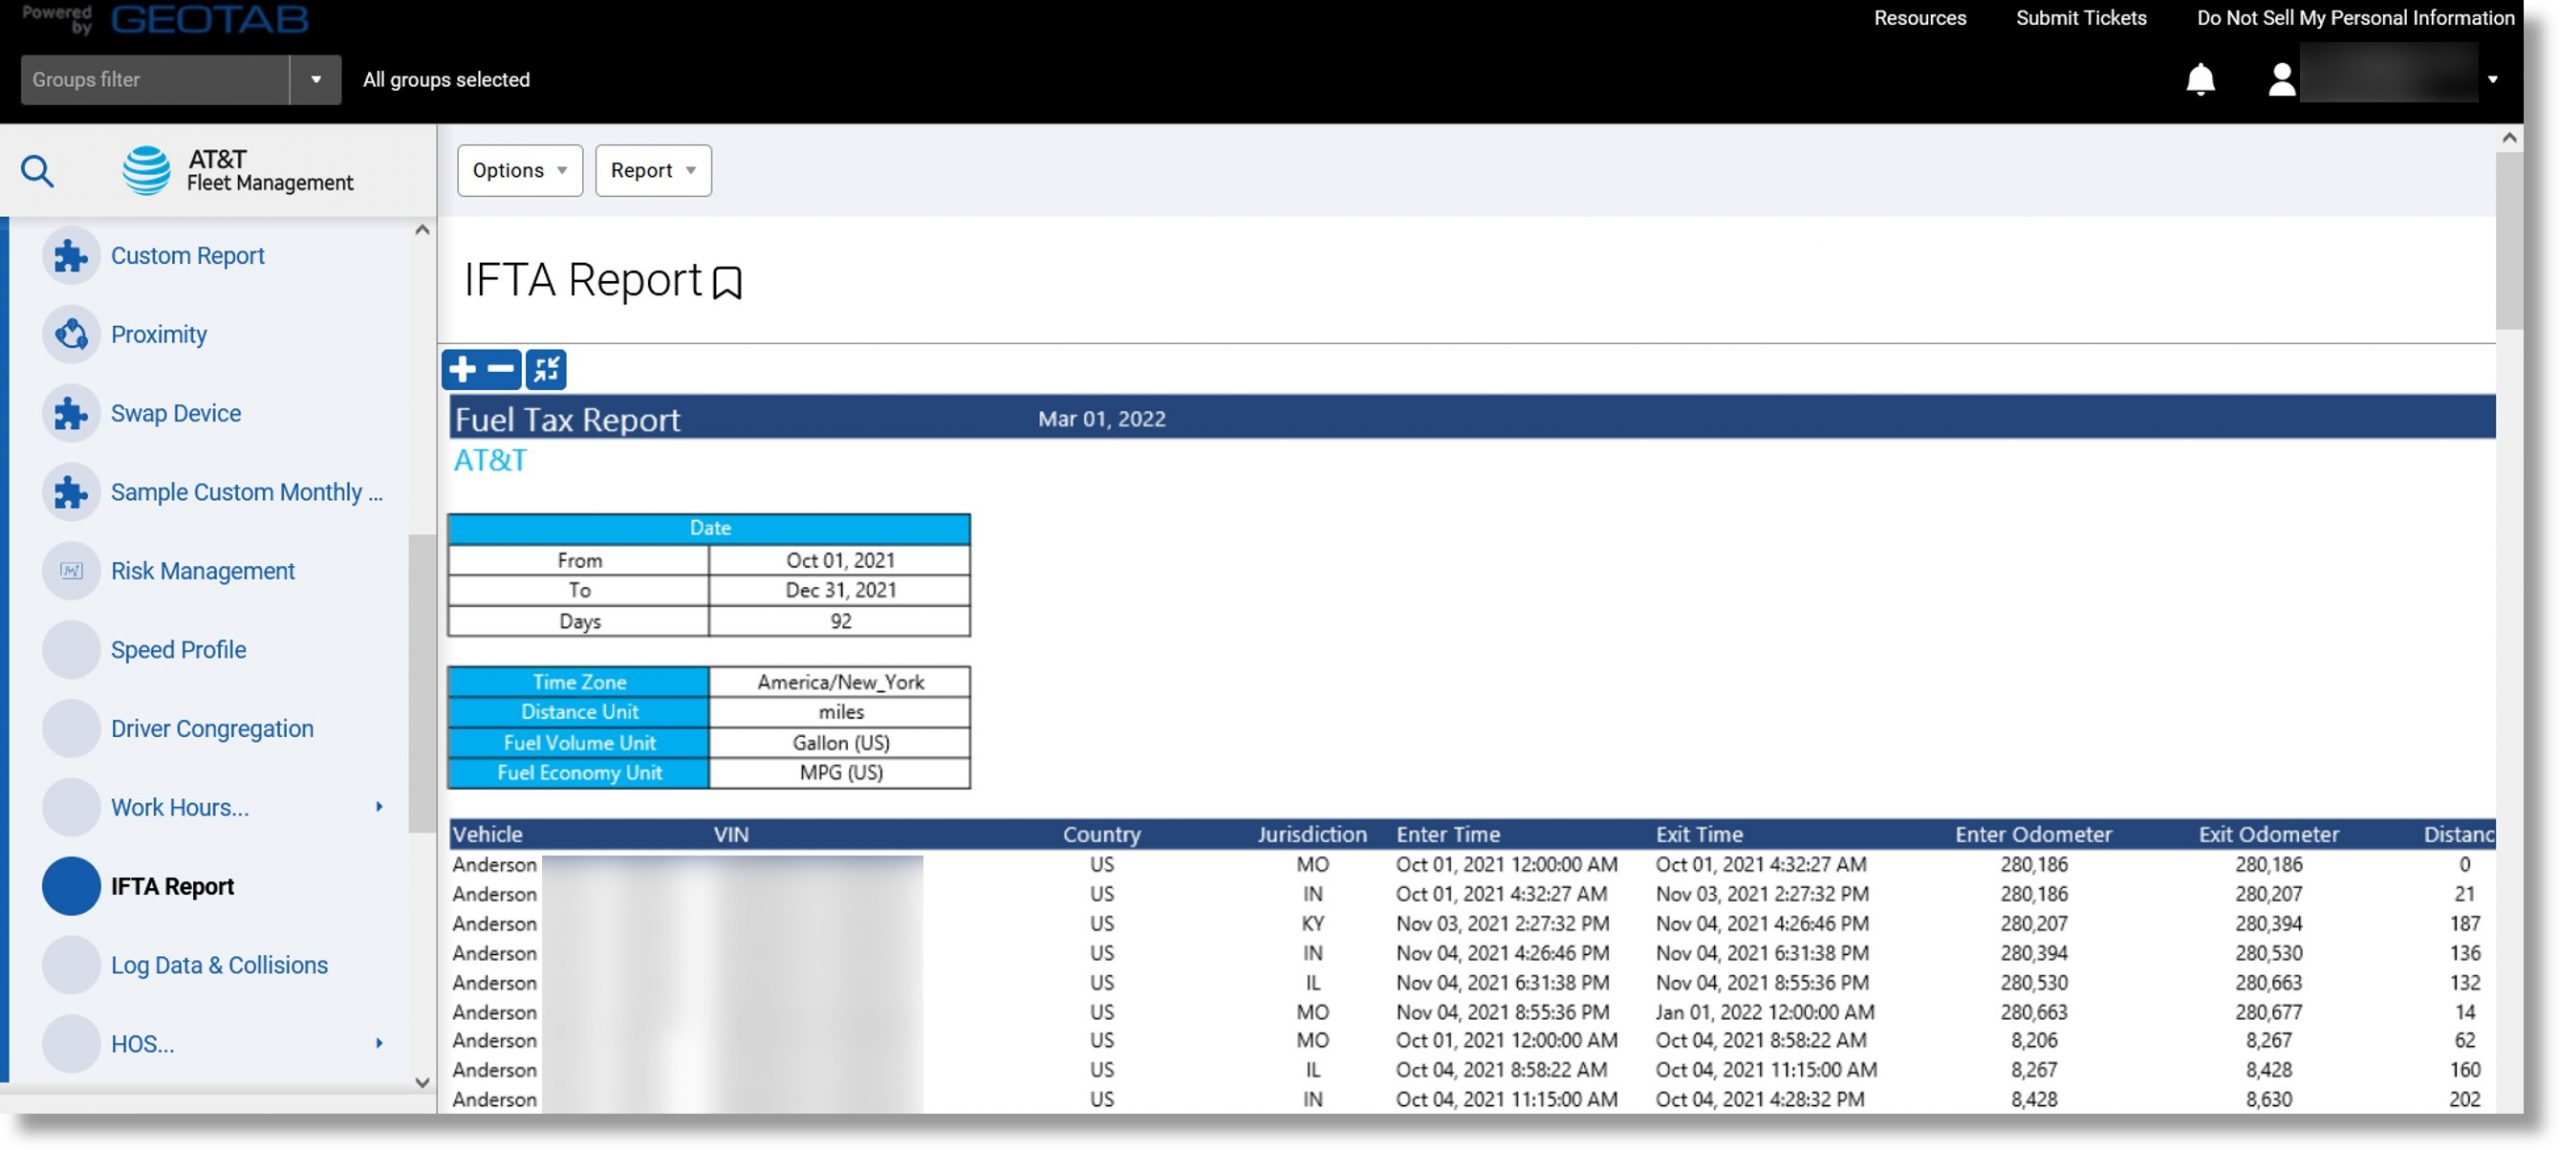
Use: Total mileage driven in each state is automated for fuel tax reporting. This is beneficial in reducing paperwork and improving efficiencies. Note, we do not complete tax filing.
Information included: State enter and exit time, the name of the state, enter and exit odometer, and total mileage in each state
Additional Information when exported: Includes additional data such as country, device group, etc.
Accessing the report:
- Click on Activity in the column on the left and scroll down.
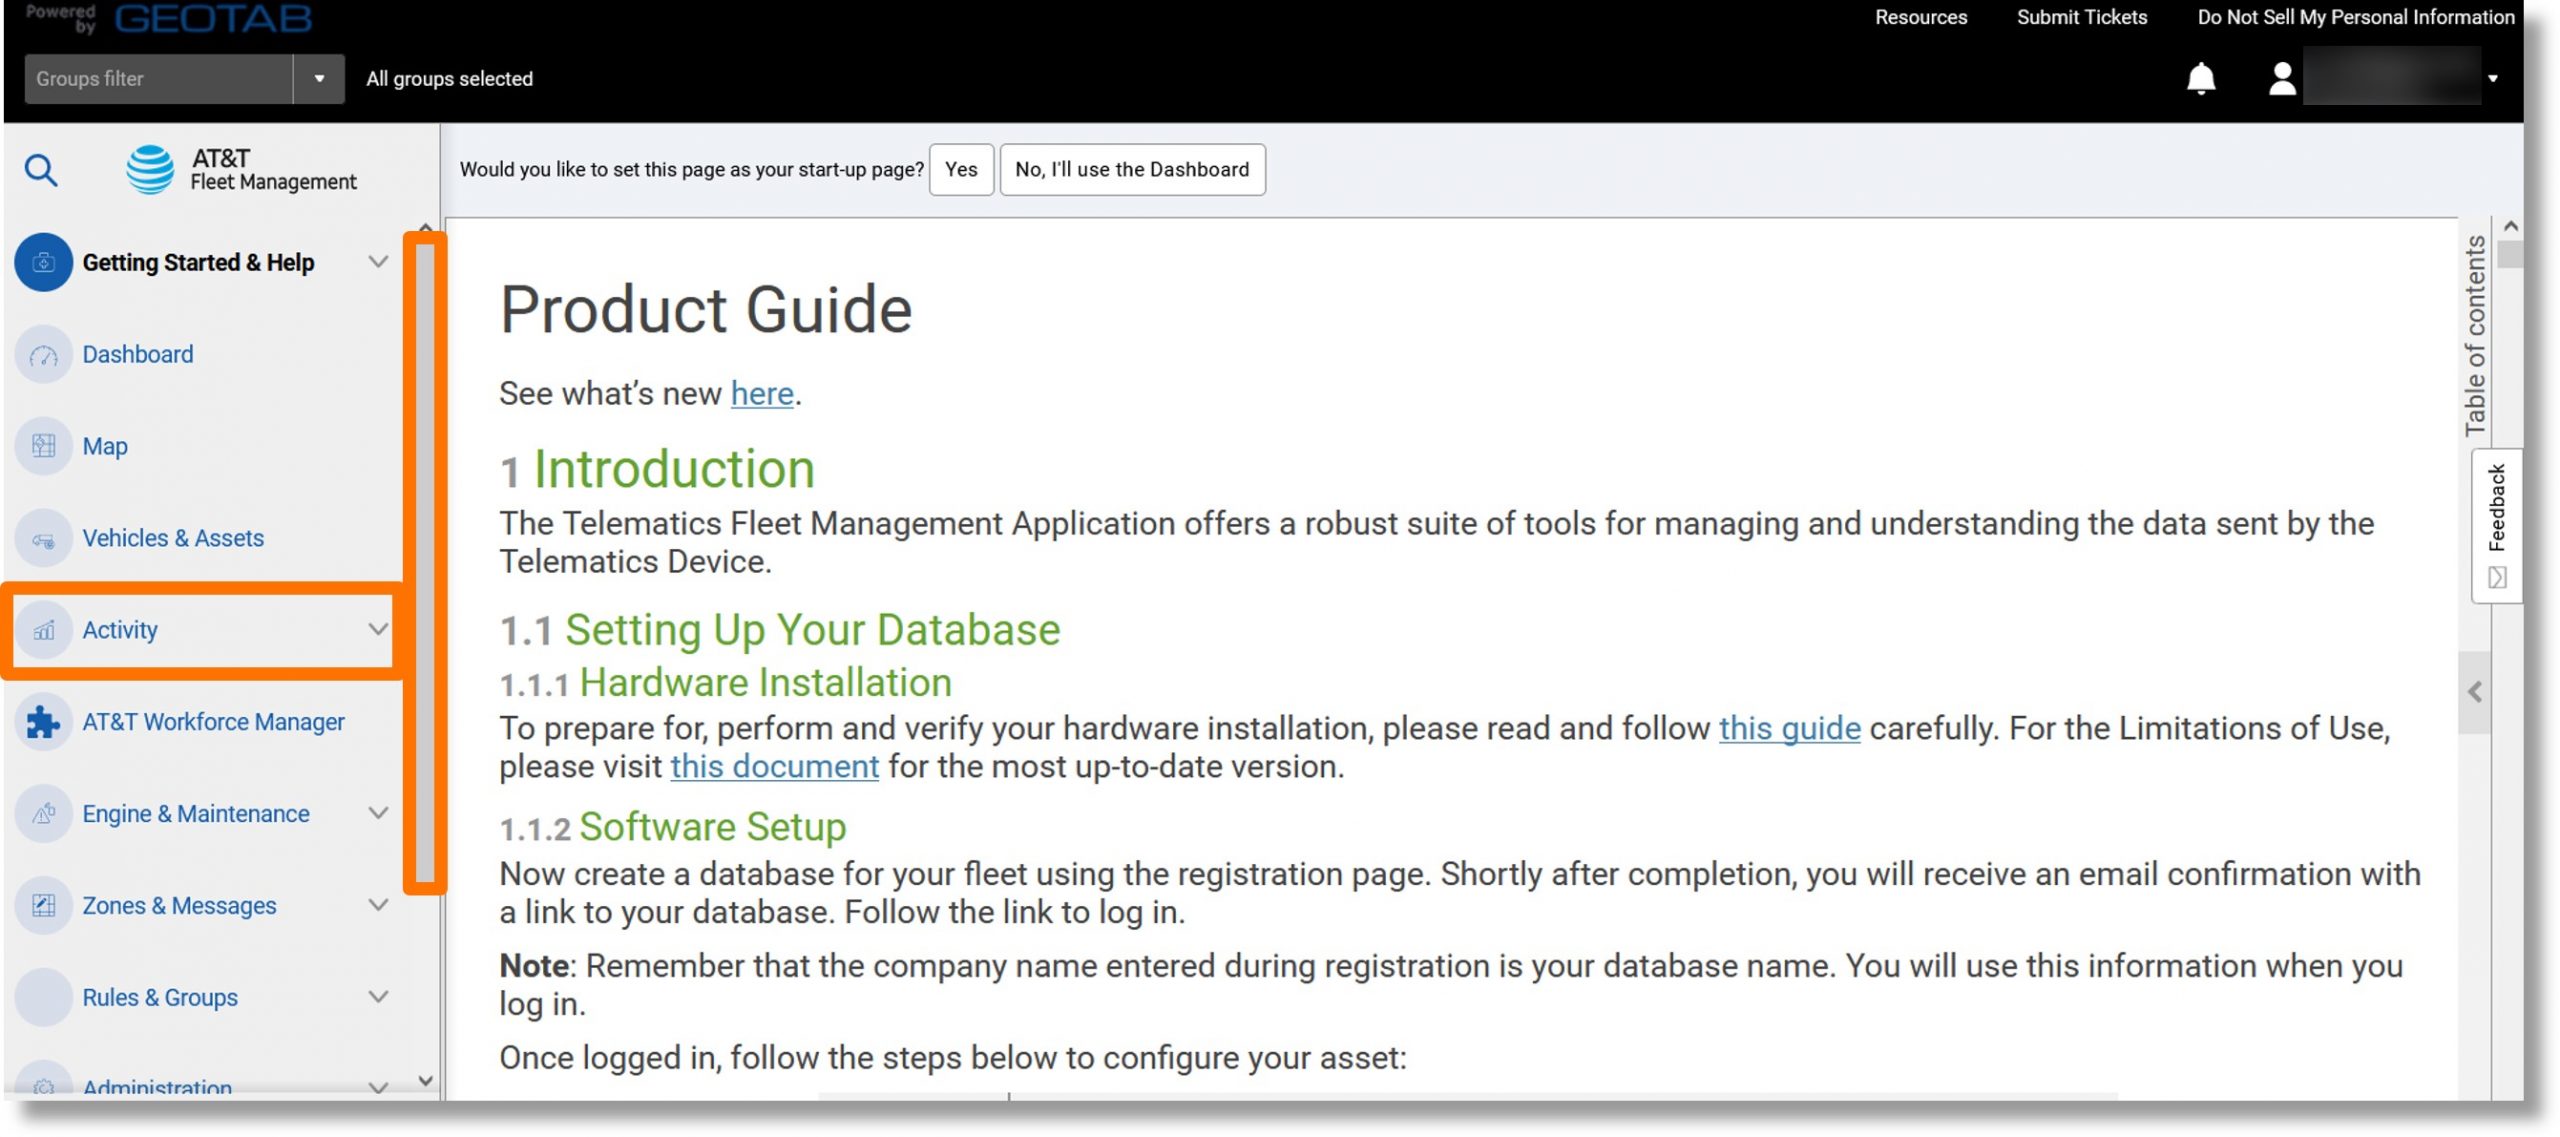
- Click on IFTA Report in the menu.
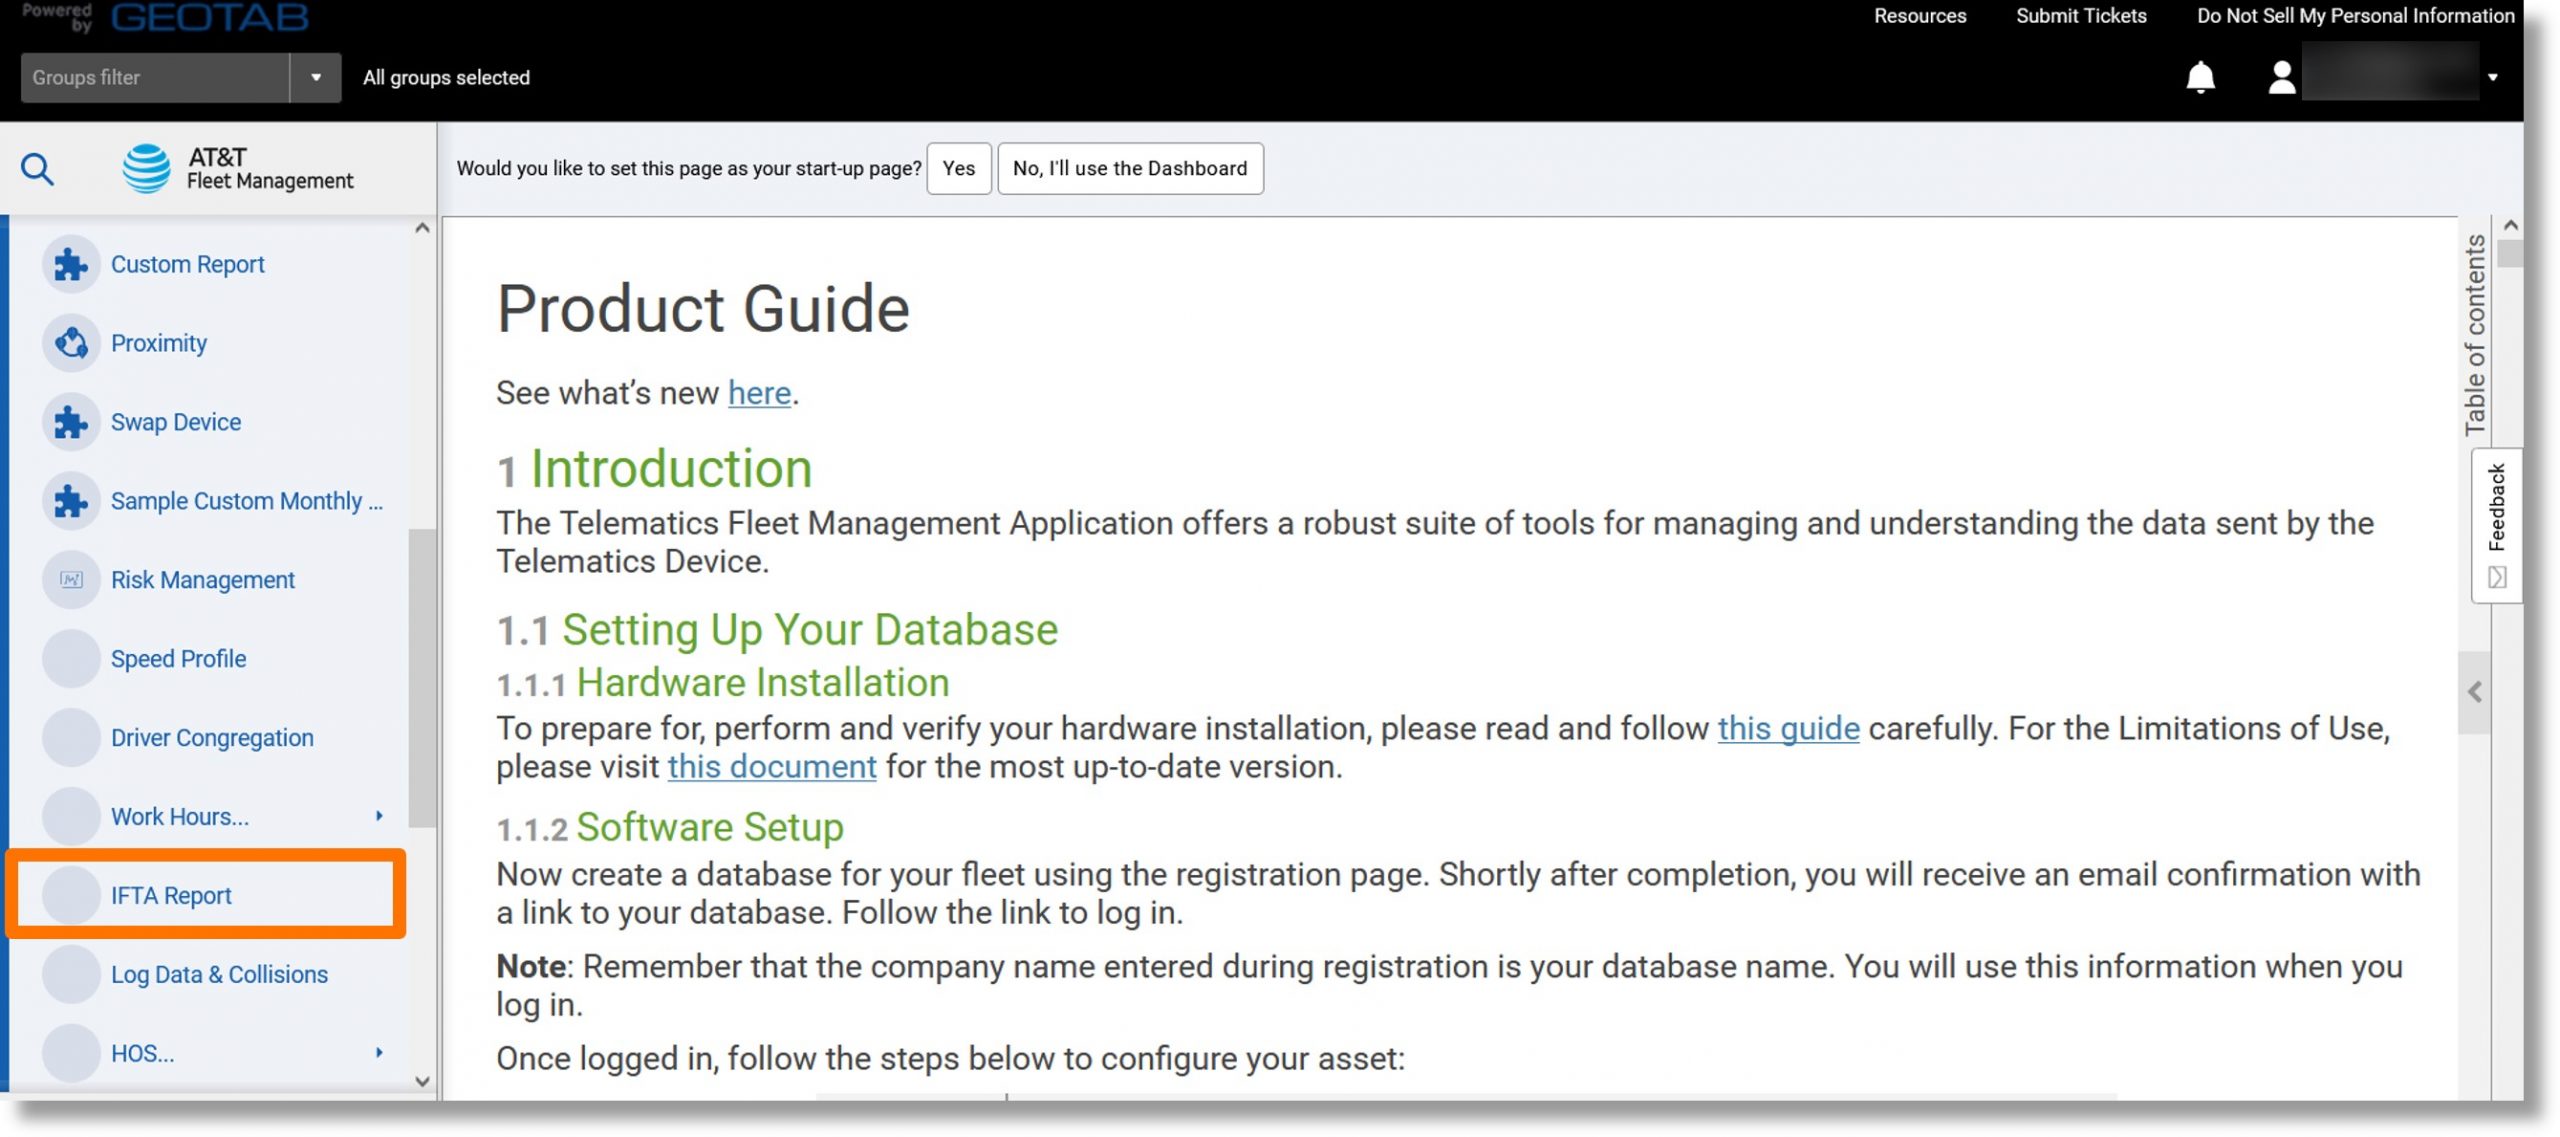
- Click on the desired timeframe under “Date Period”.
- Click on the Yes or No button to the right of “Include archived (historical) data”.
- Click on the dropdown to the right of “Vehicles” and click on the desired vehicle(s).
- Click the Apply changes button.
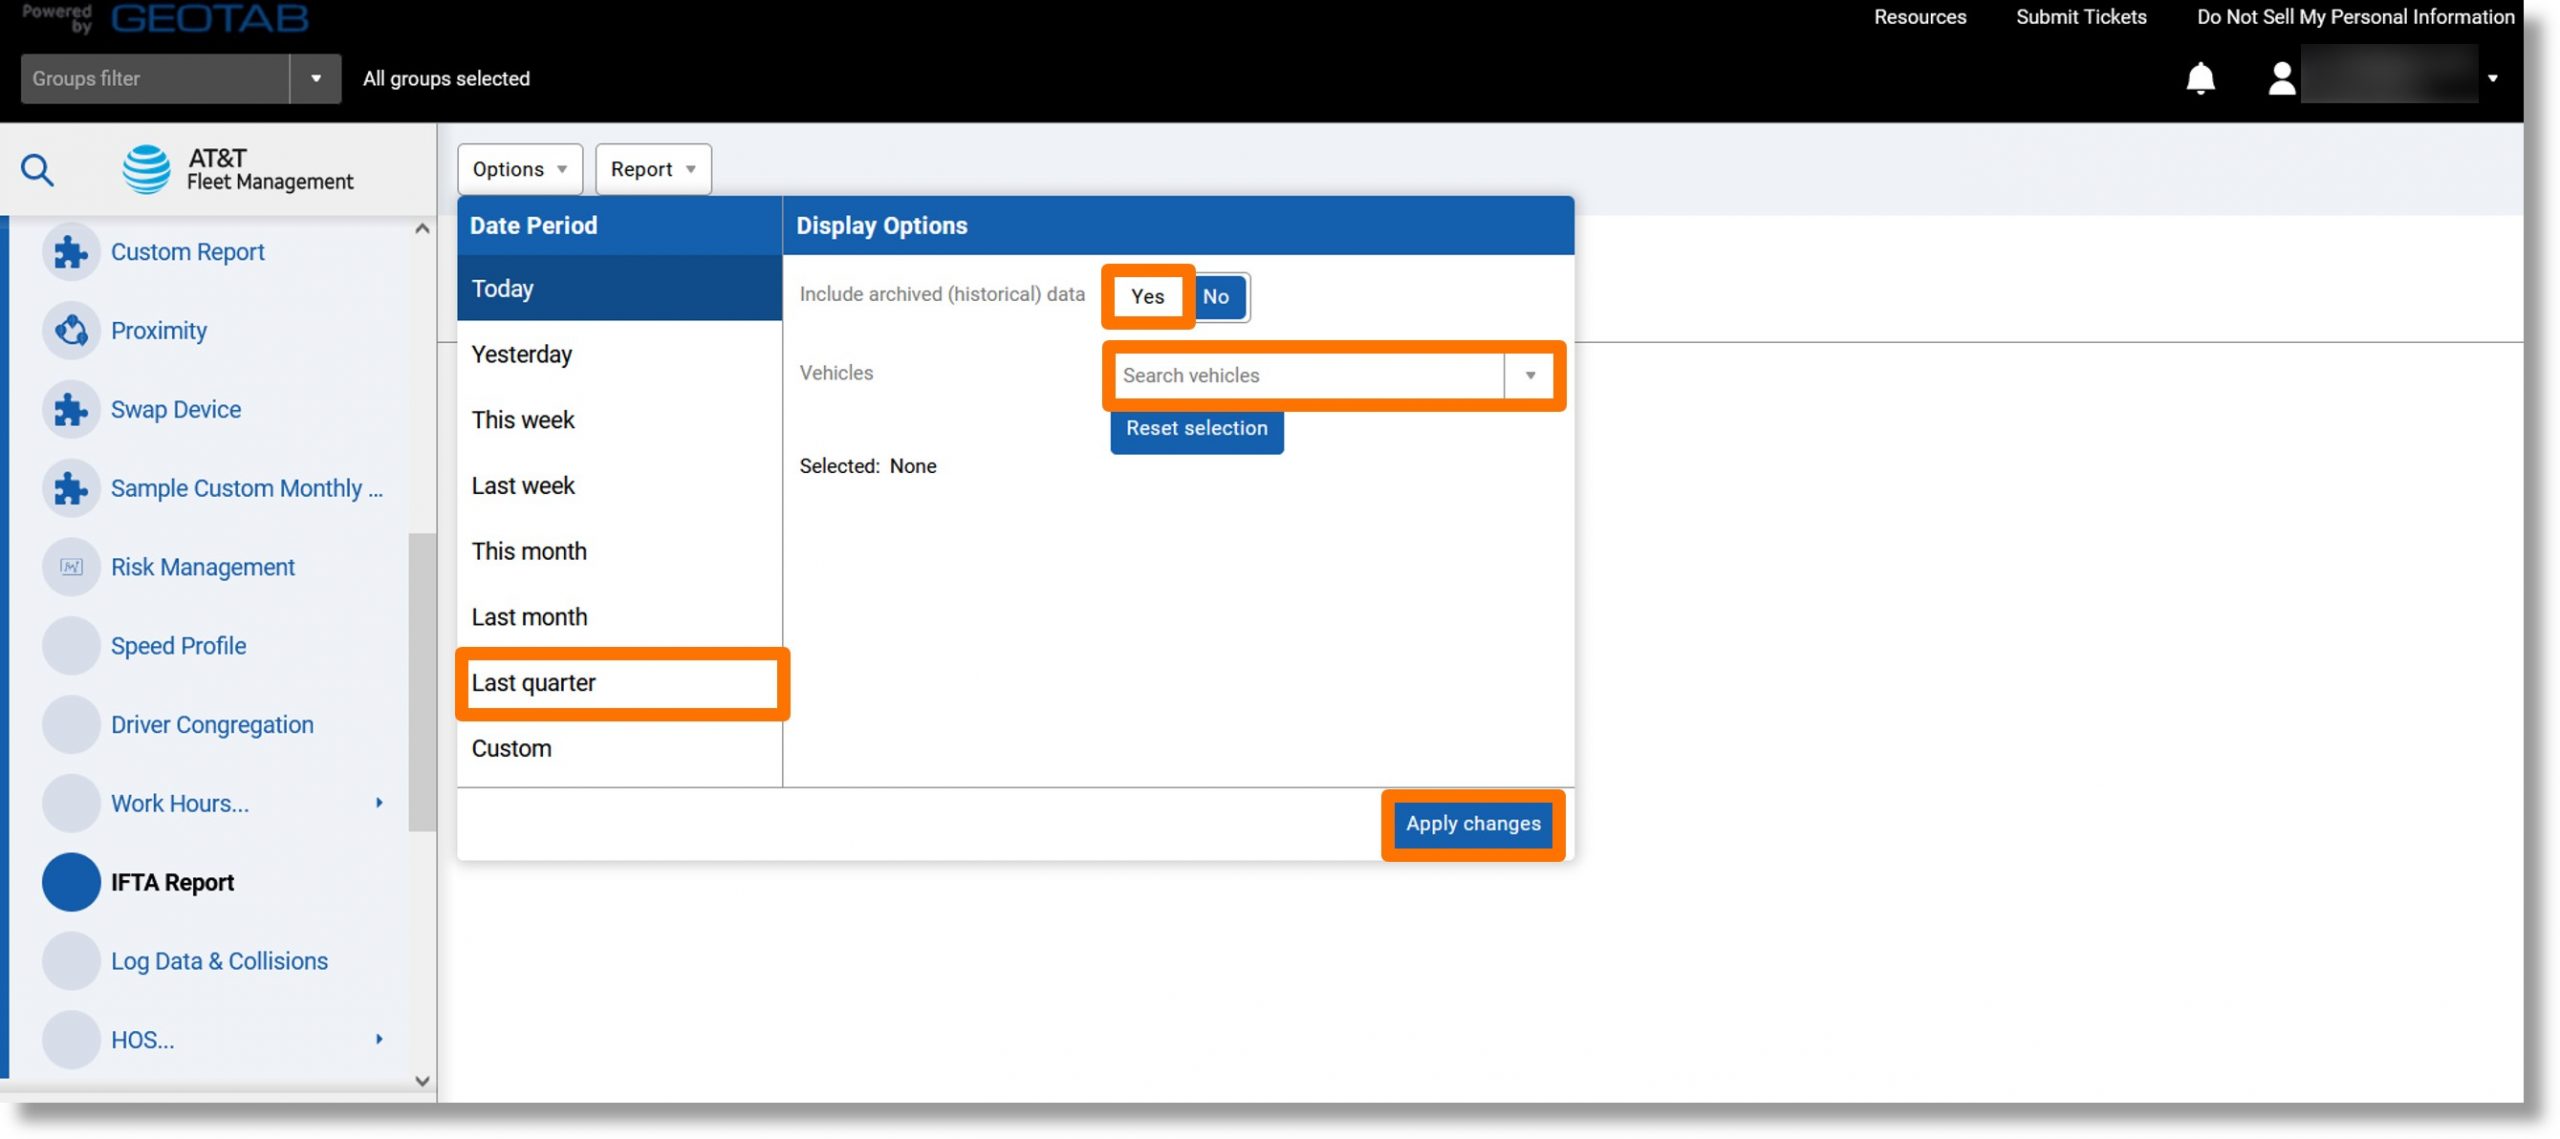
- The overview displays.
- Click on the Report dropdown.
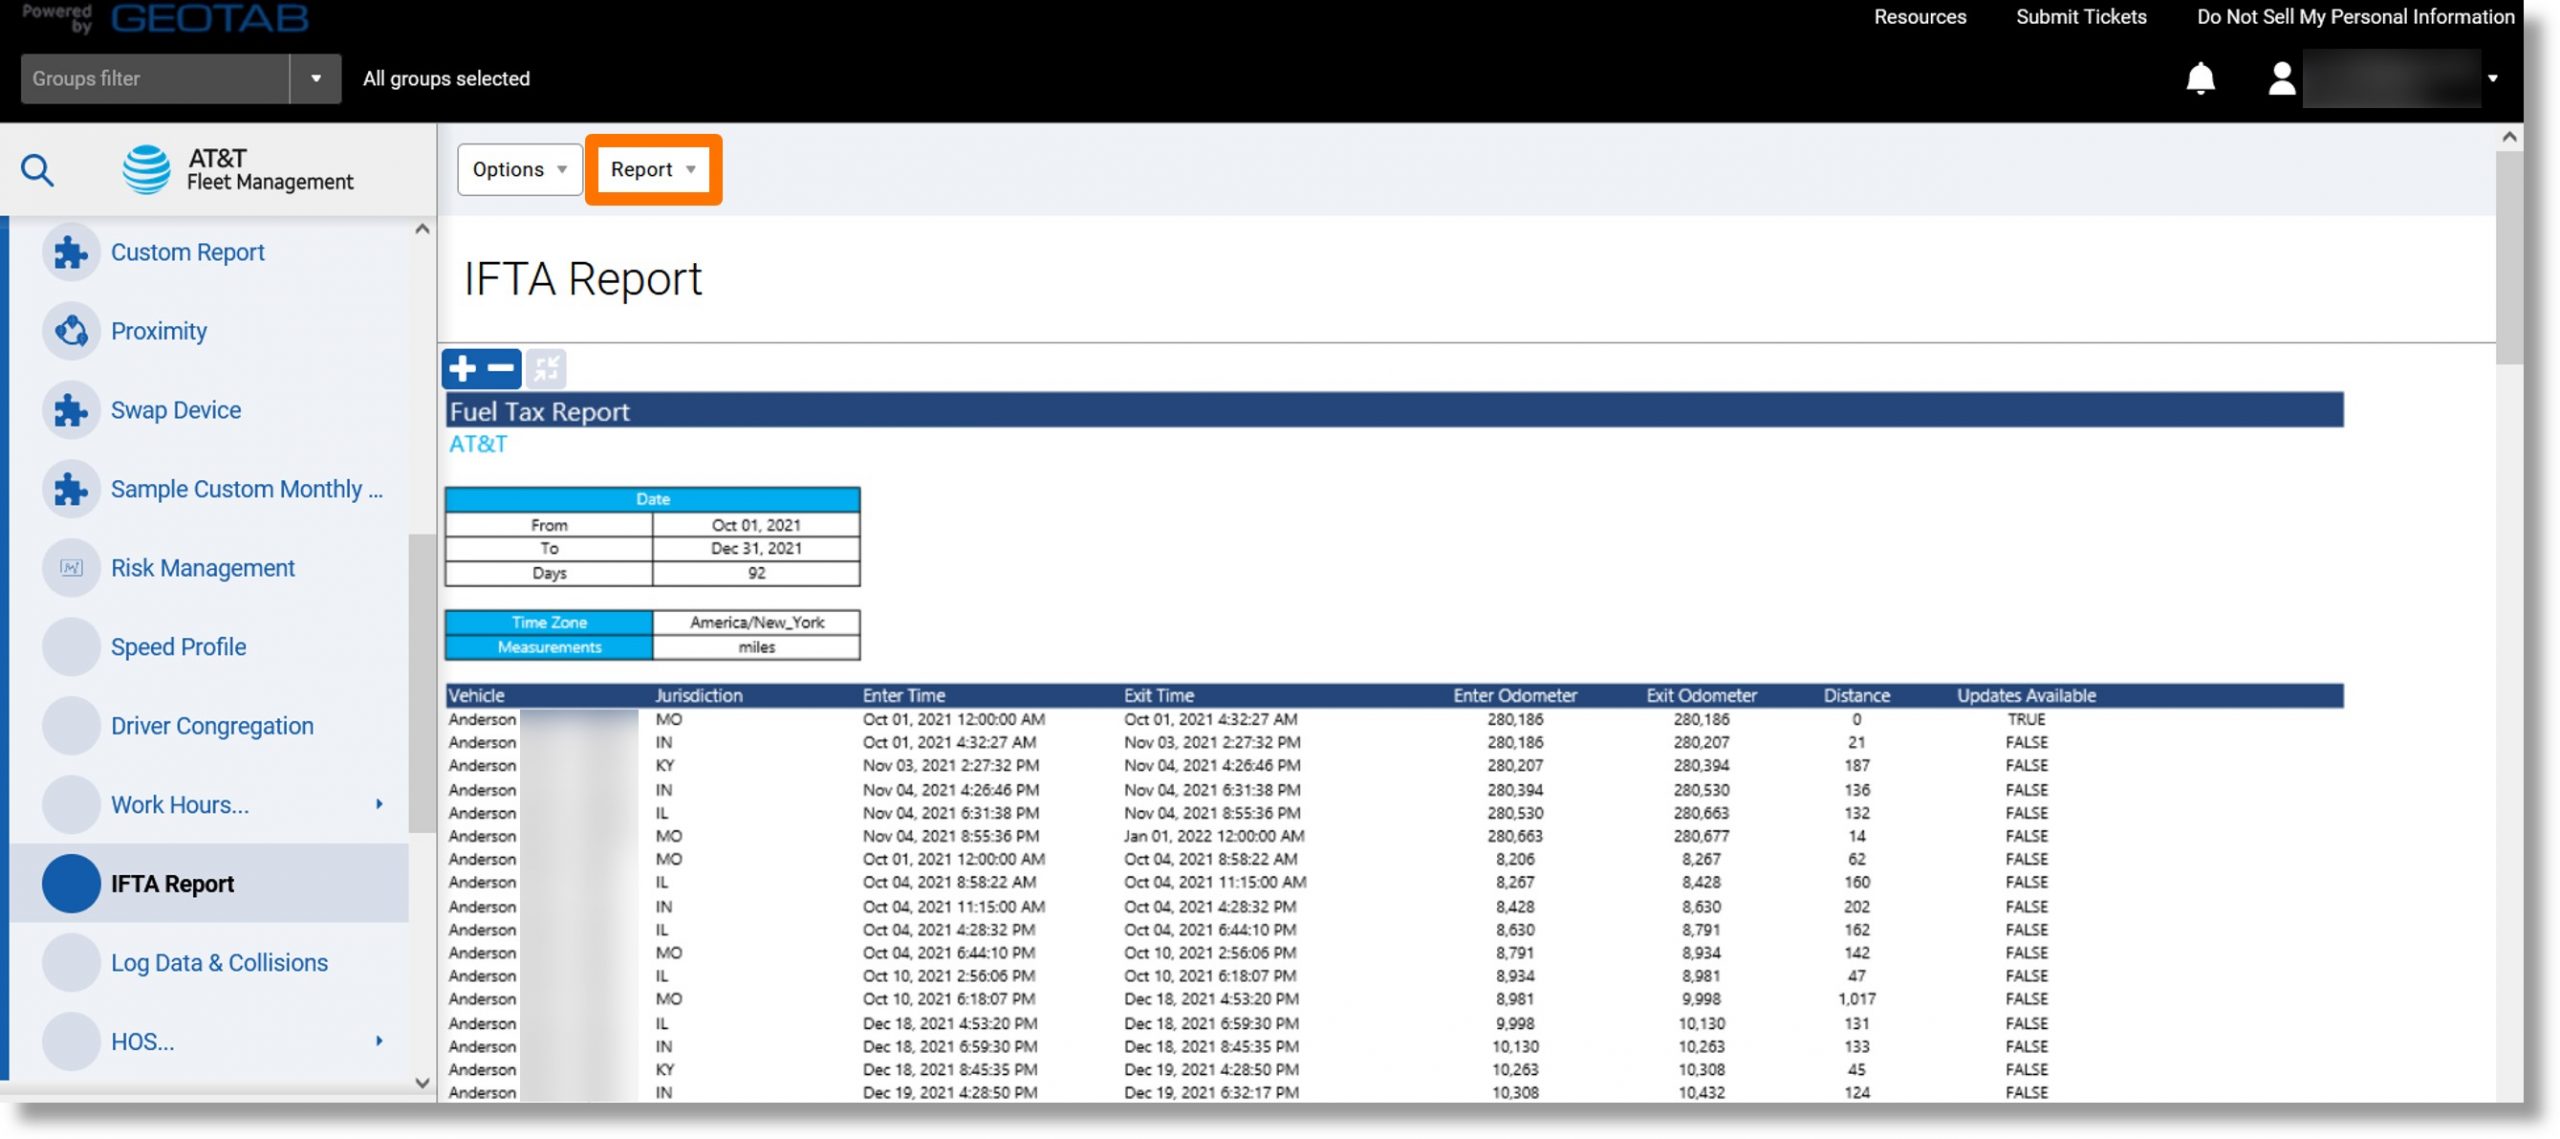
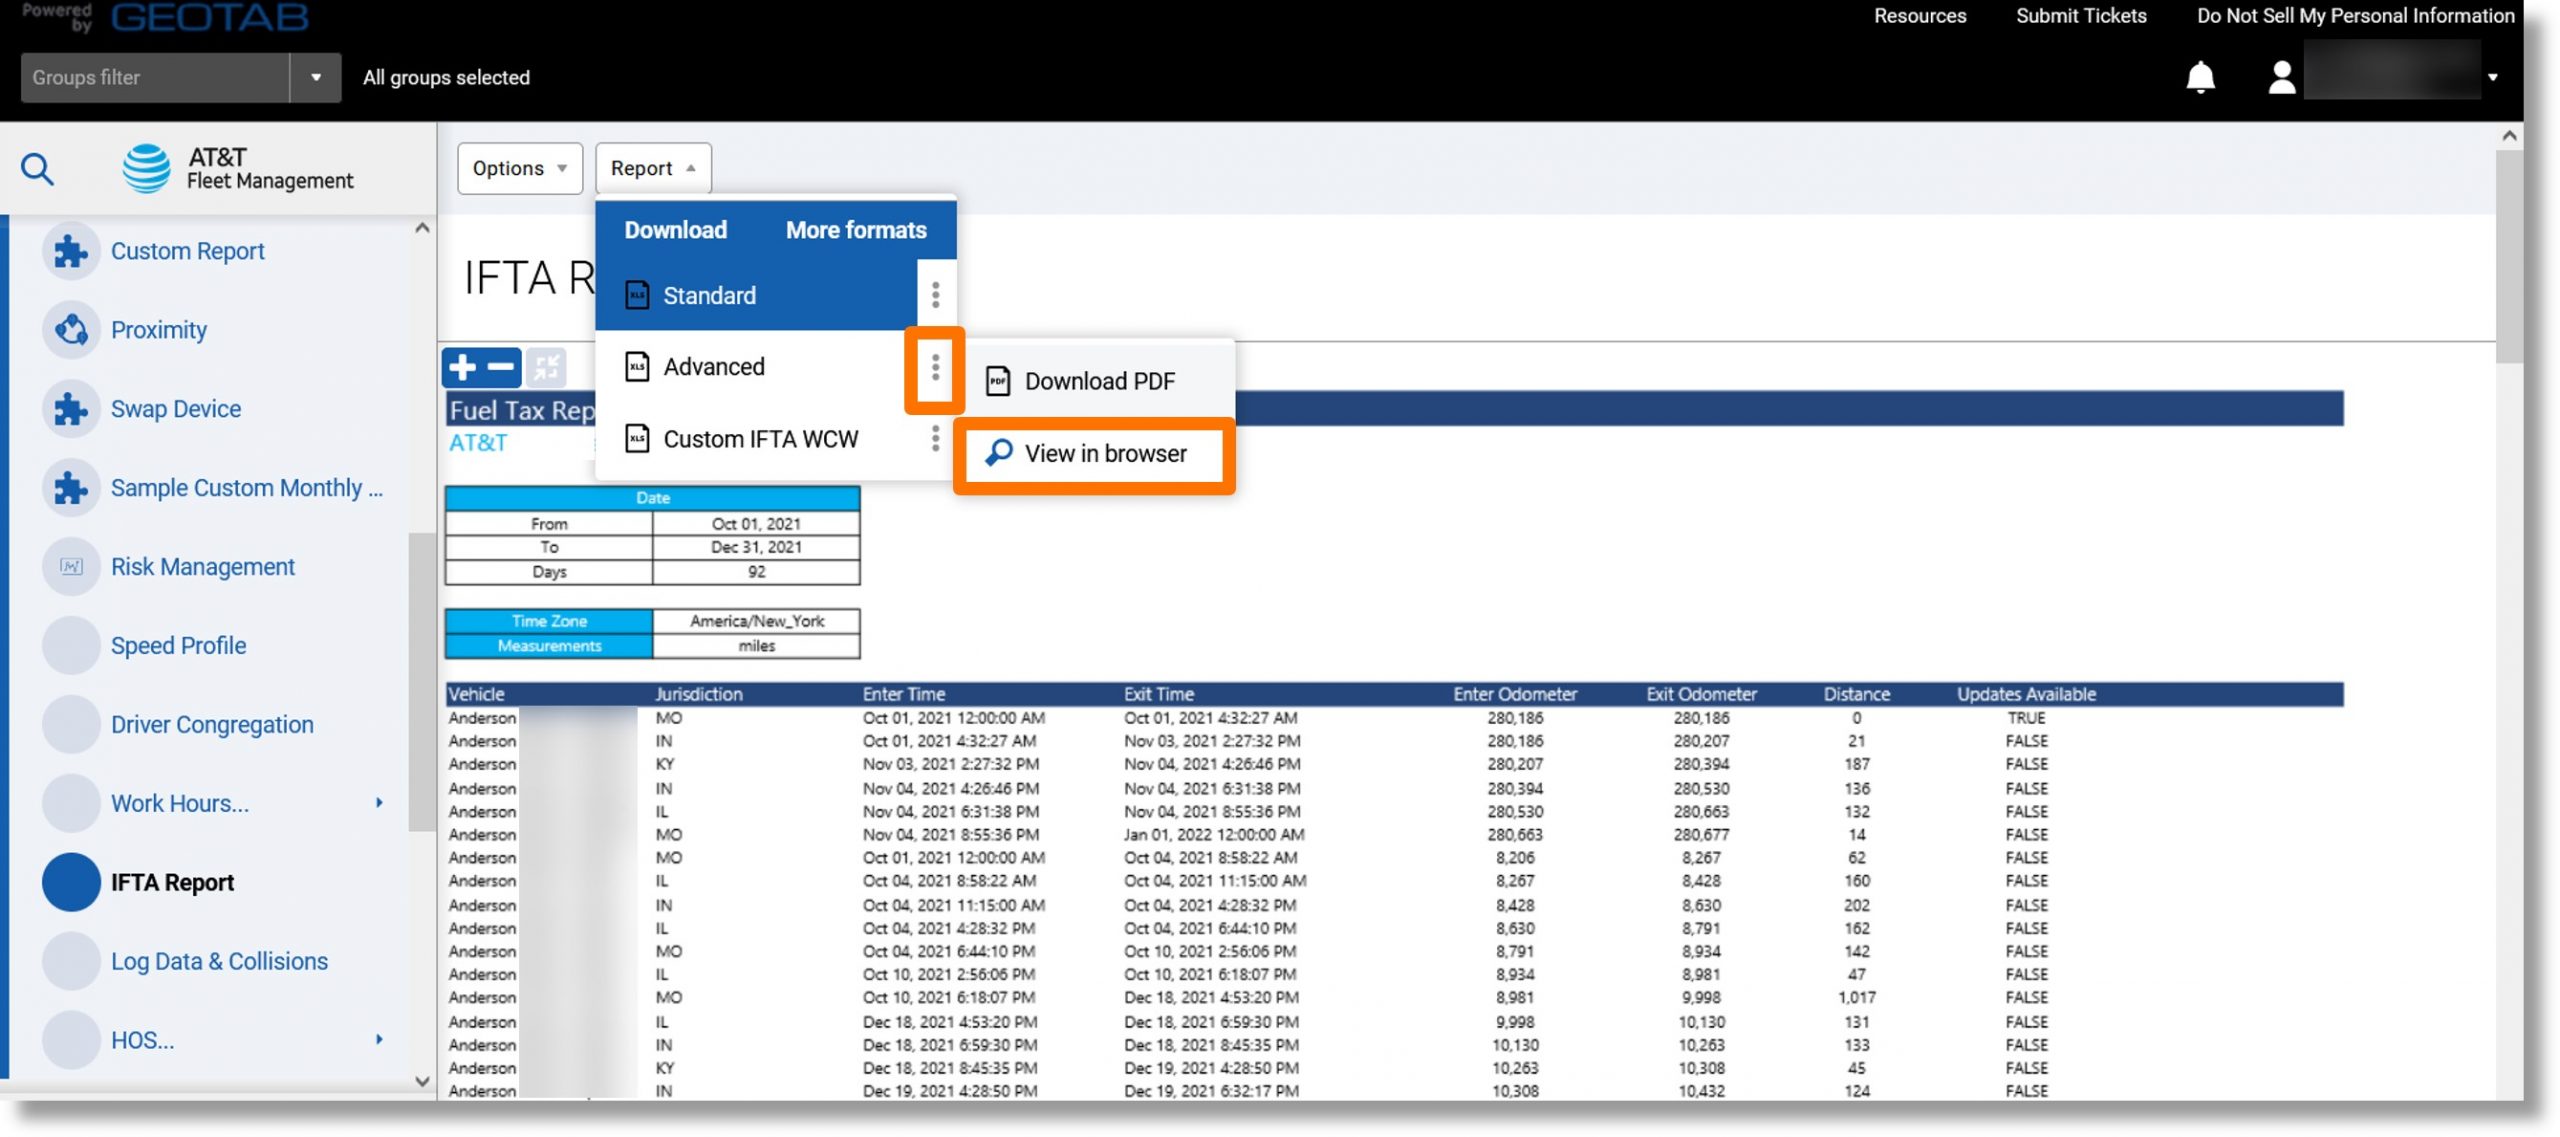
- Click on the ellipsis icon
 to the right of either “Standard” or “Advanced” and then click on View in browser.
- The report downloads and displays.
Top
Speed Profile Report
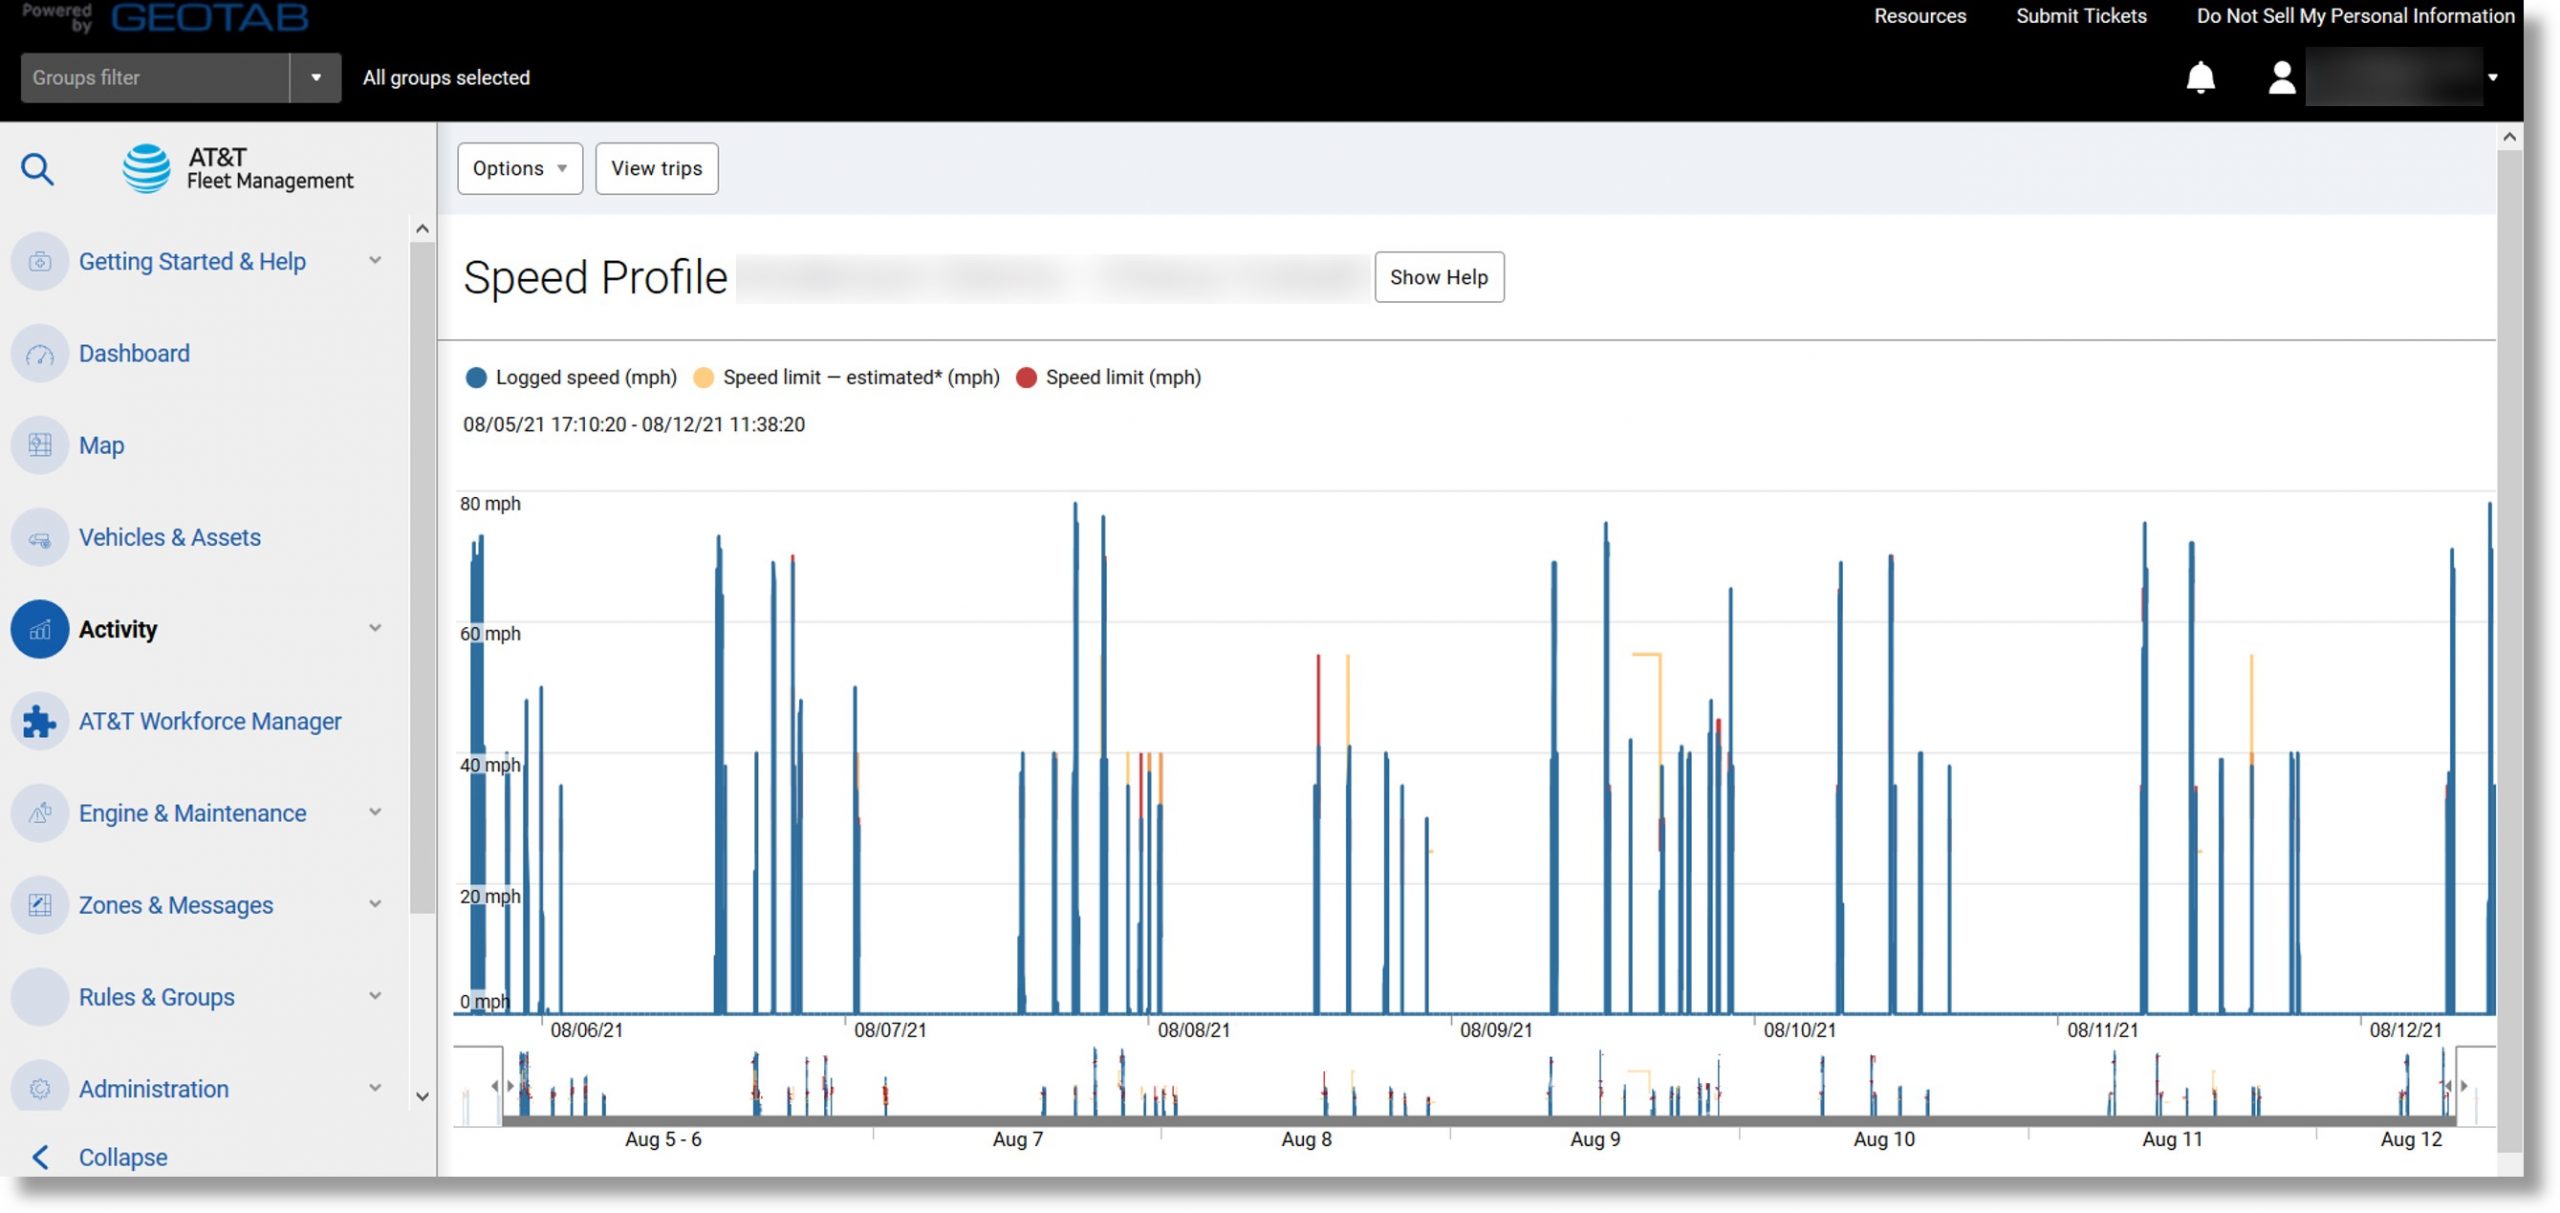
Use: Provides a visual representation of actual speed vs. posted road speed.
Information included: The blue line represents the speed the vehicle is traveling, and the orange line shows the speed limit. A solid orange line means we have high confidence that the speed limit data is accurate, a dashed line means that it is based on data that may be less accurate, and no line means we do not have any speed limit data for that point in the trip.
Accessing the report:
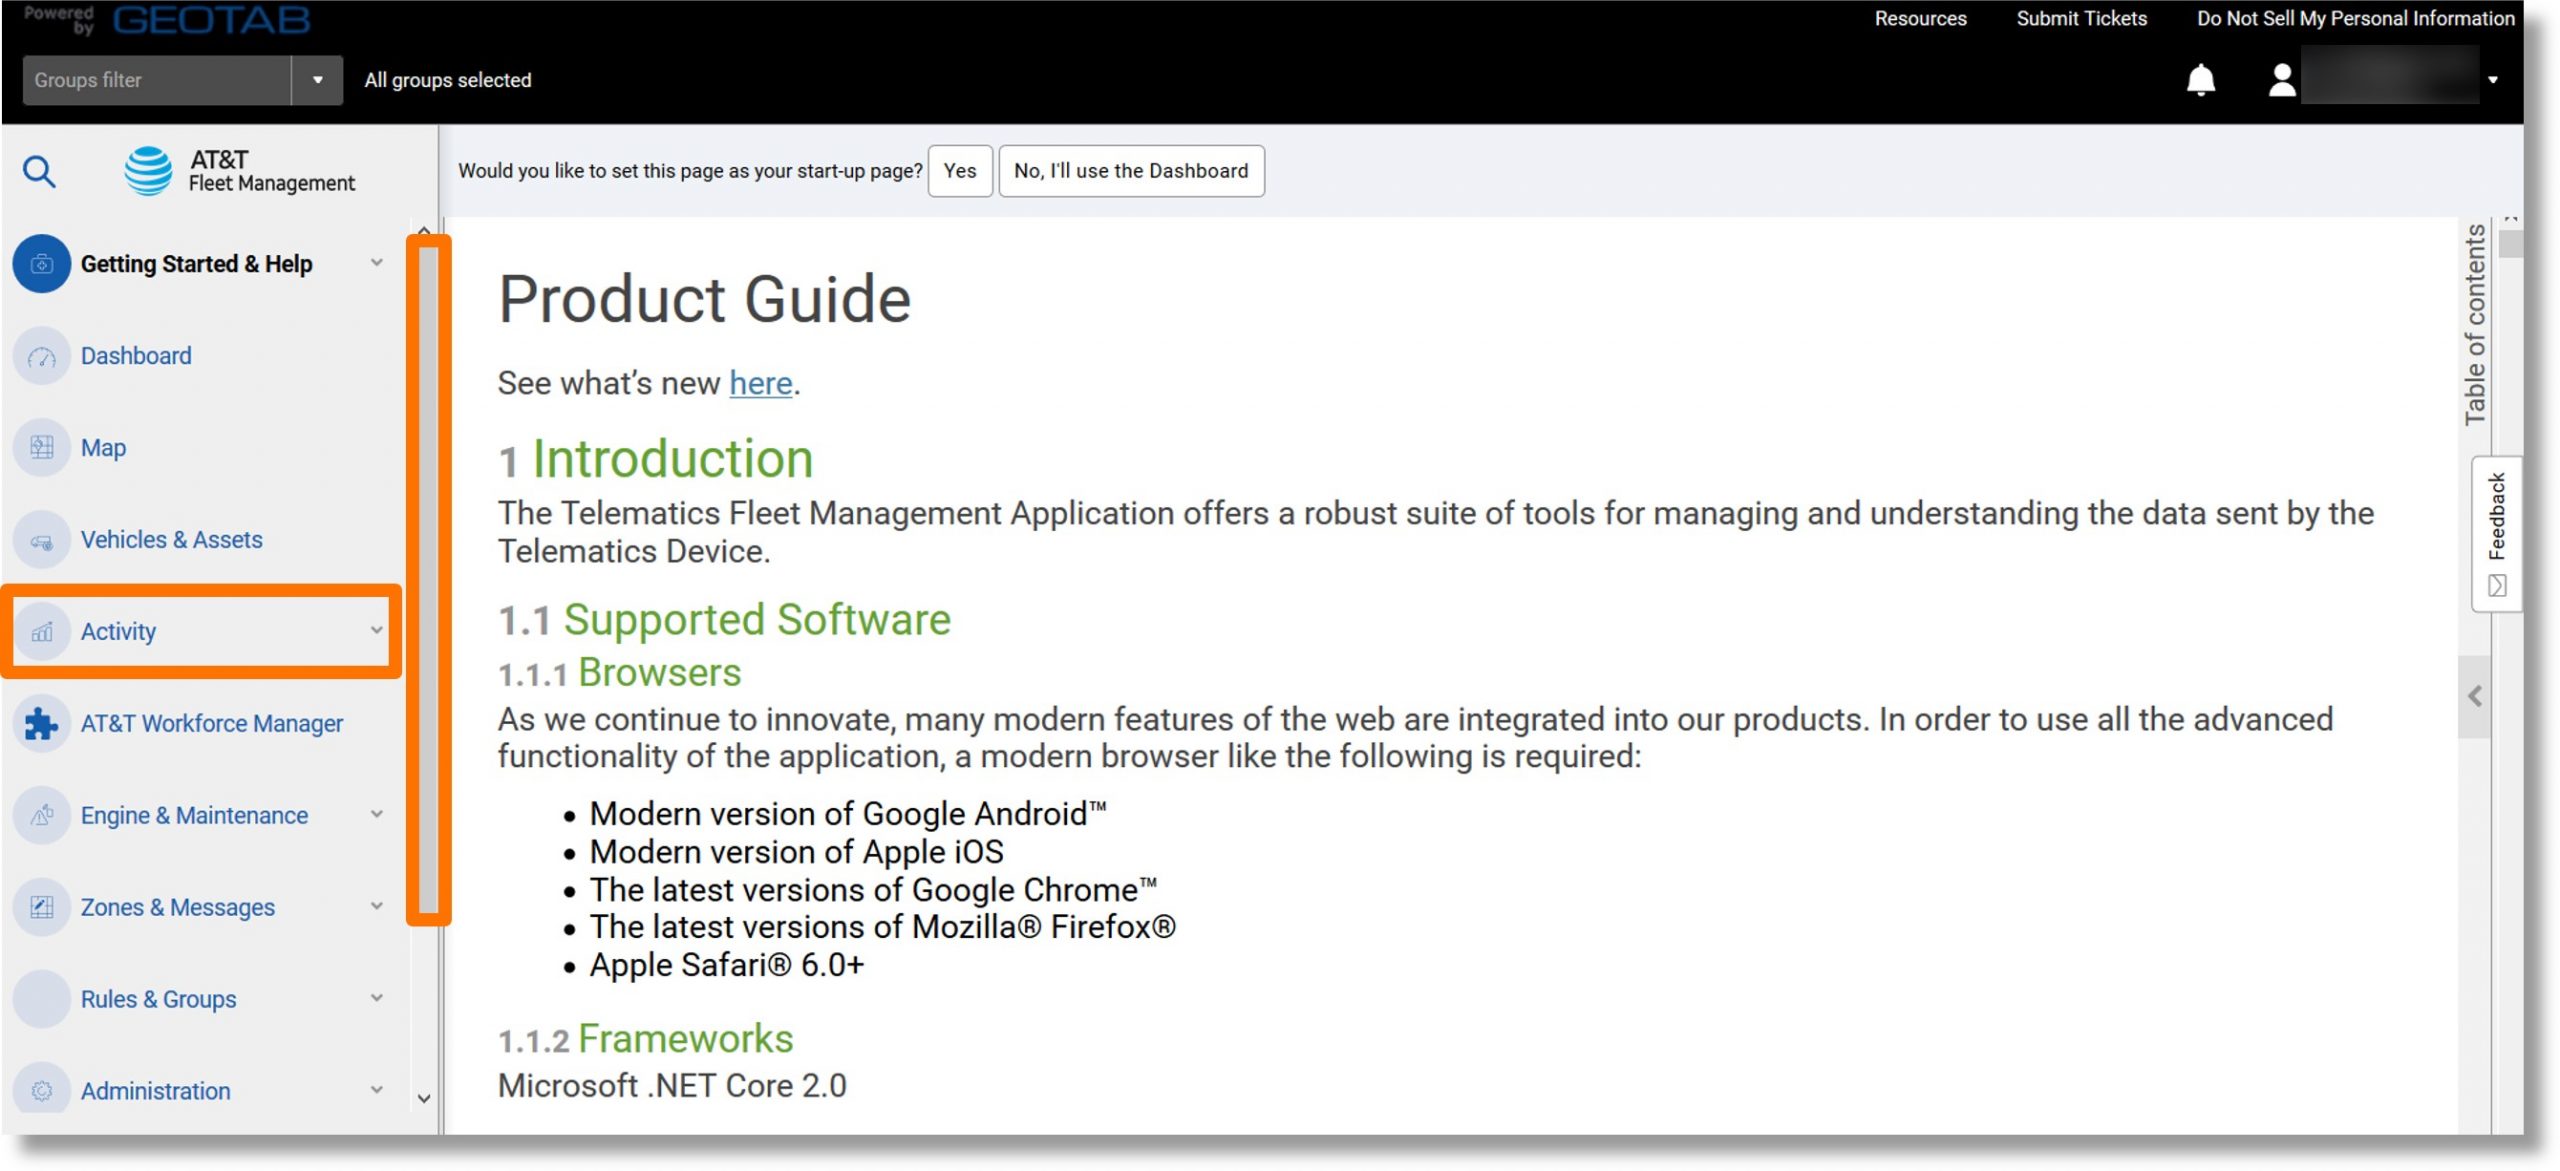
- Click on Activity in the column on the left and scroll down.
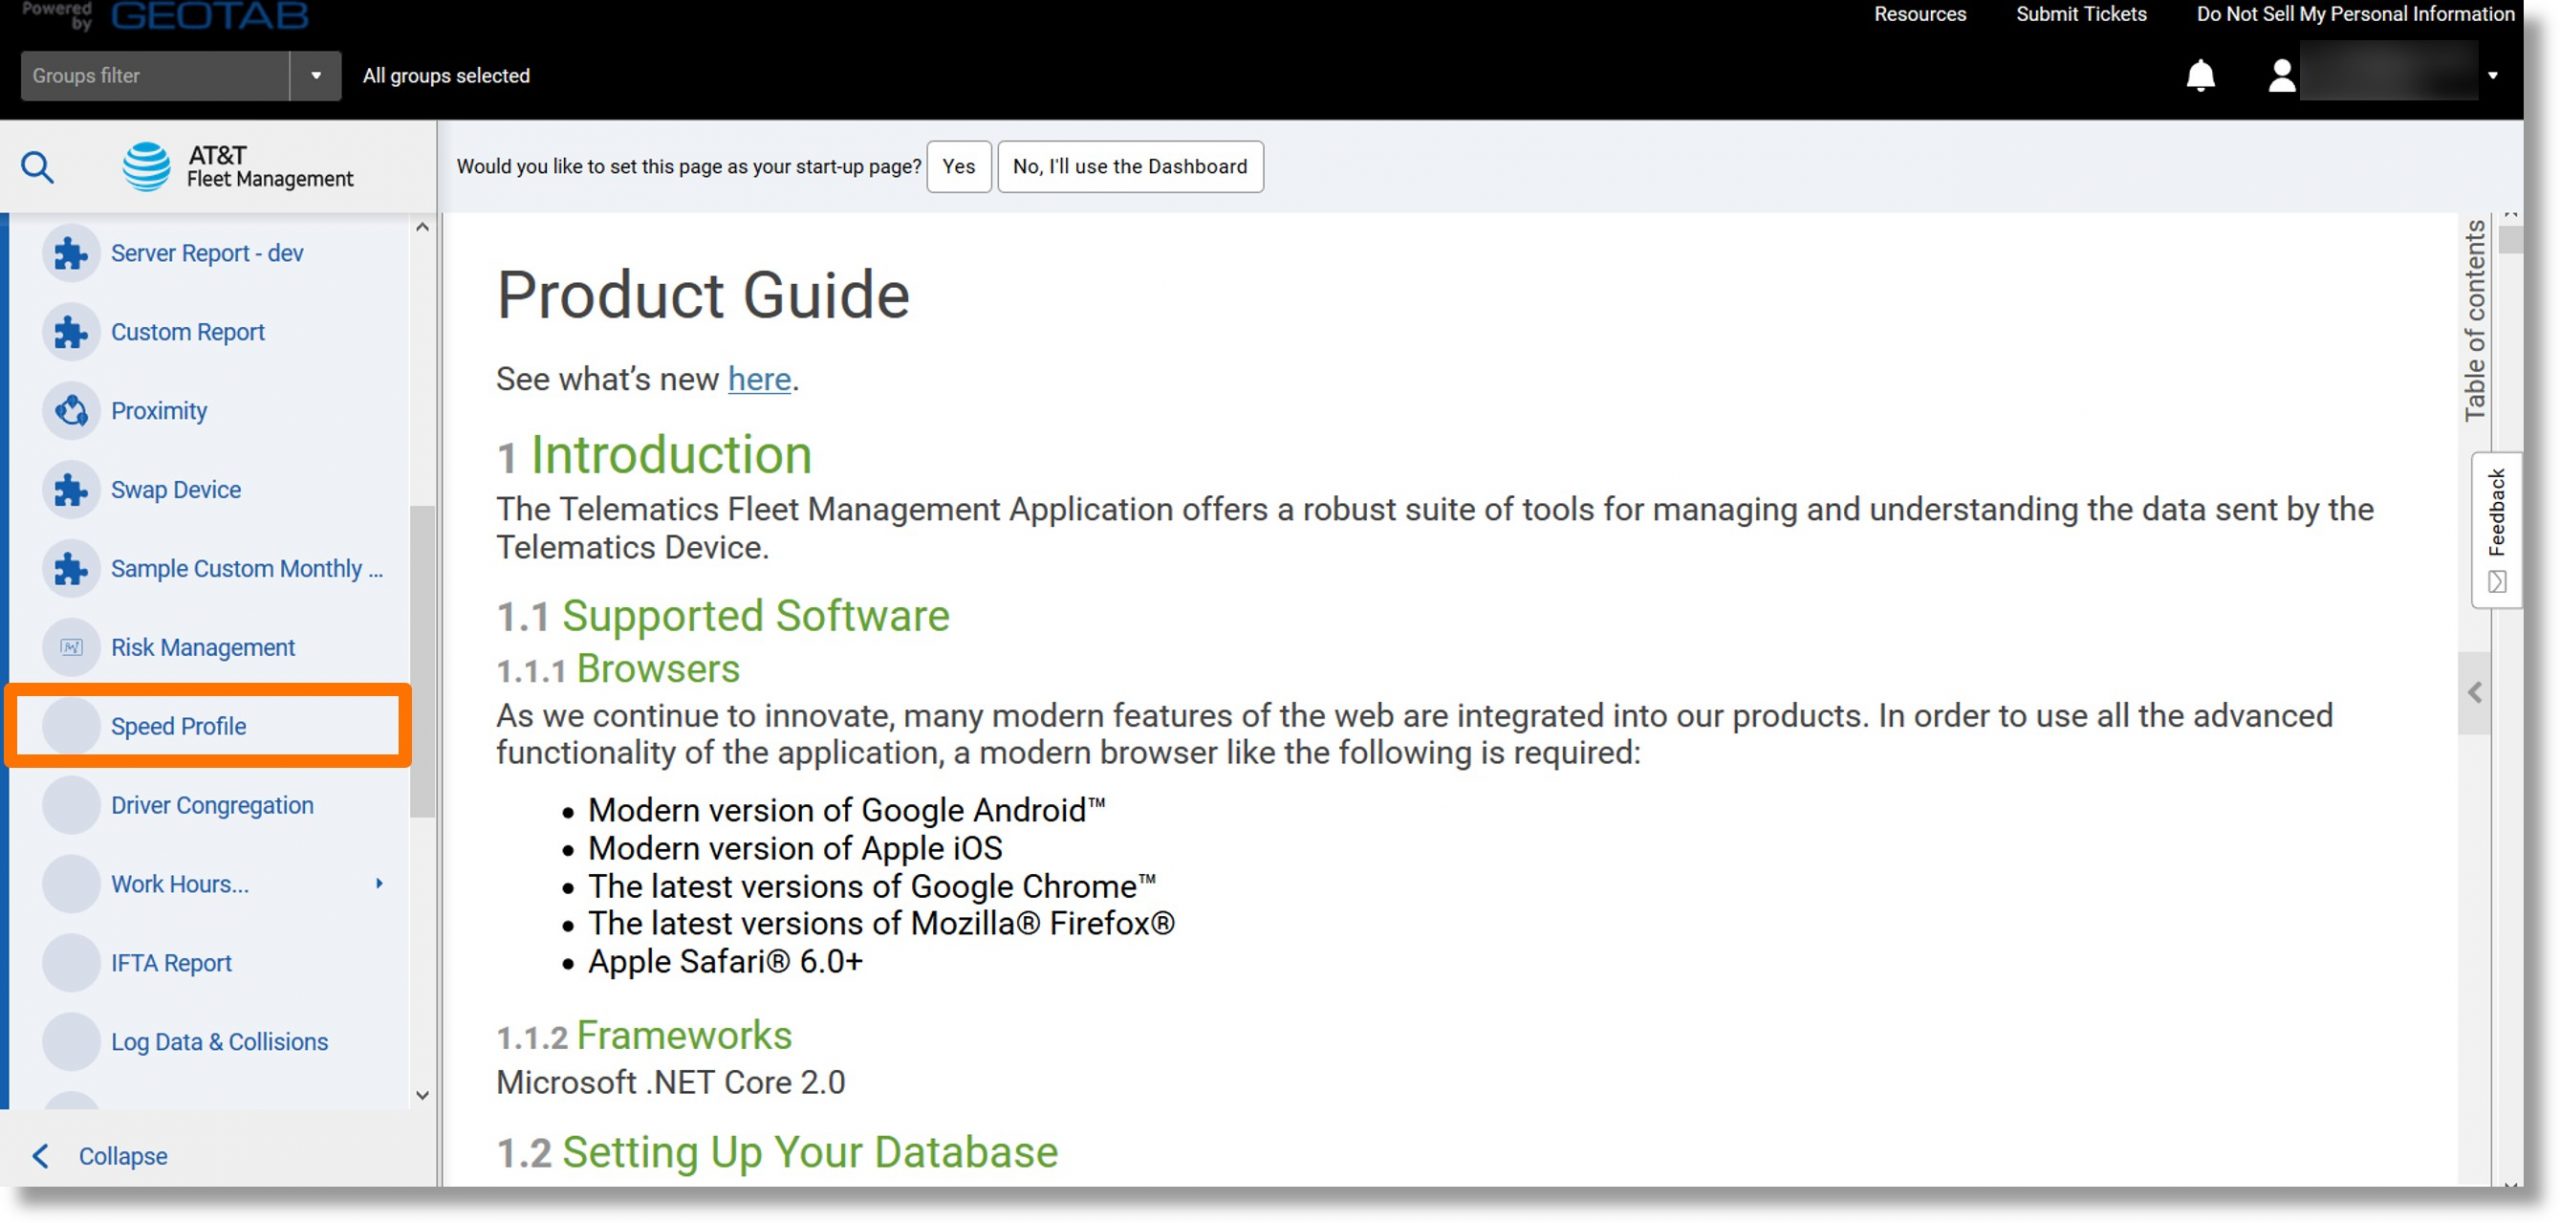
- Click Speed Profile.
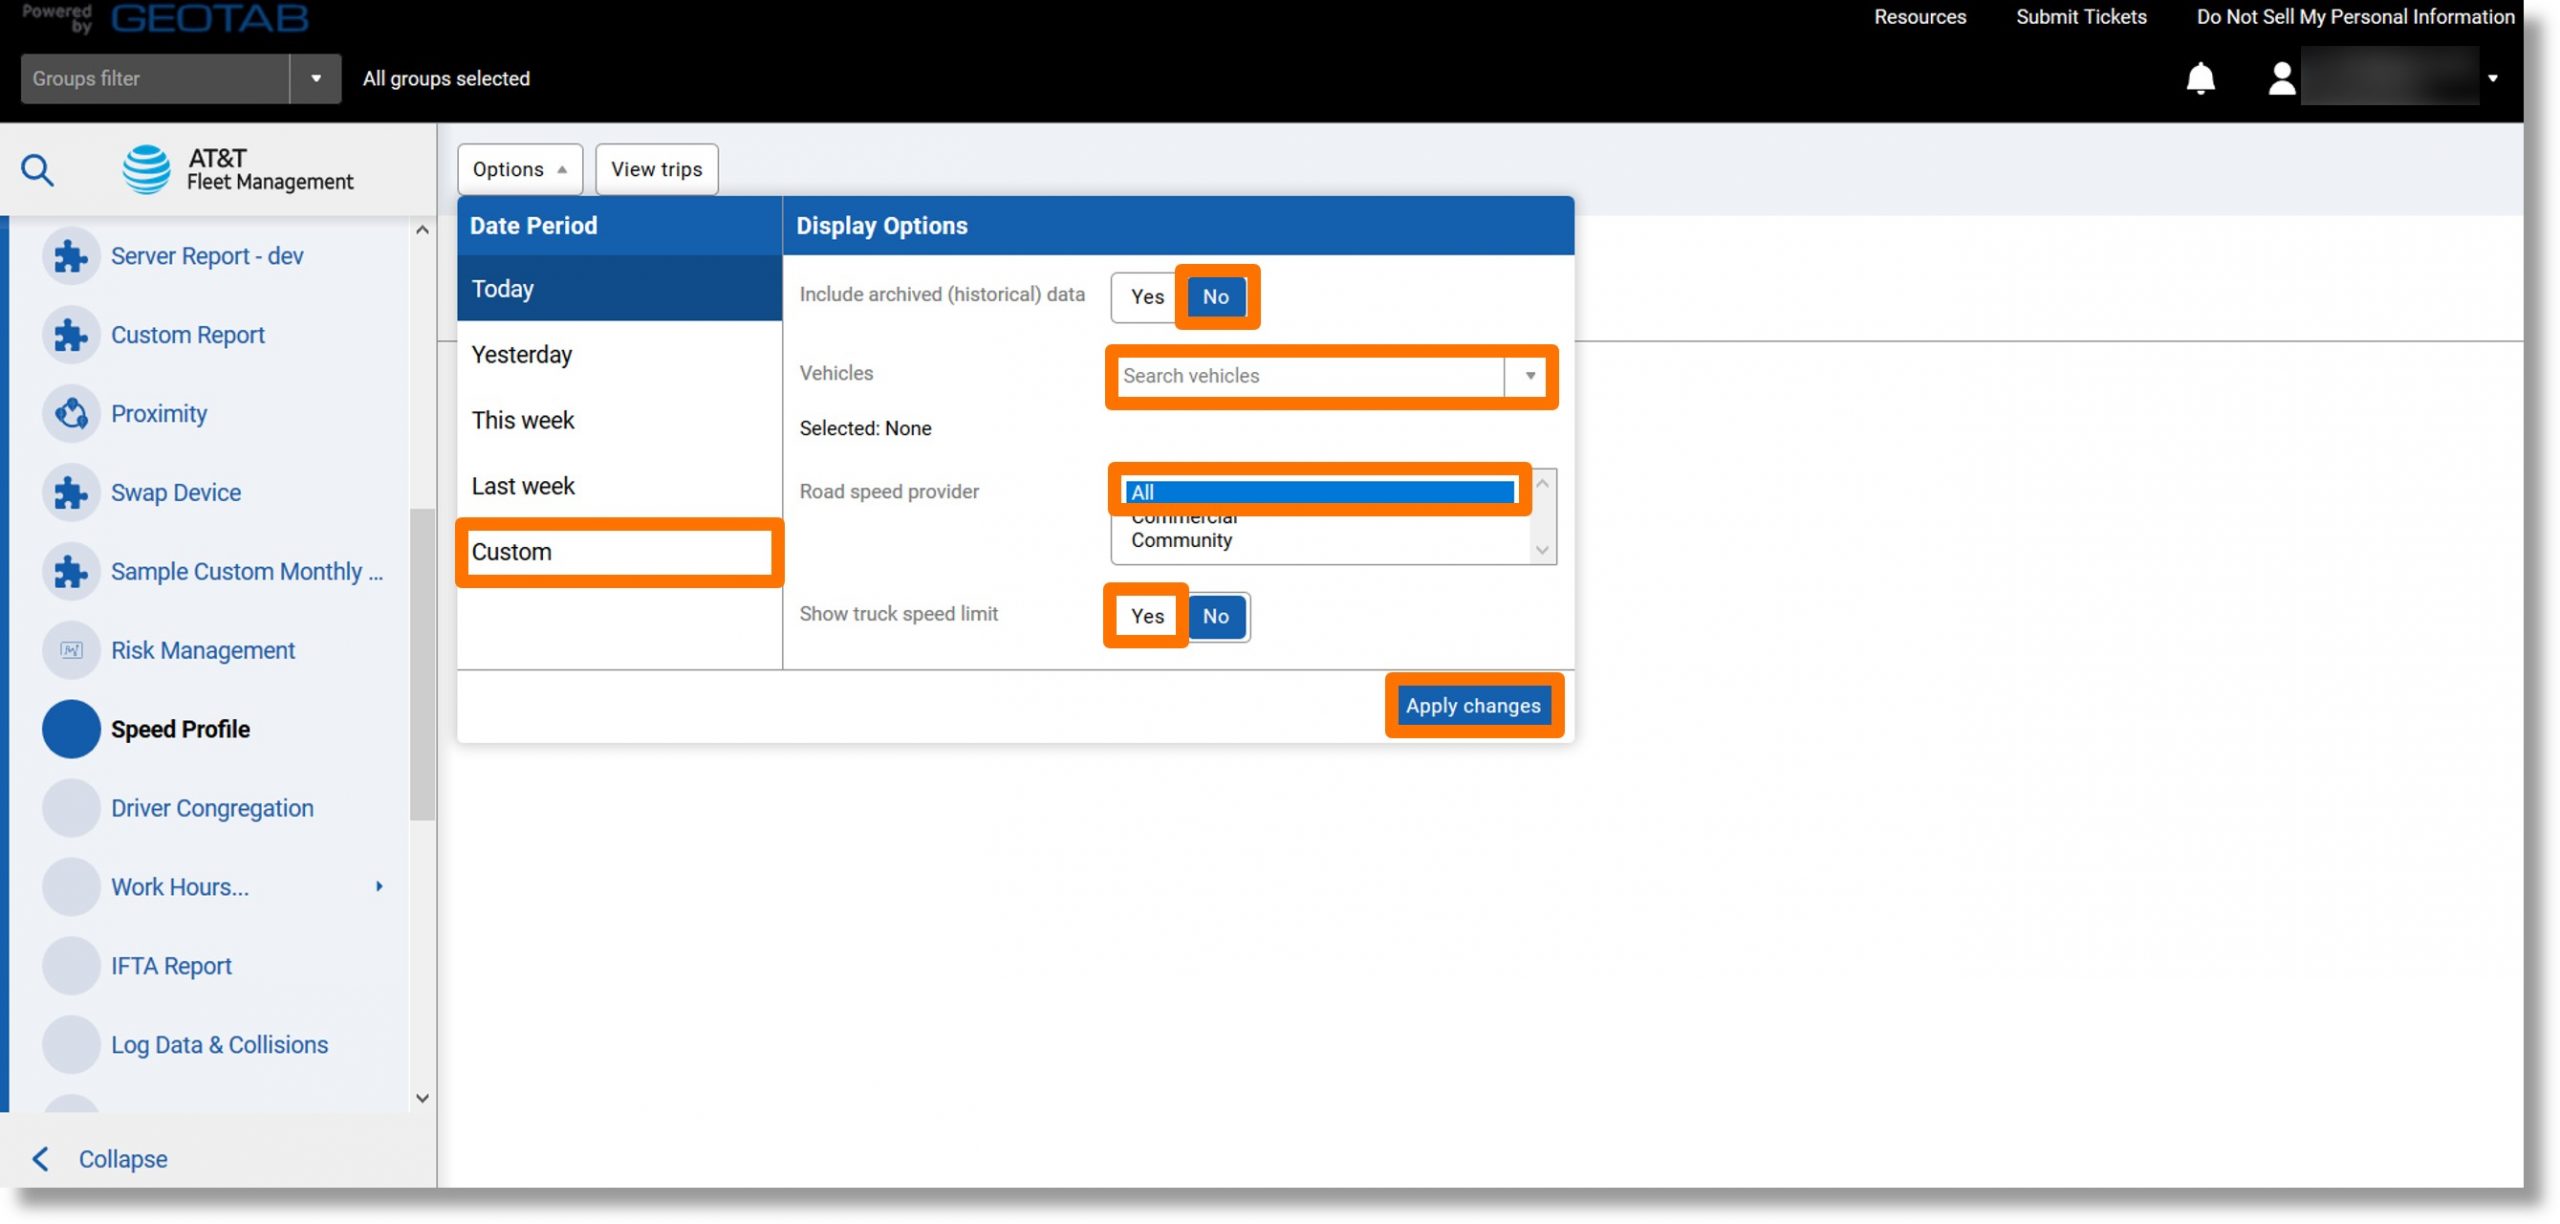
- Click on the “Options” dropdown displays.
- Click on the desired timeframe under “DATE PERIOD”.
Note: Custom allows you to set a specific date range.
- Click on either the Yes or No button to the right of “Include archived (historical) data”.
- Click the dropdown arrow to the right of “Search Vehicles” and select the desired vehicle(s).
- Click the desired option to the right of “Road speed provider”.
- Click on either the Yes or No button to the right of “Show truck speed limit”.
- Click the Apply changes button.
- The speed profile displays.
Top
Engine Faults Summary Report
Use: Quick view of the total number of faults triggered for each vehicle
Information included: Date and time of the last fault and the total number of faults. In list view clicking the line displays all of the faults in chronological order.
Additional Information when exported: Device group etc.
Accessing the report:
- Click on Engine & Maintenance on the left and then scroll down.
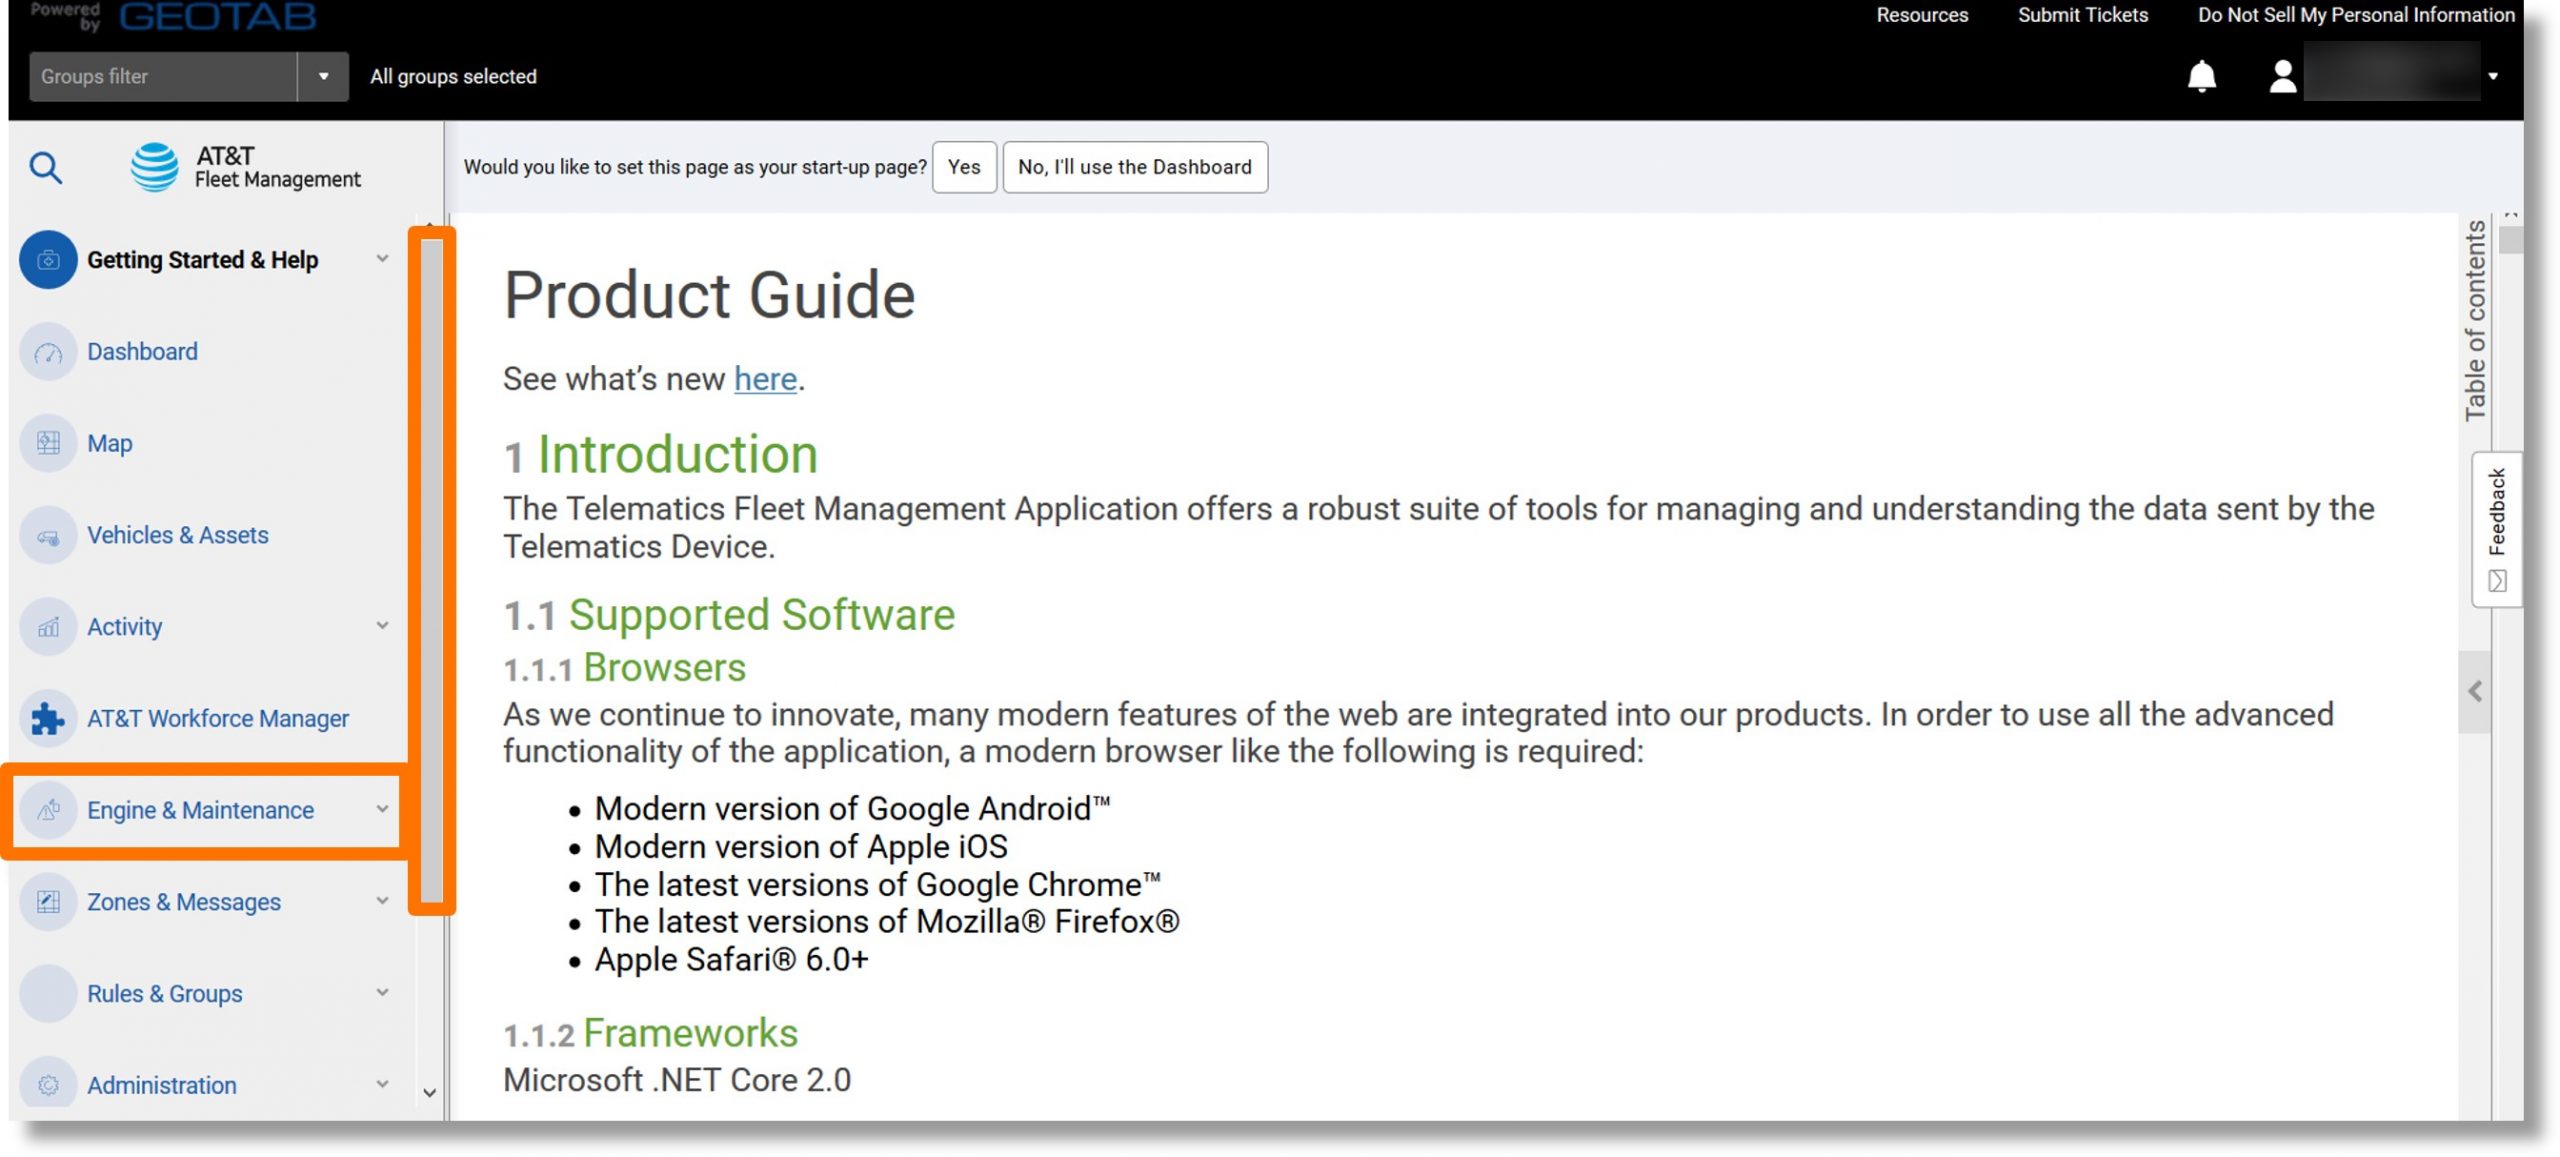
- Click on Engine and Device….
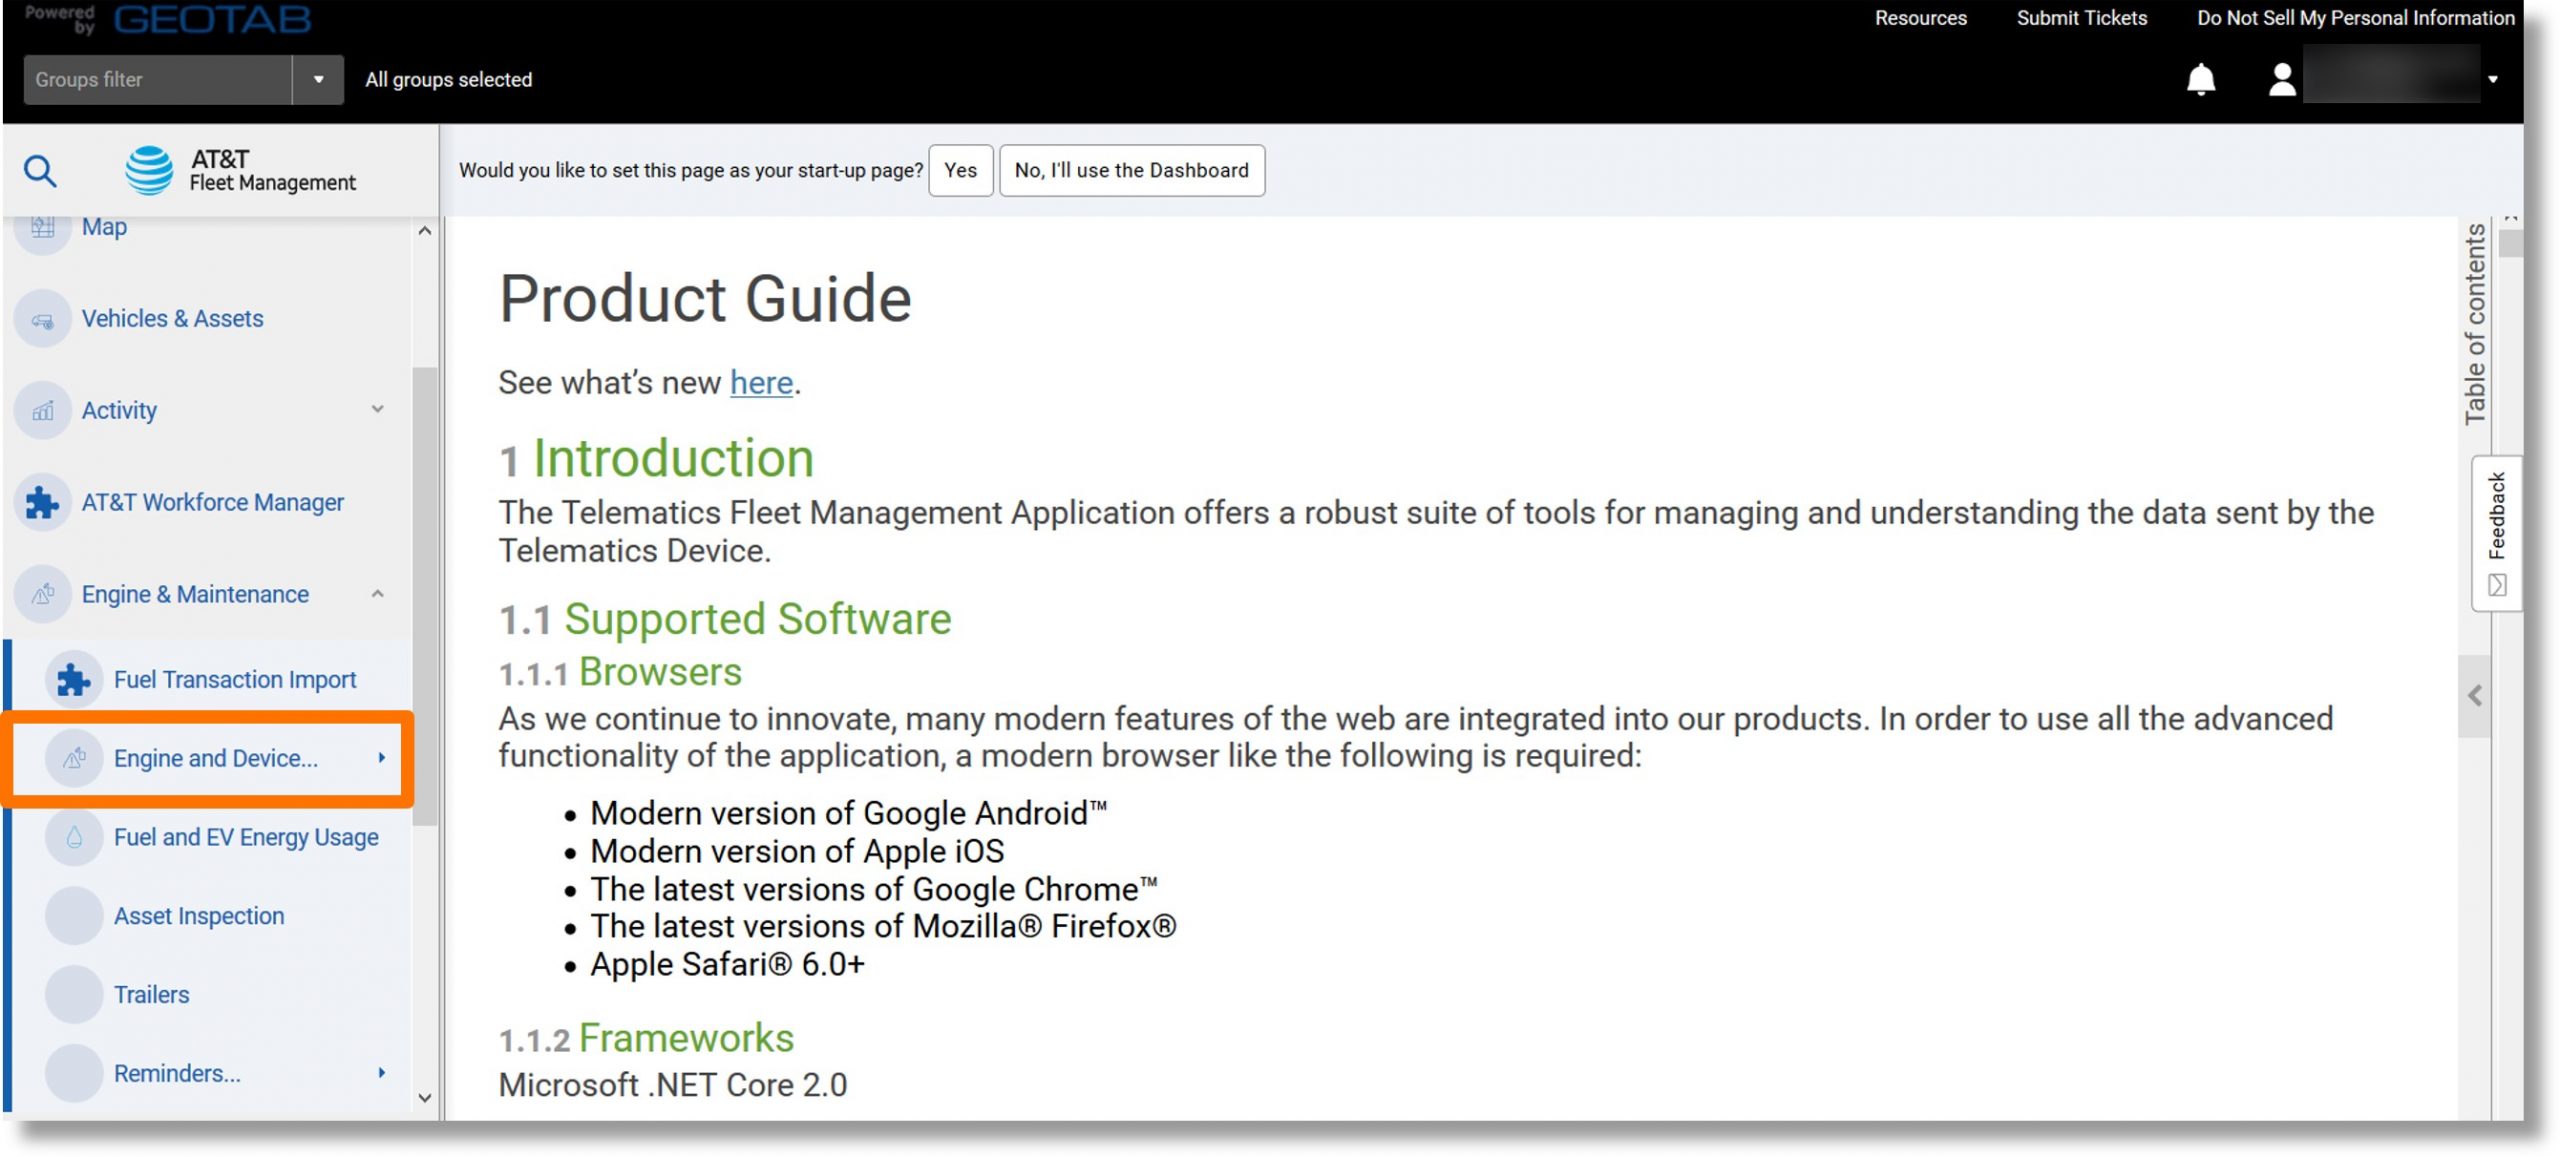
- Click on Faults.
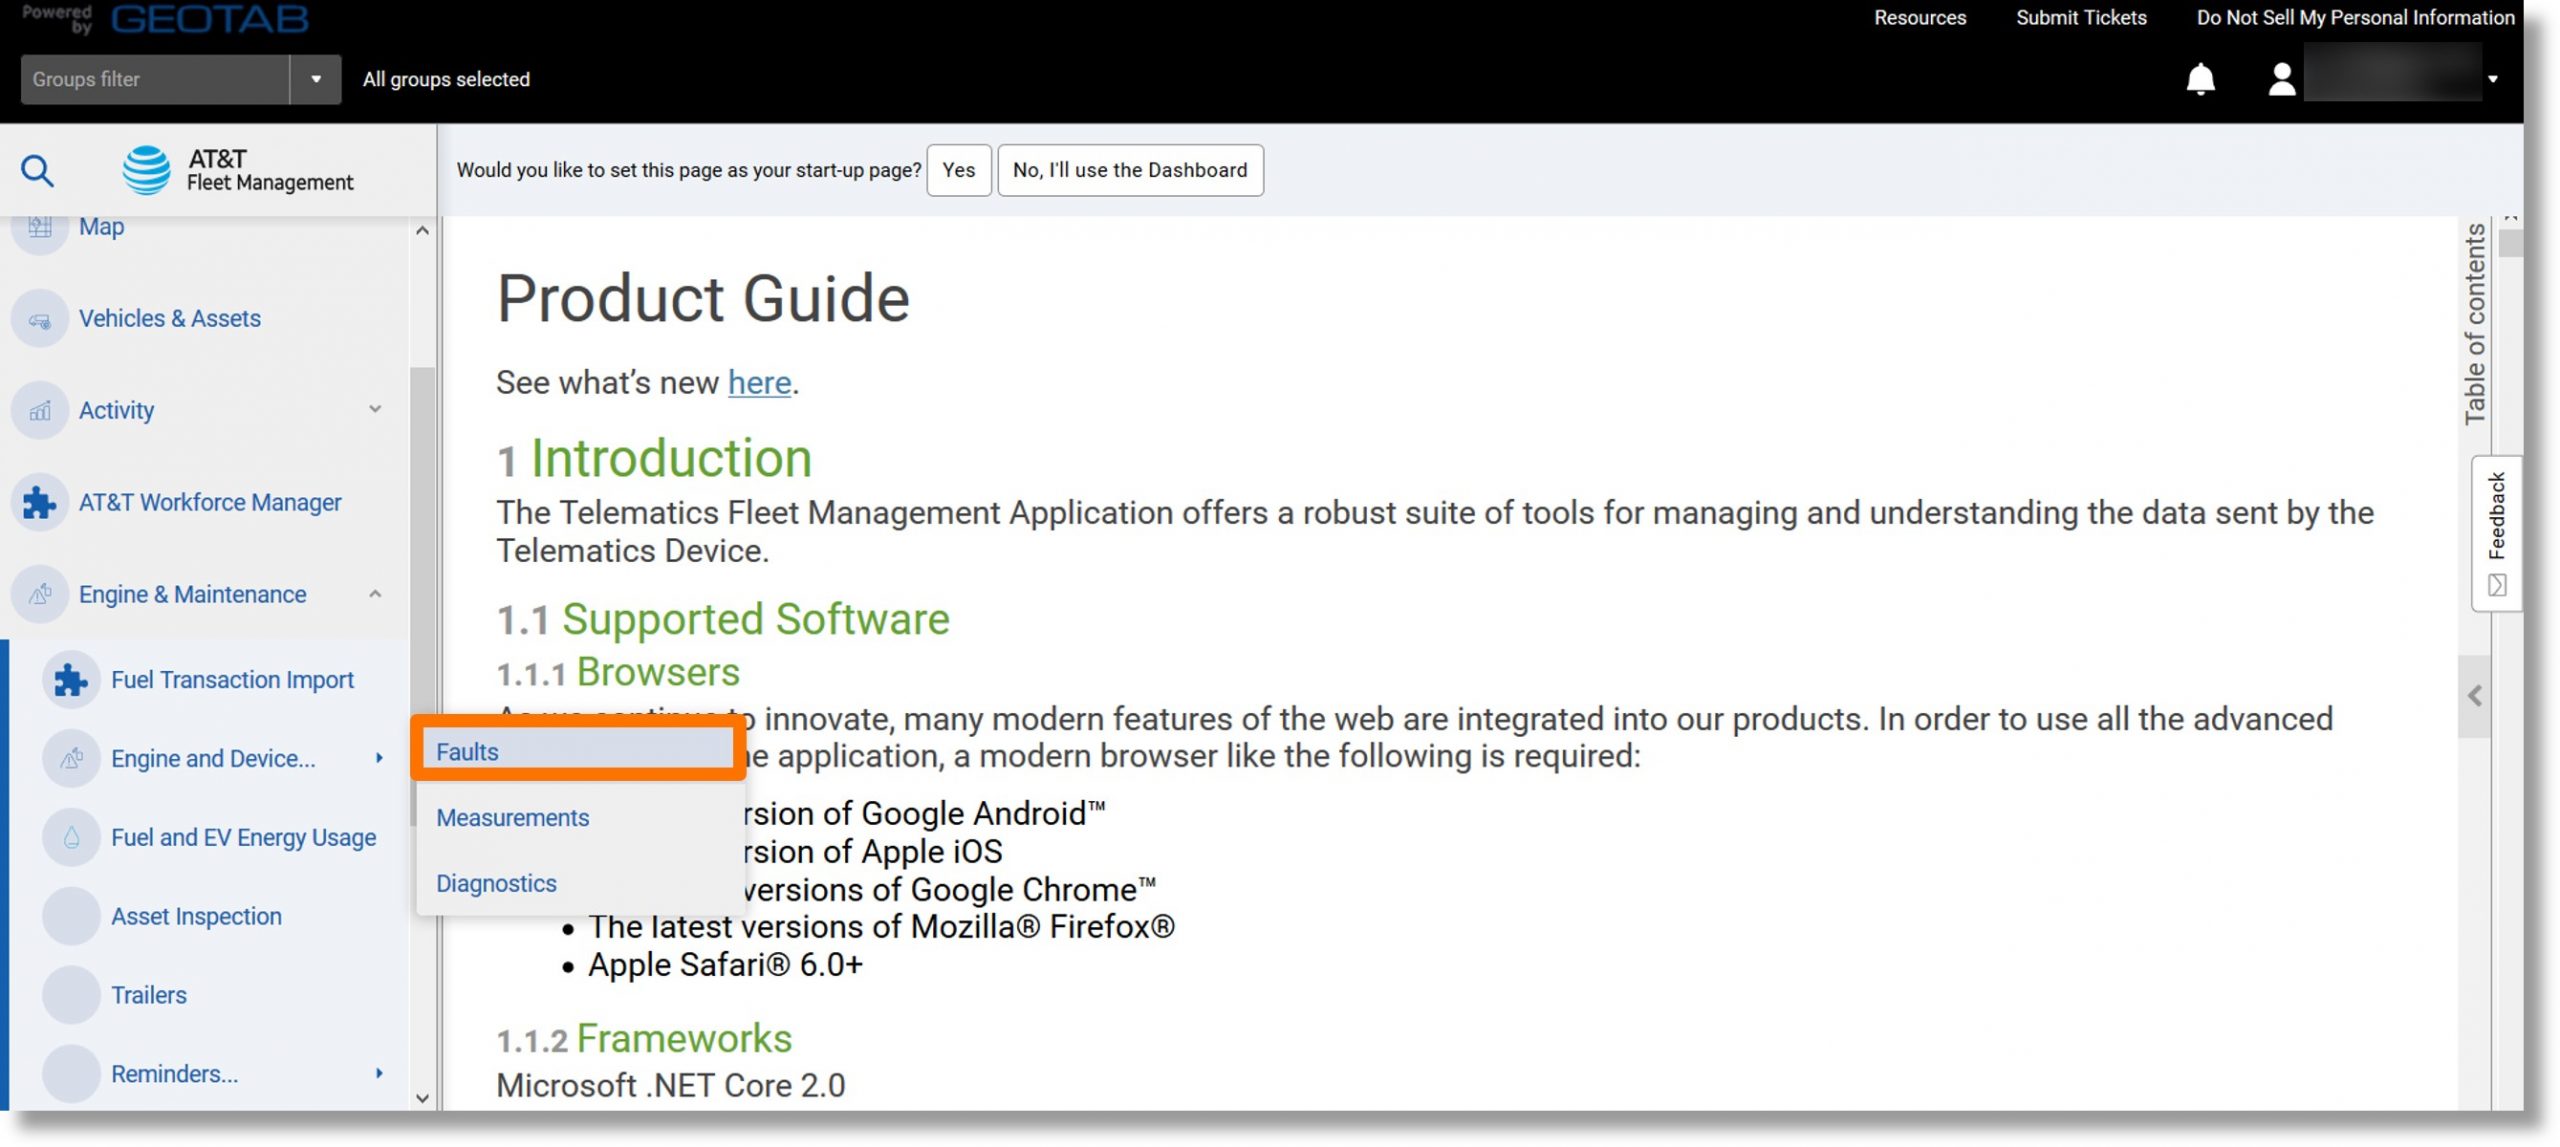
- Select the desired parameters and click on the Apply changes button.
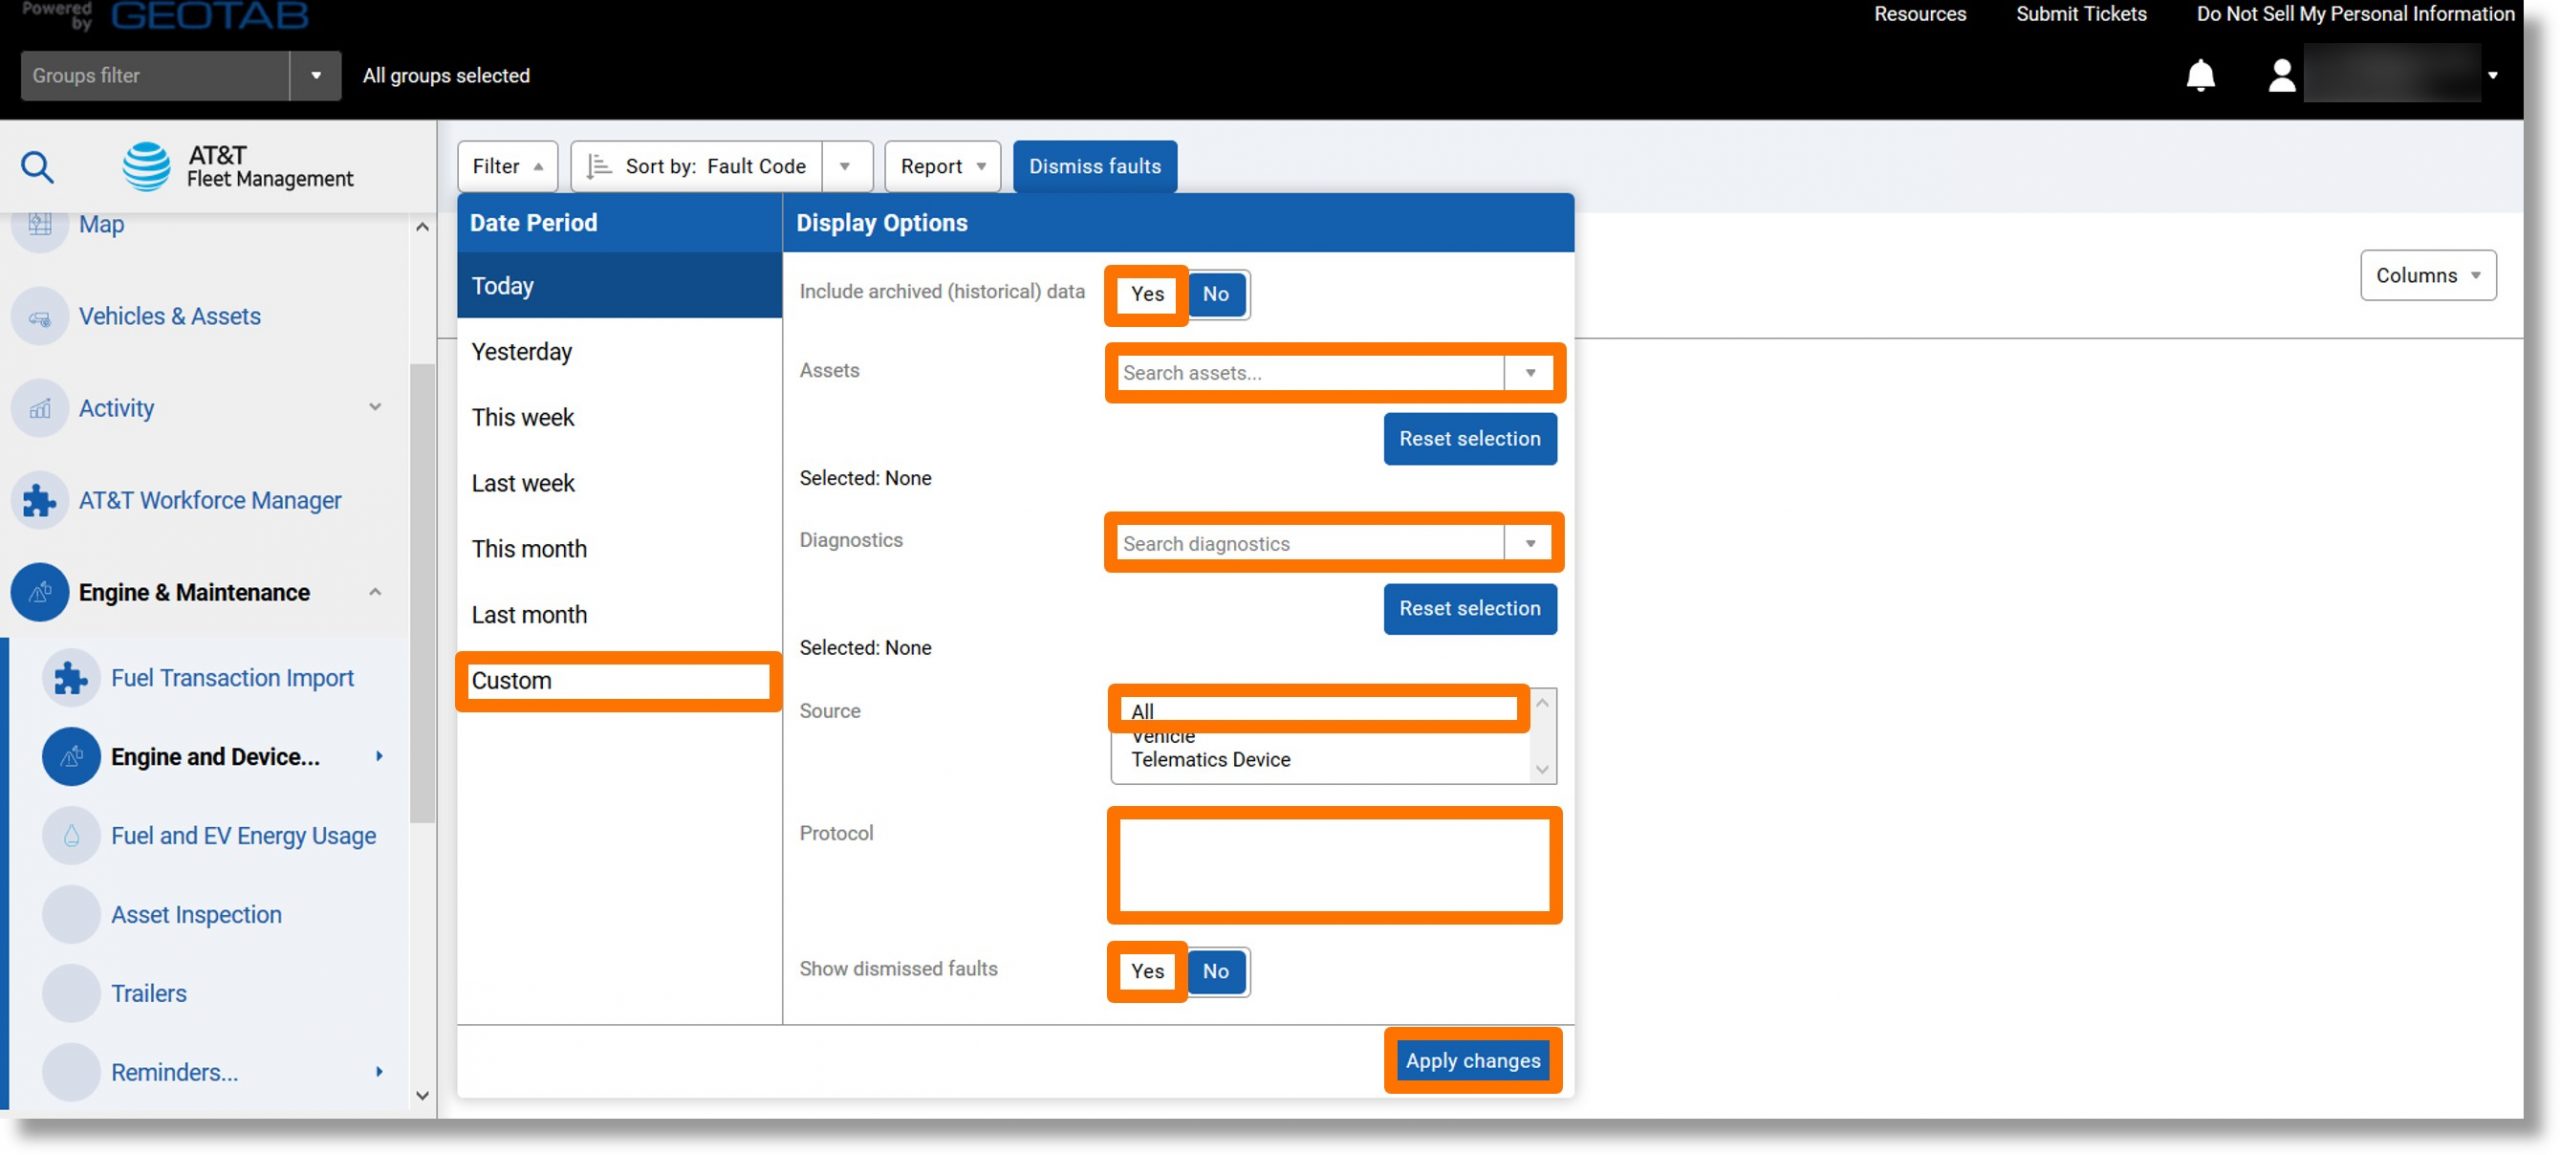
- Click on the Report dropdown.
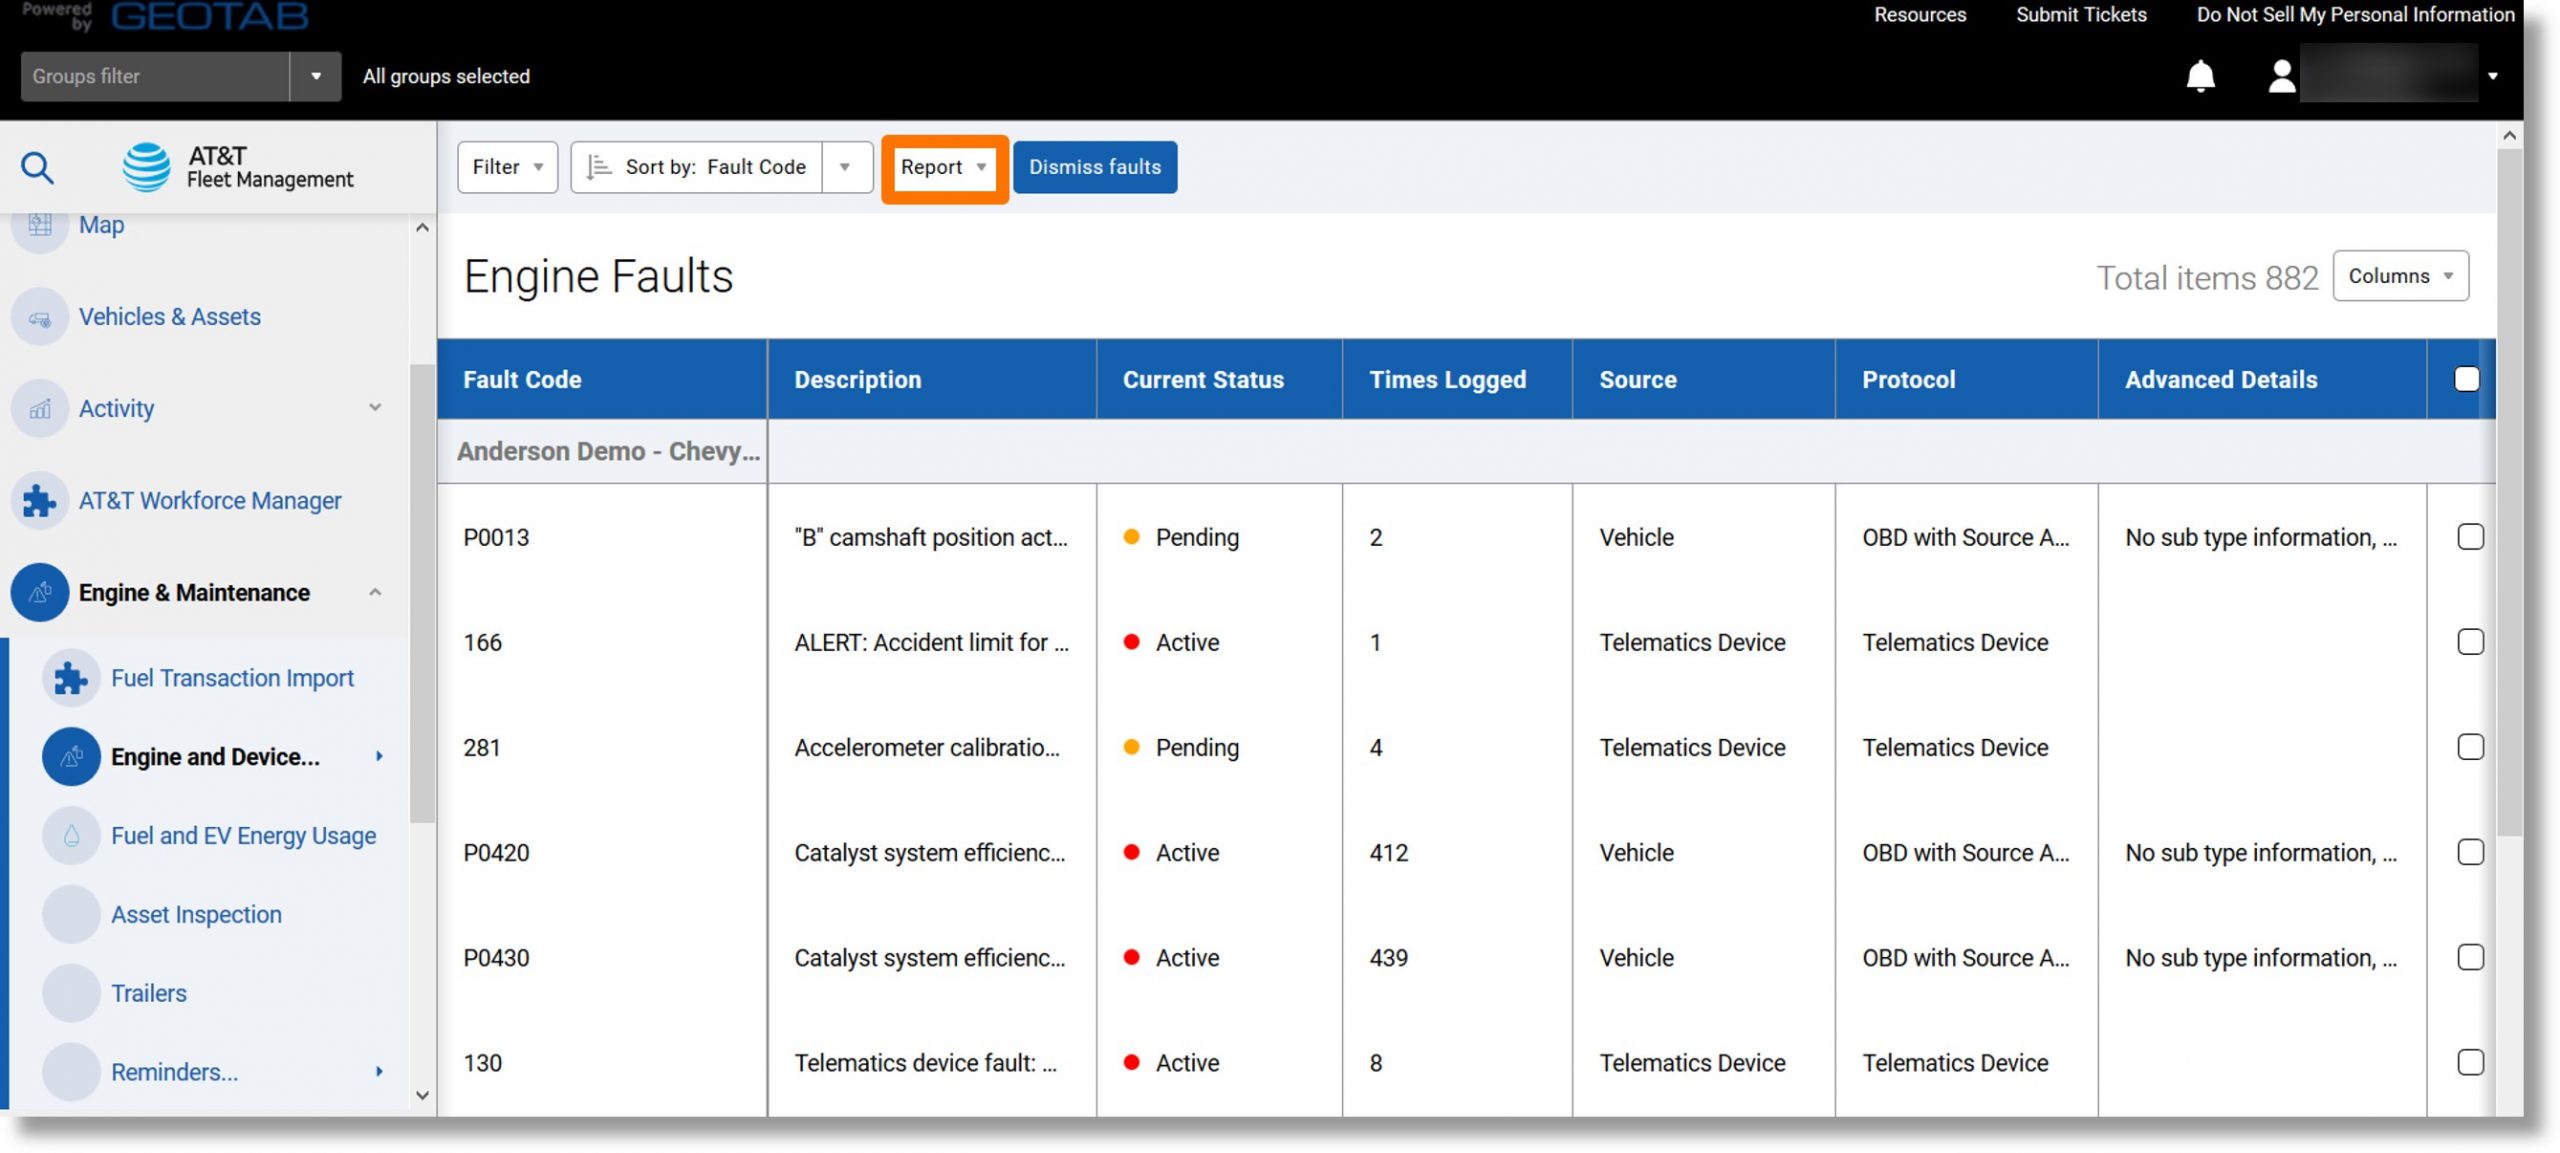
- Click on Summary and then click on the ellipsis icon
 to the right of either “Standard” or “Advanced”.
- Click on View in browser.
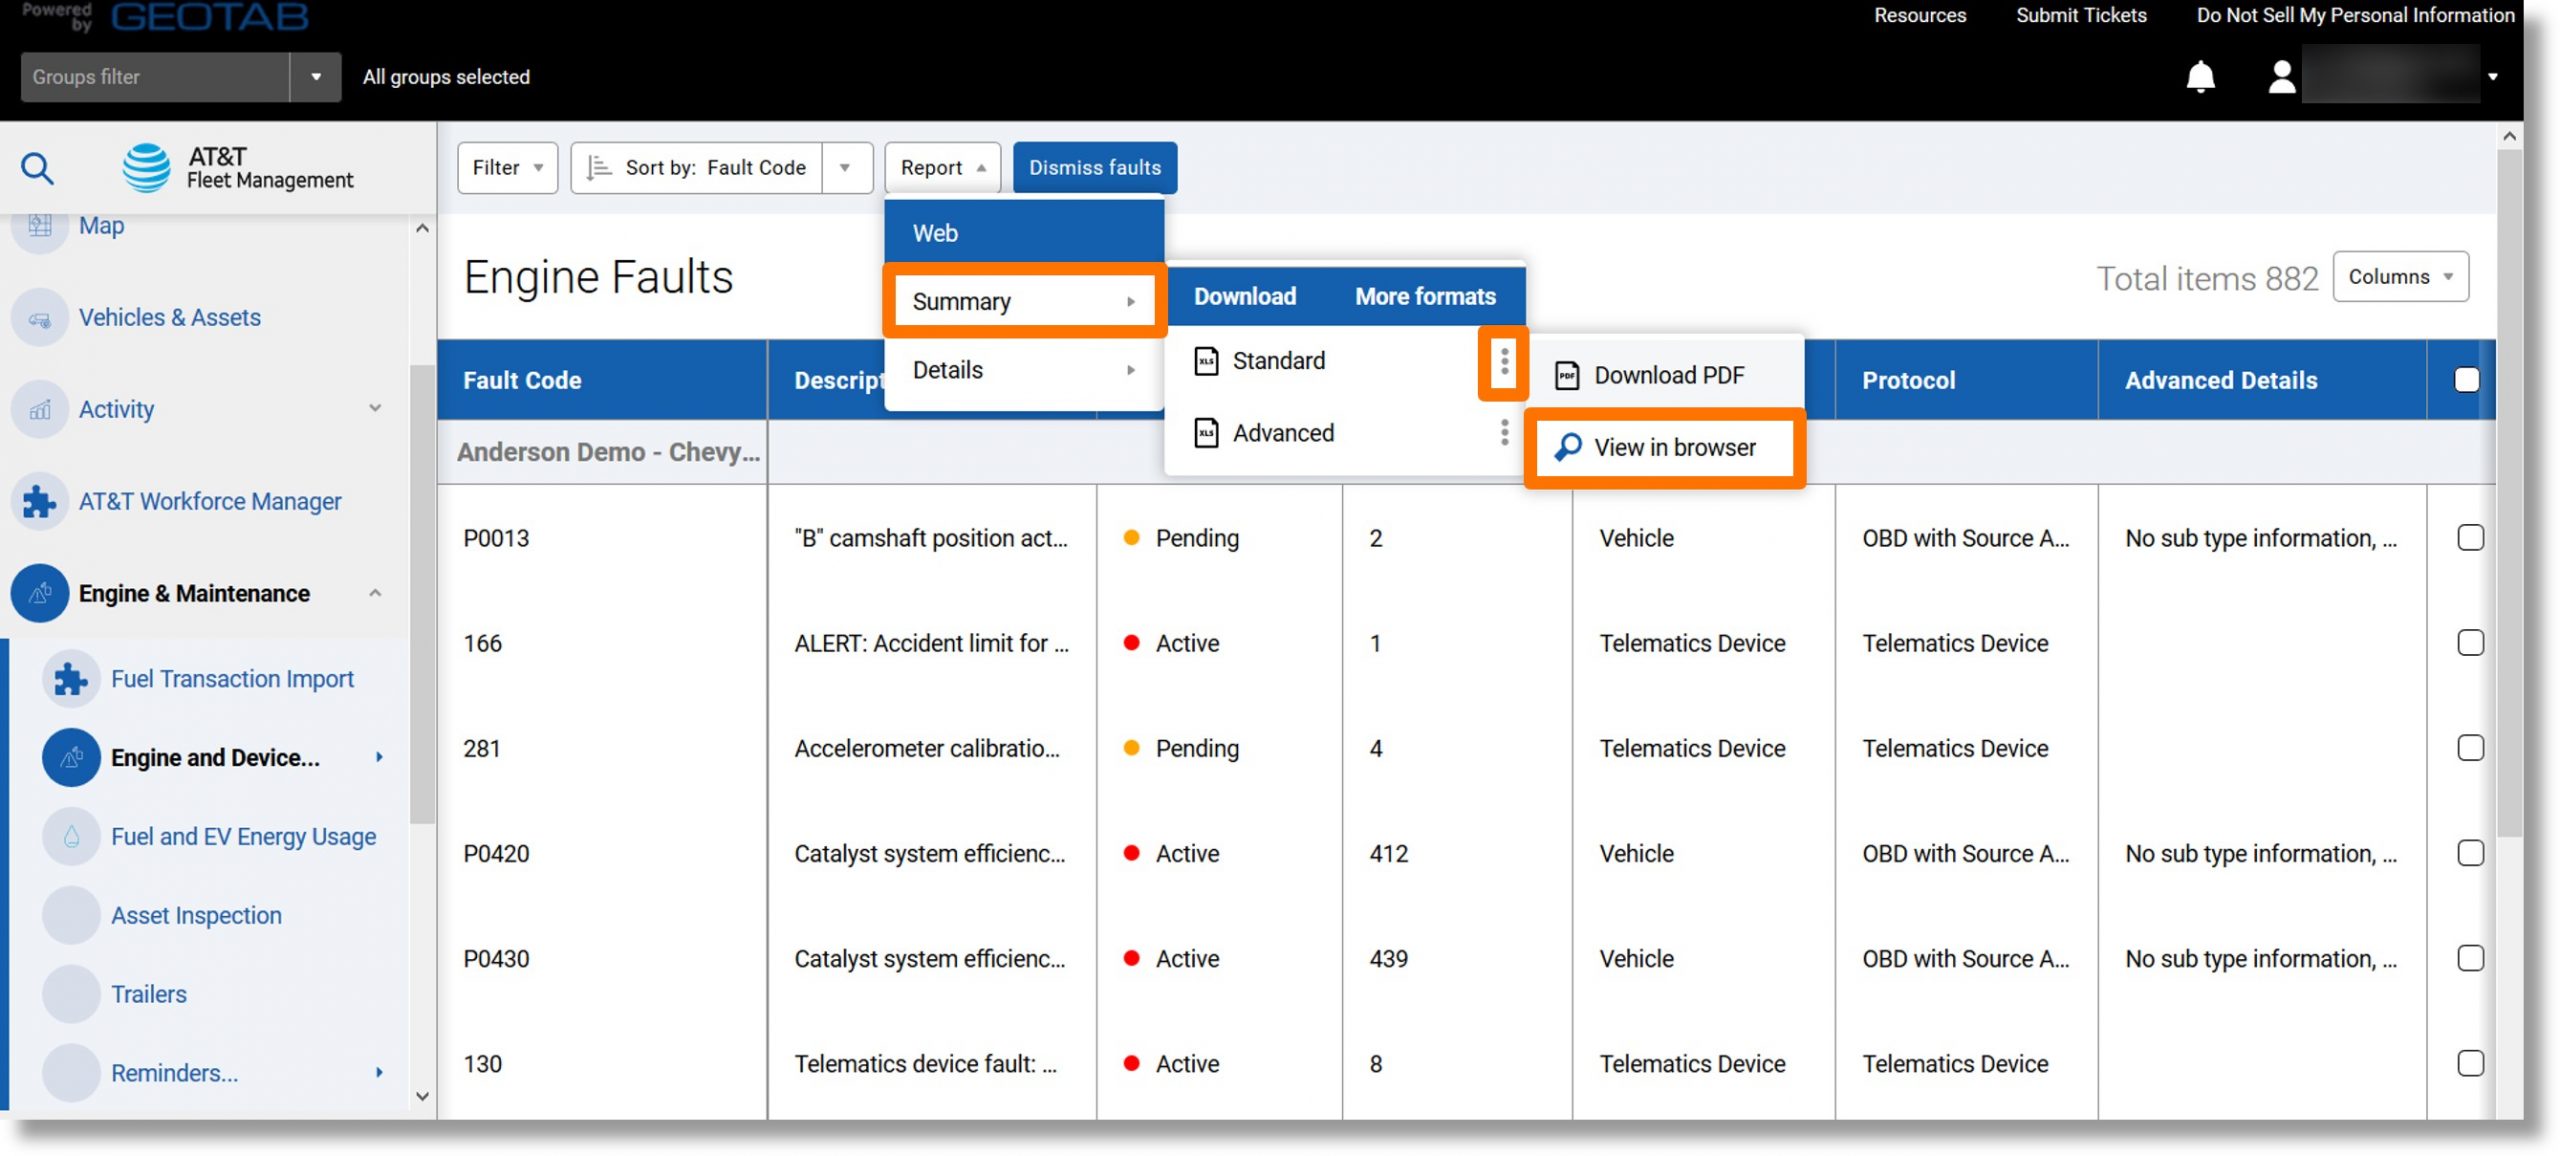
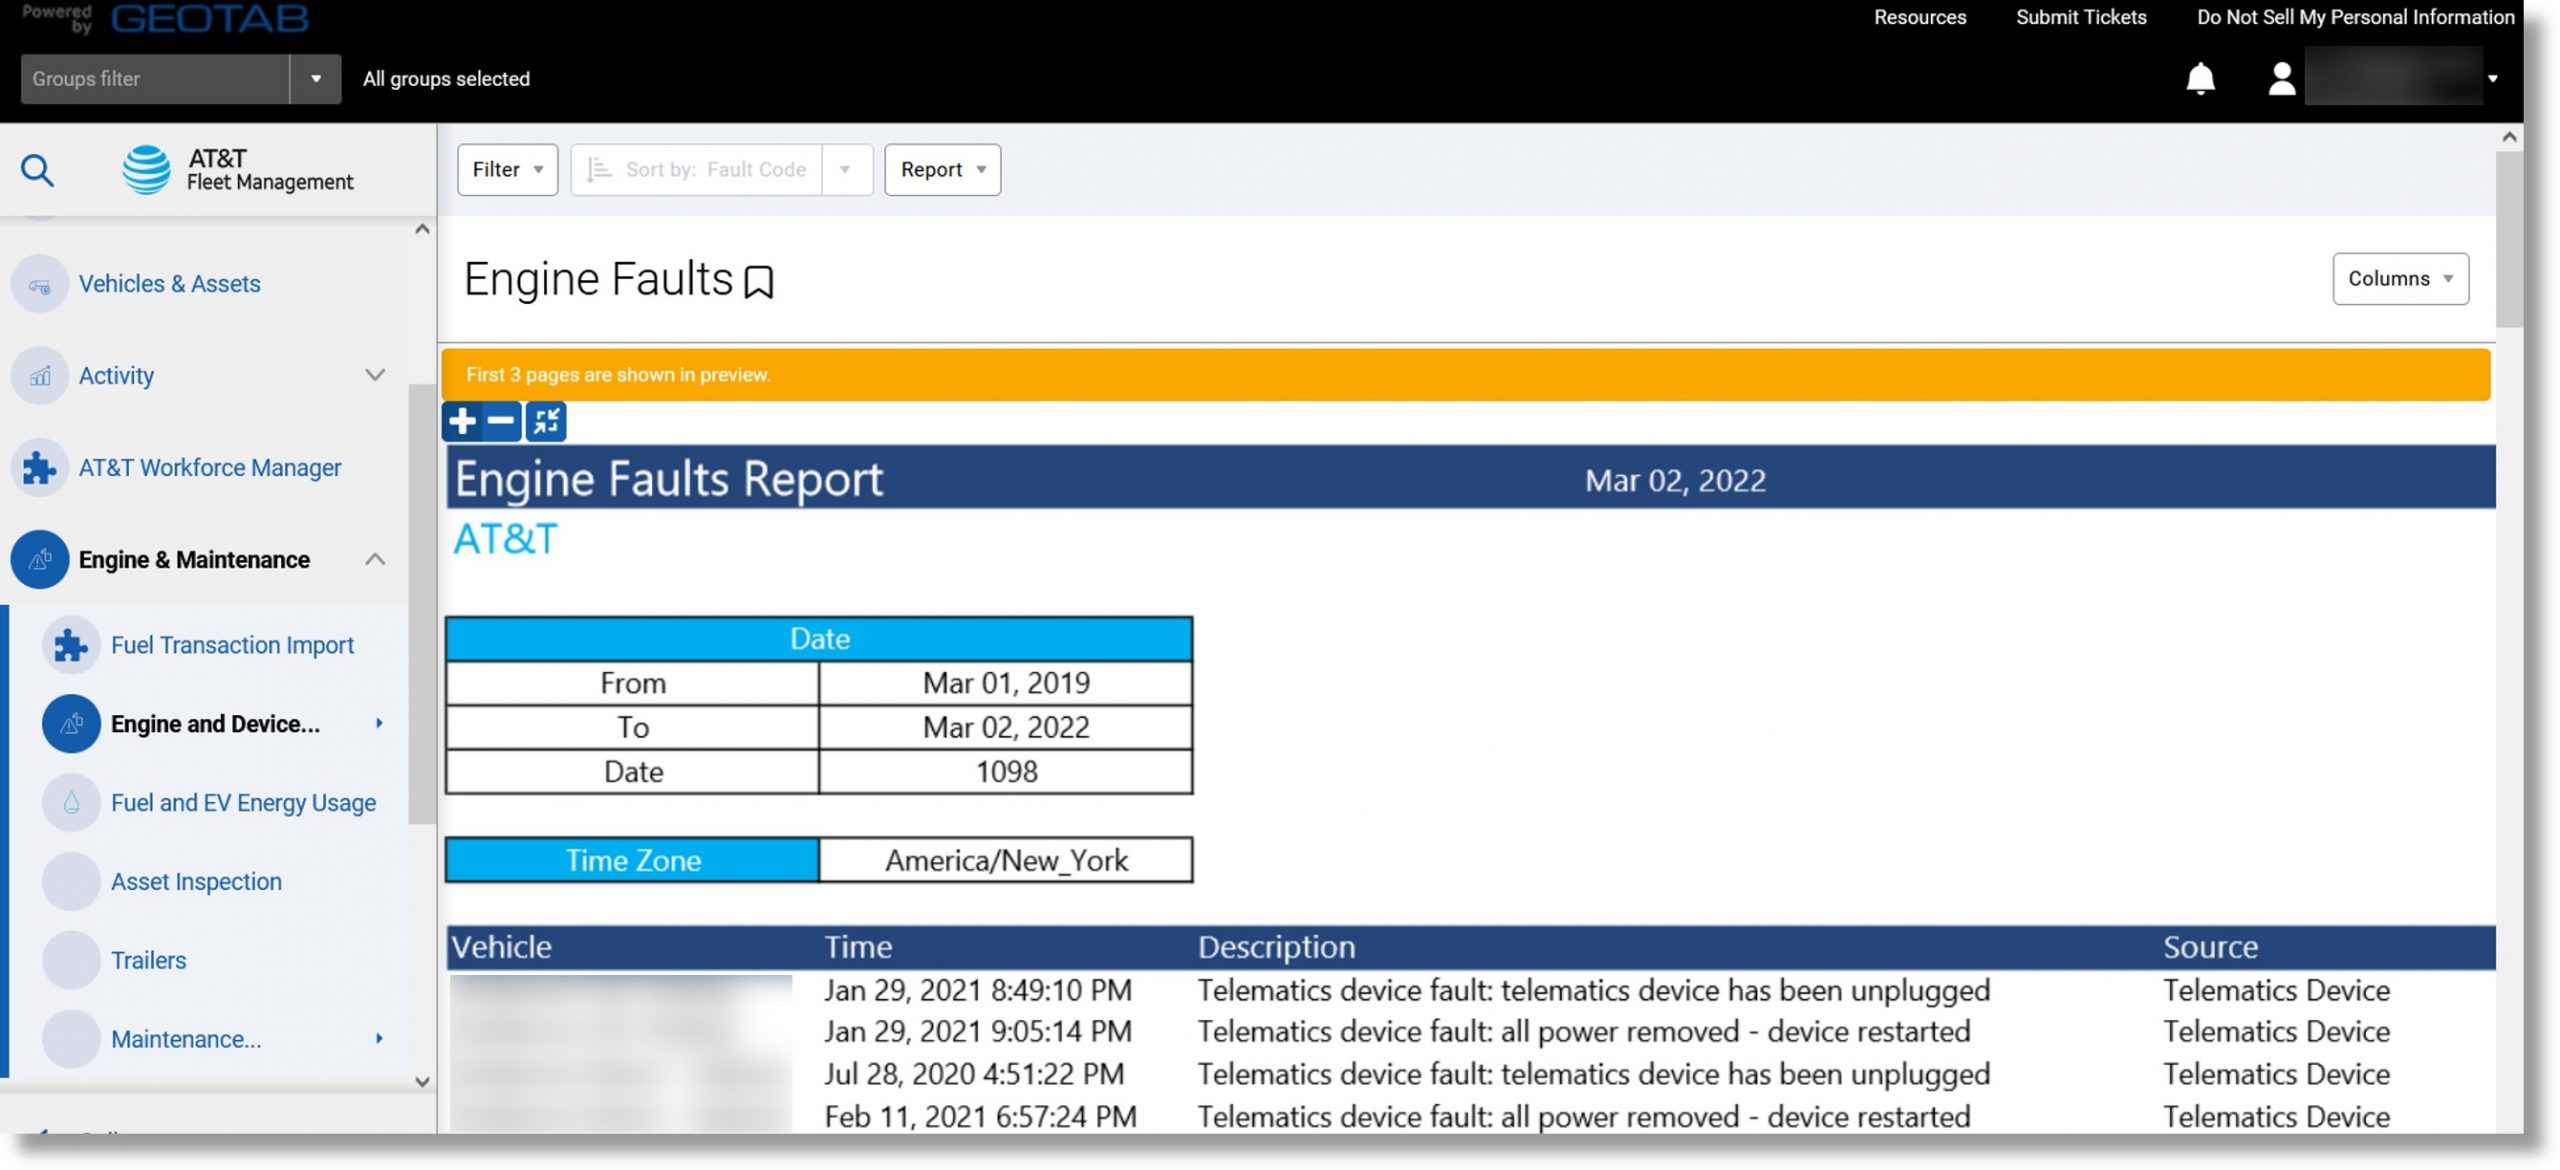
- The Engine Faults report displays.
Top
Engine Faults Details Report
Use: Displays the fault details triggered either by the device or the engine. This report can assist in prioritizing vehicle repairs.
Information included: Date and time the fault was triggered, fault description, the source, controller, and diagnostic code.
Additional Information when exported: Device group, fault state, etc.
Accessing the report:
- Click on Engine & Maintenance on the left and then scroll down.
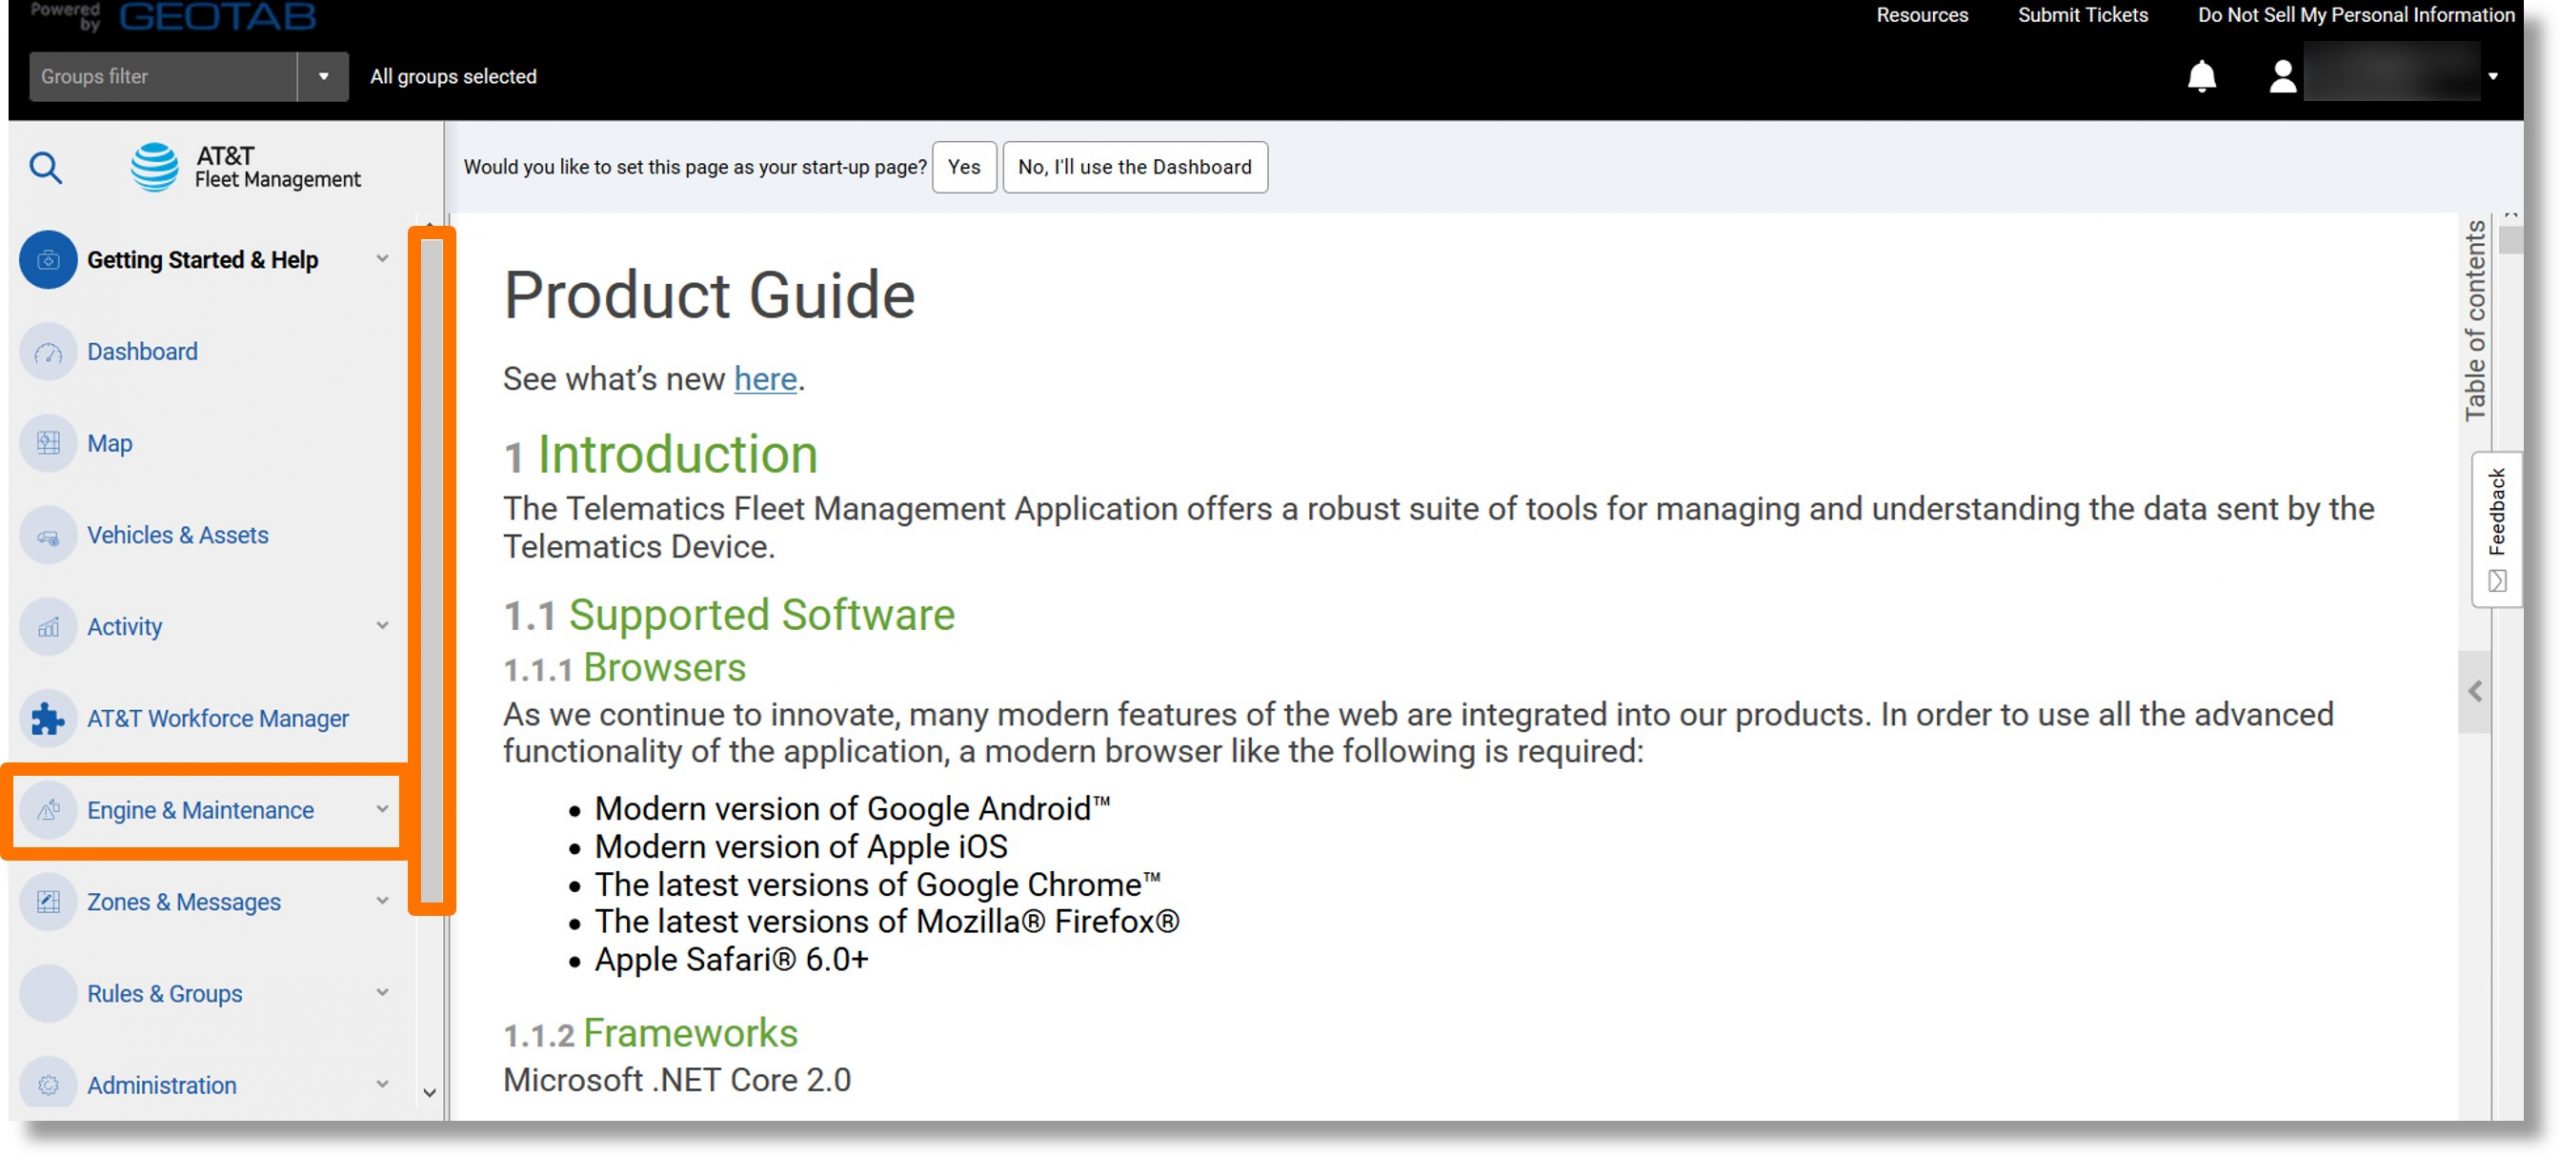
- Click on Engine and Device….
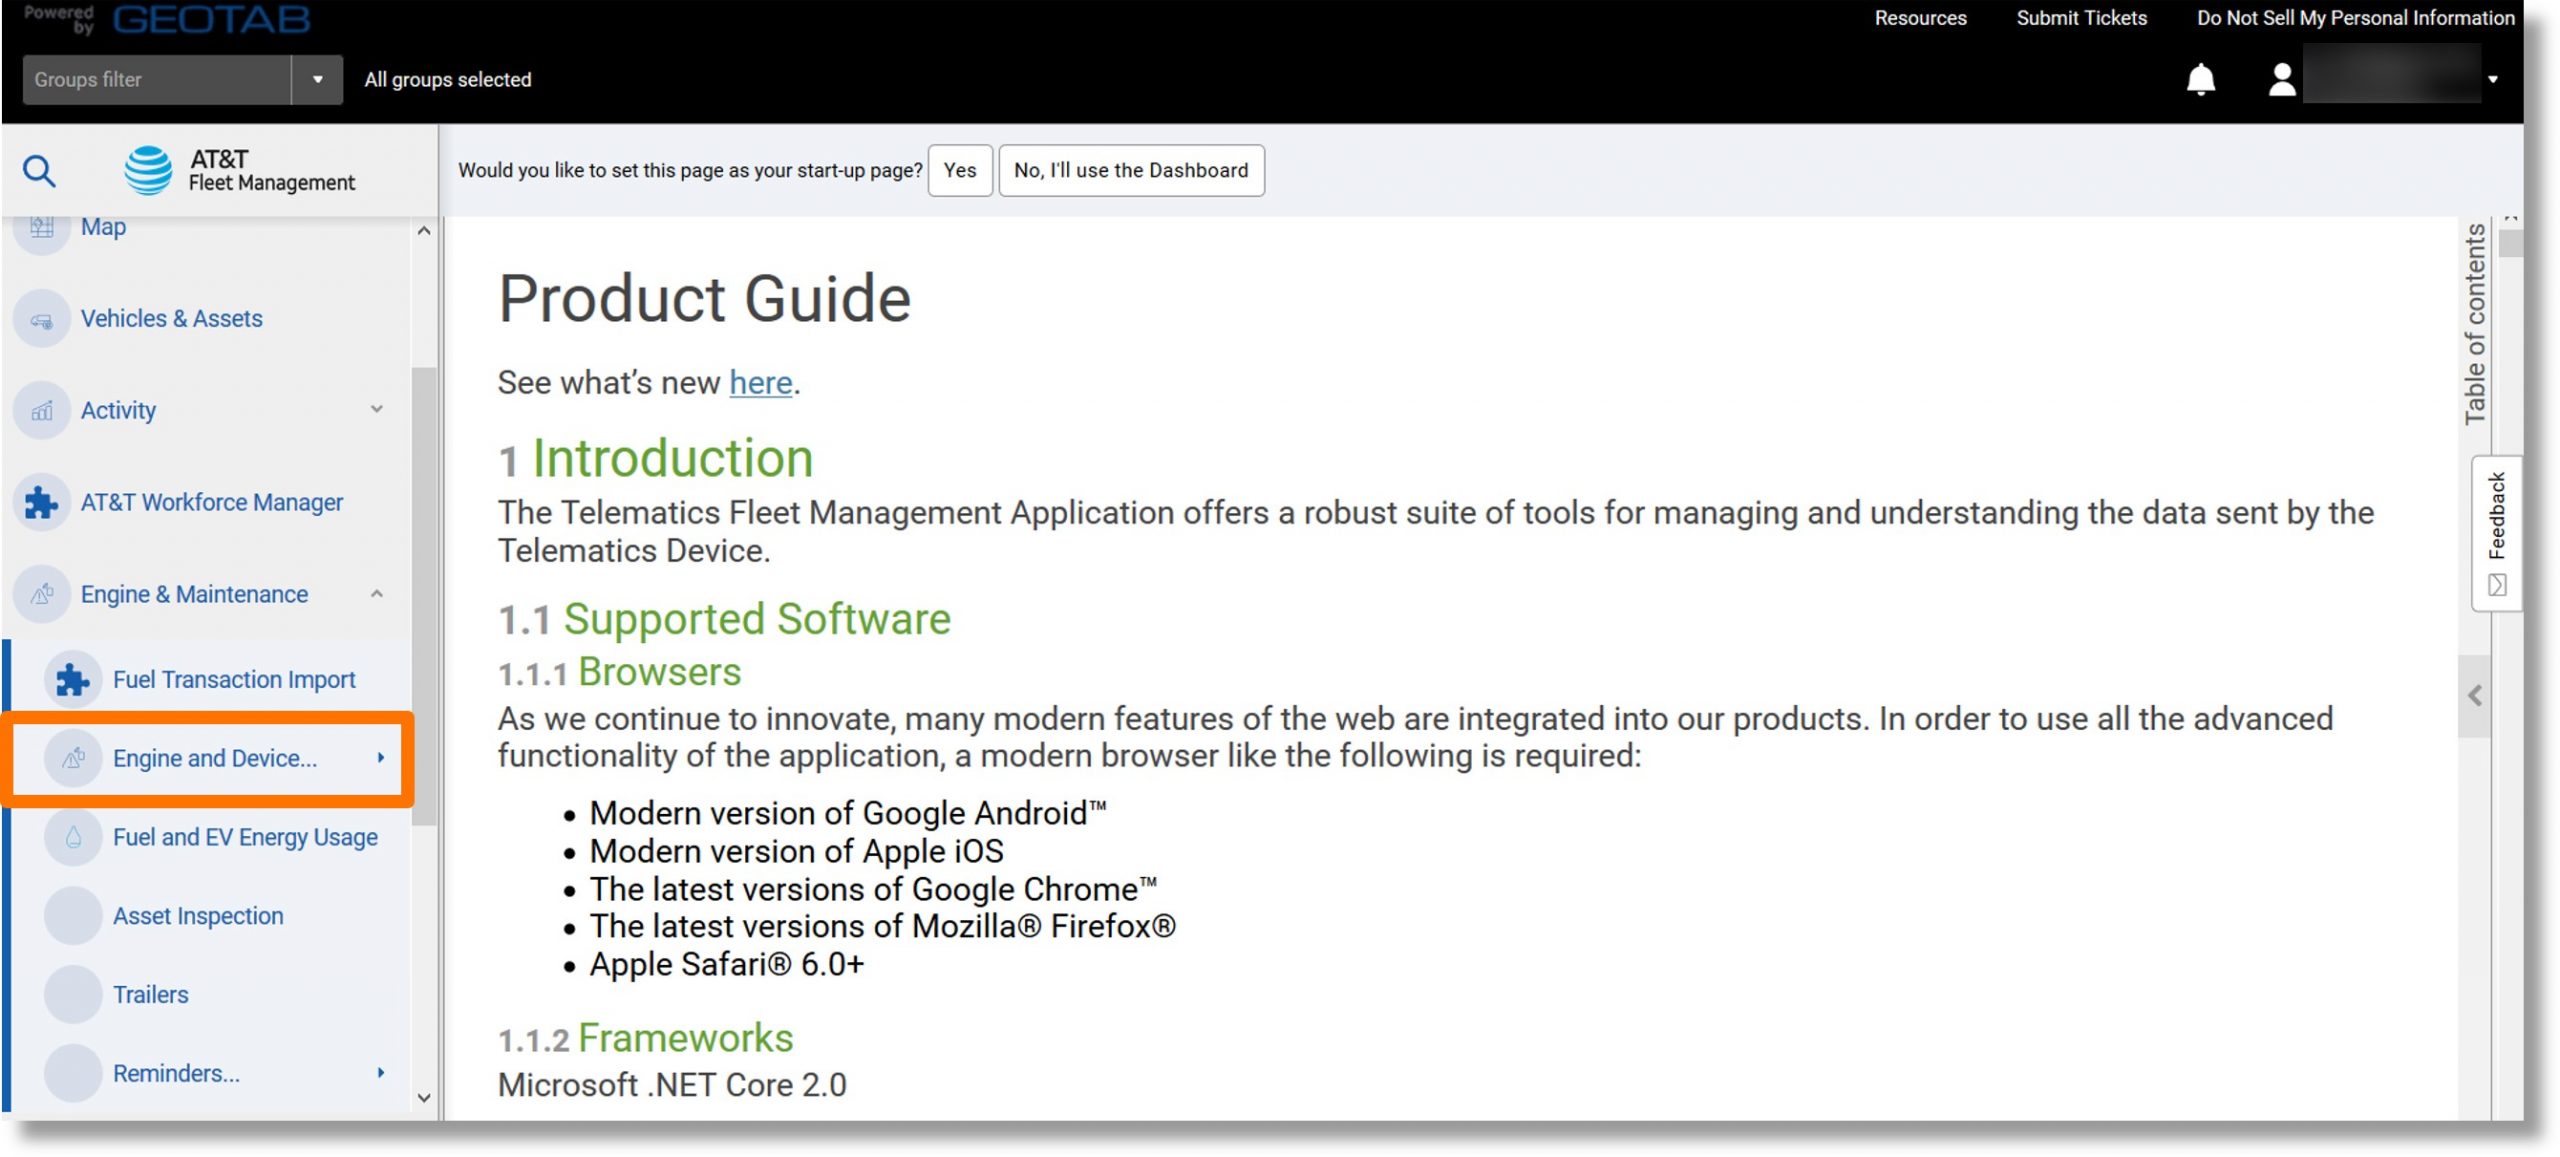
- Click on Faults.
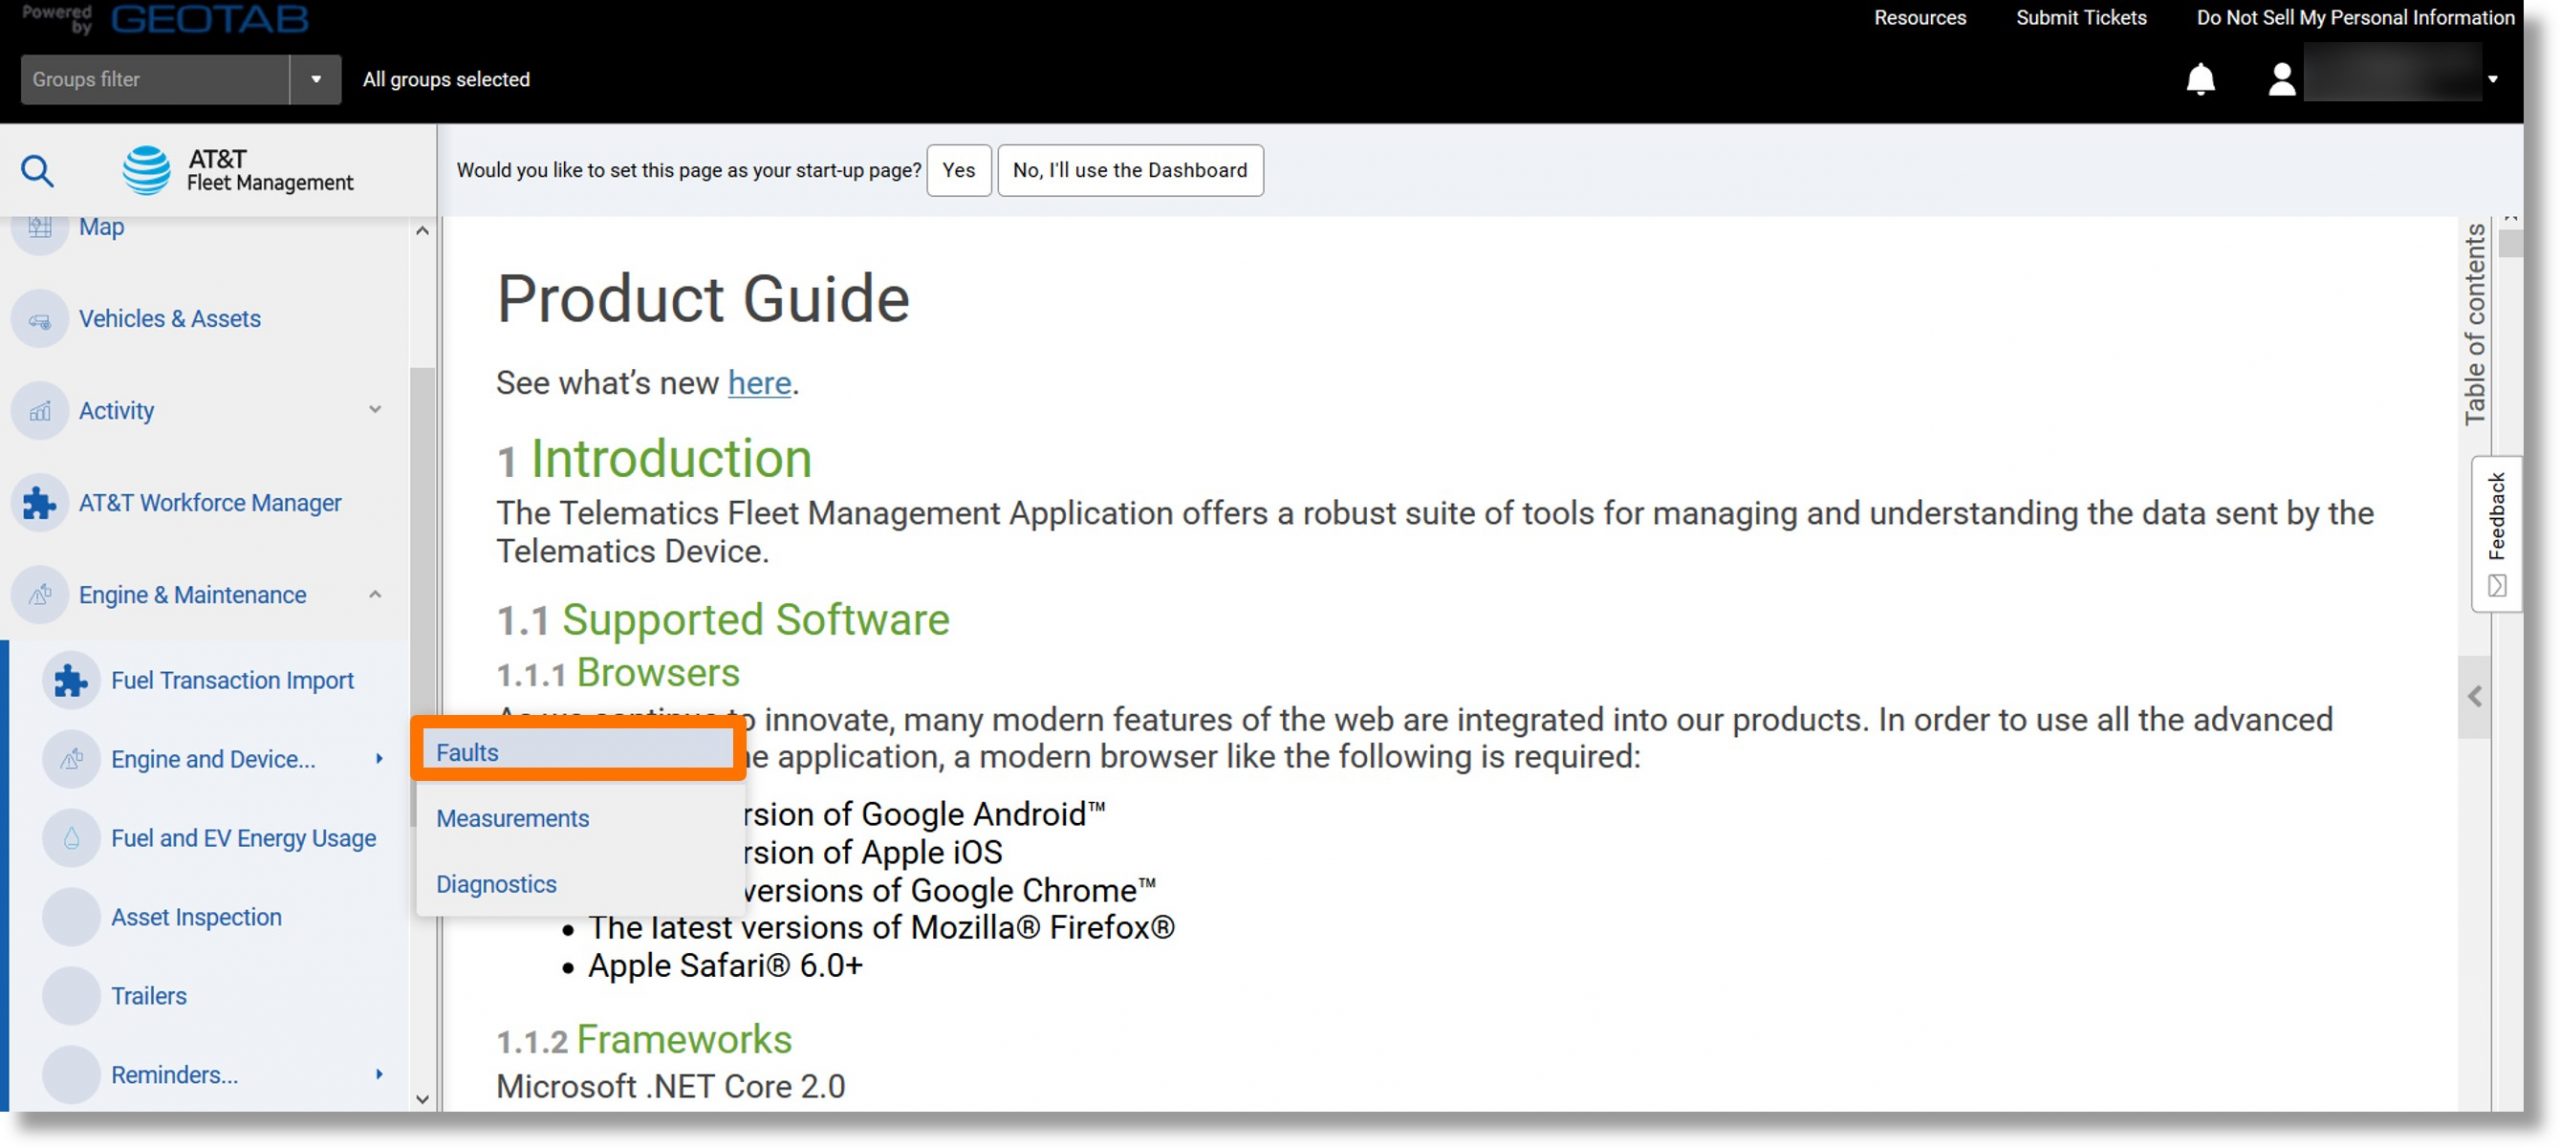
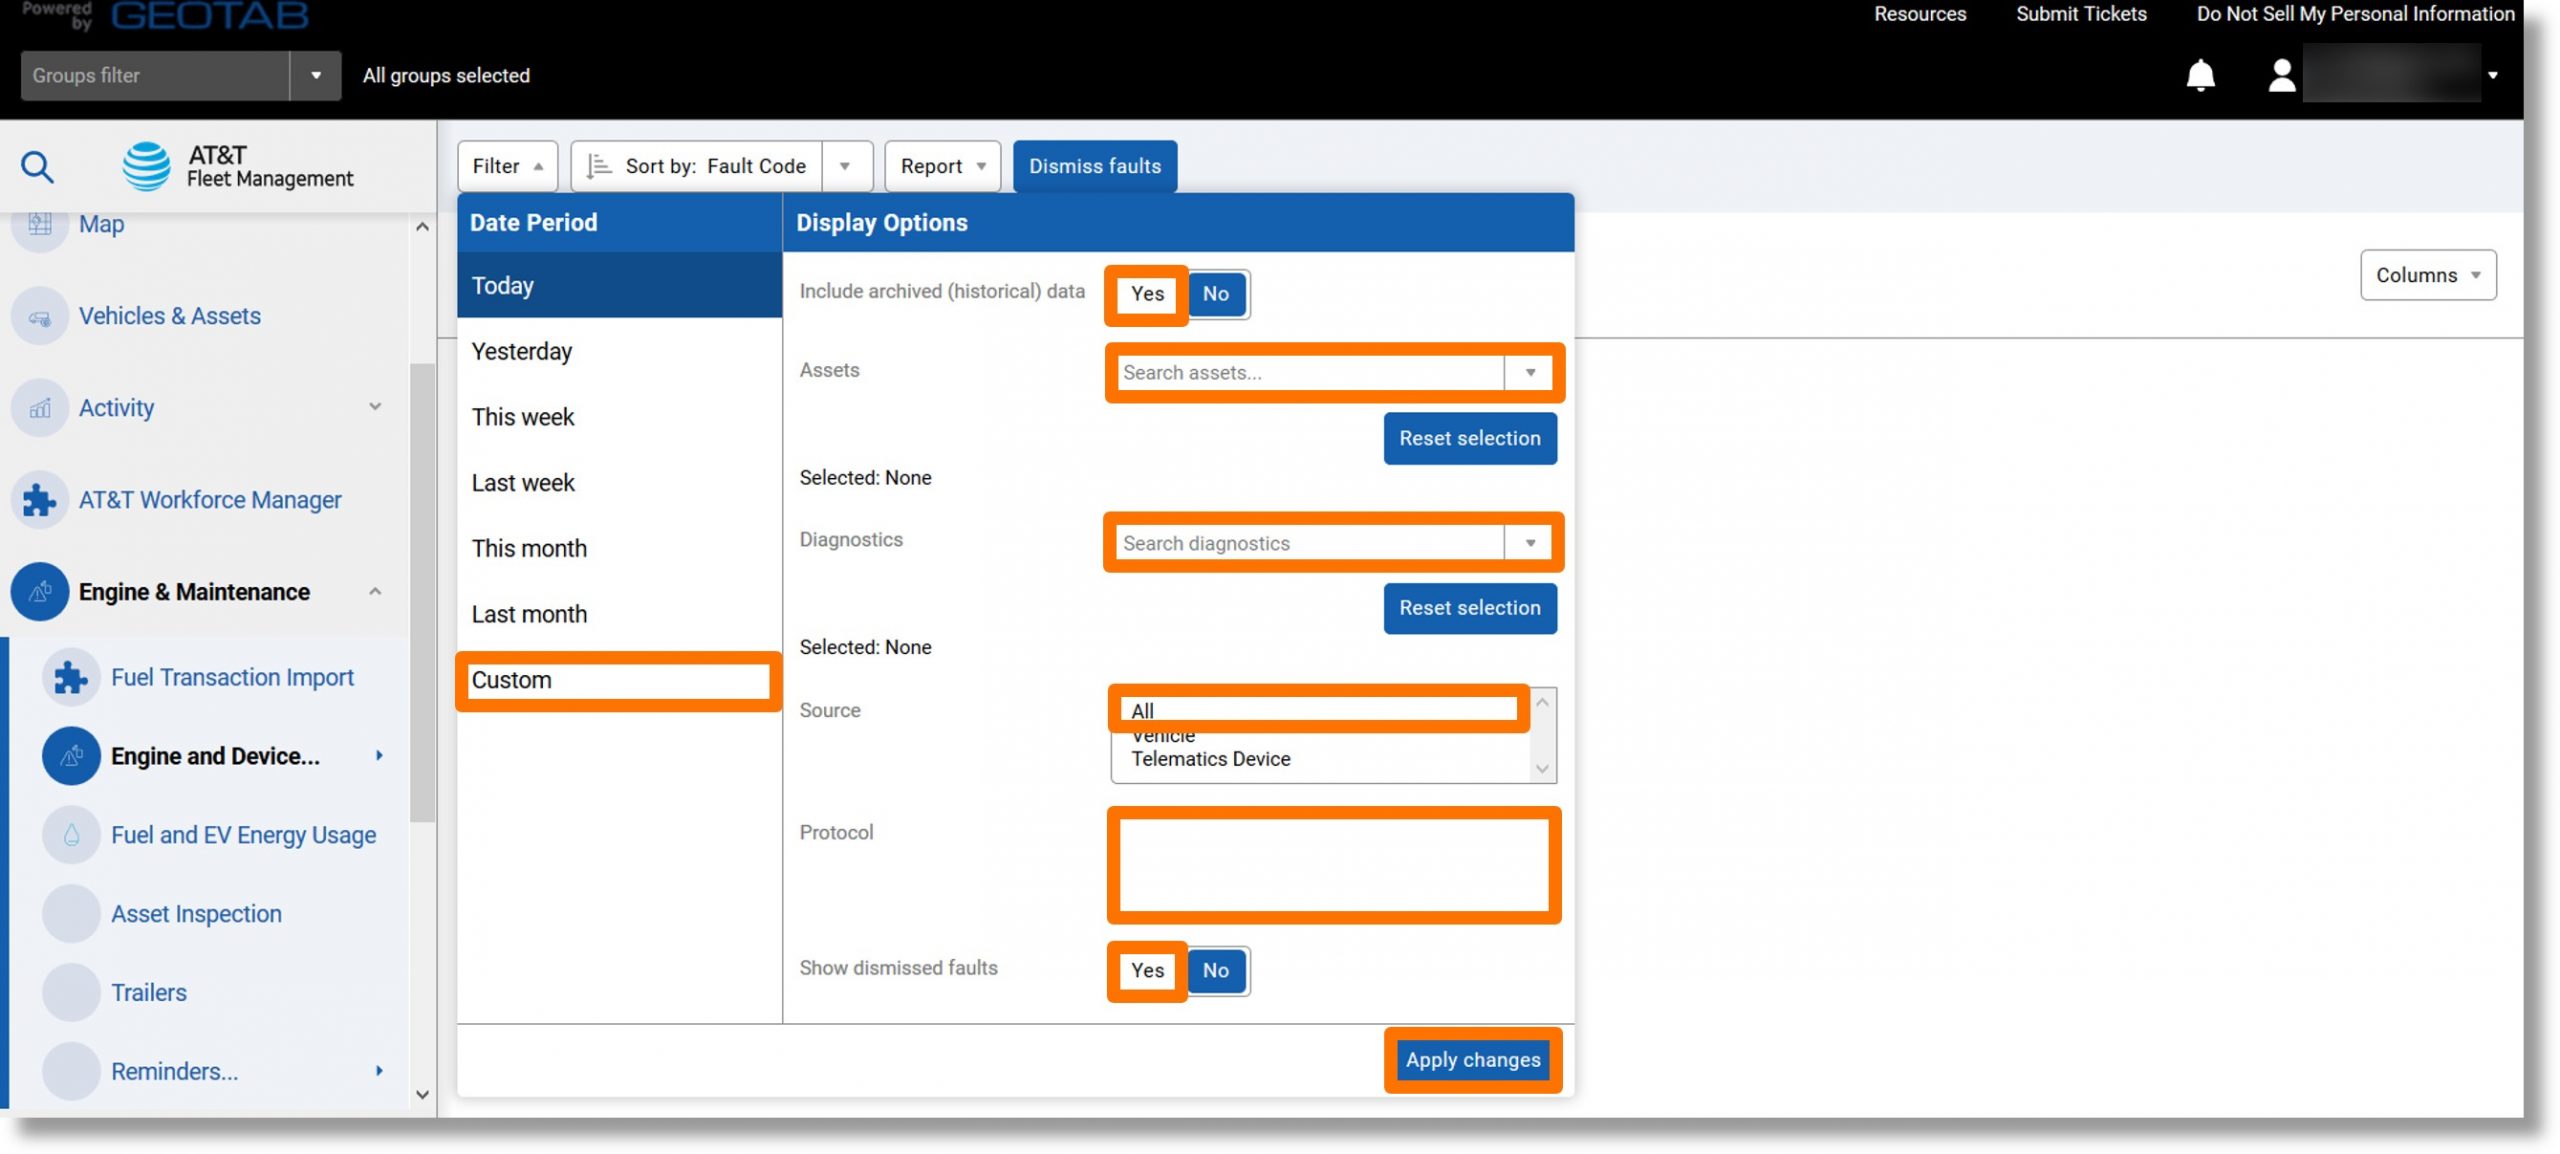
- Select the desired parameters and click on the Apply changes button.
- Click on the Report dropdown.
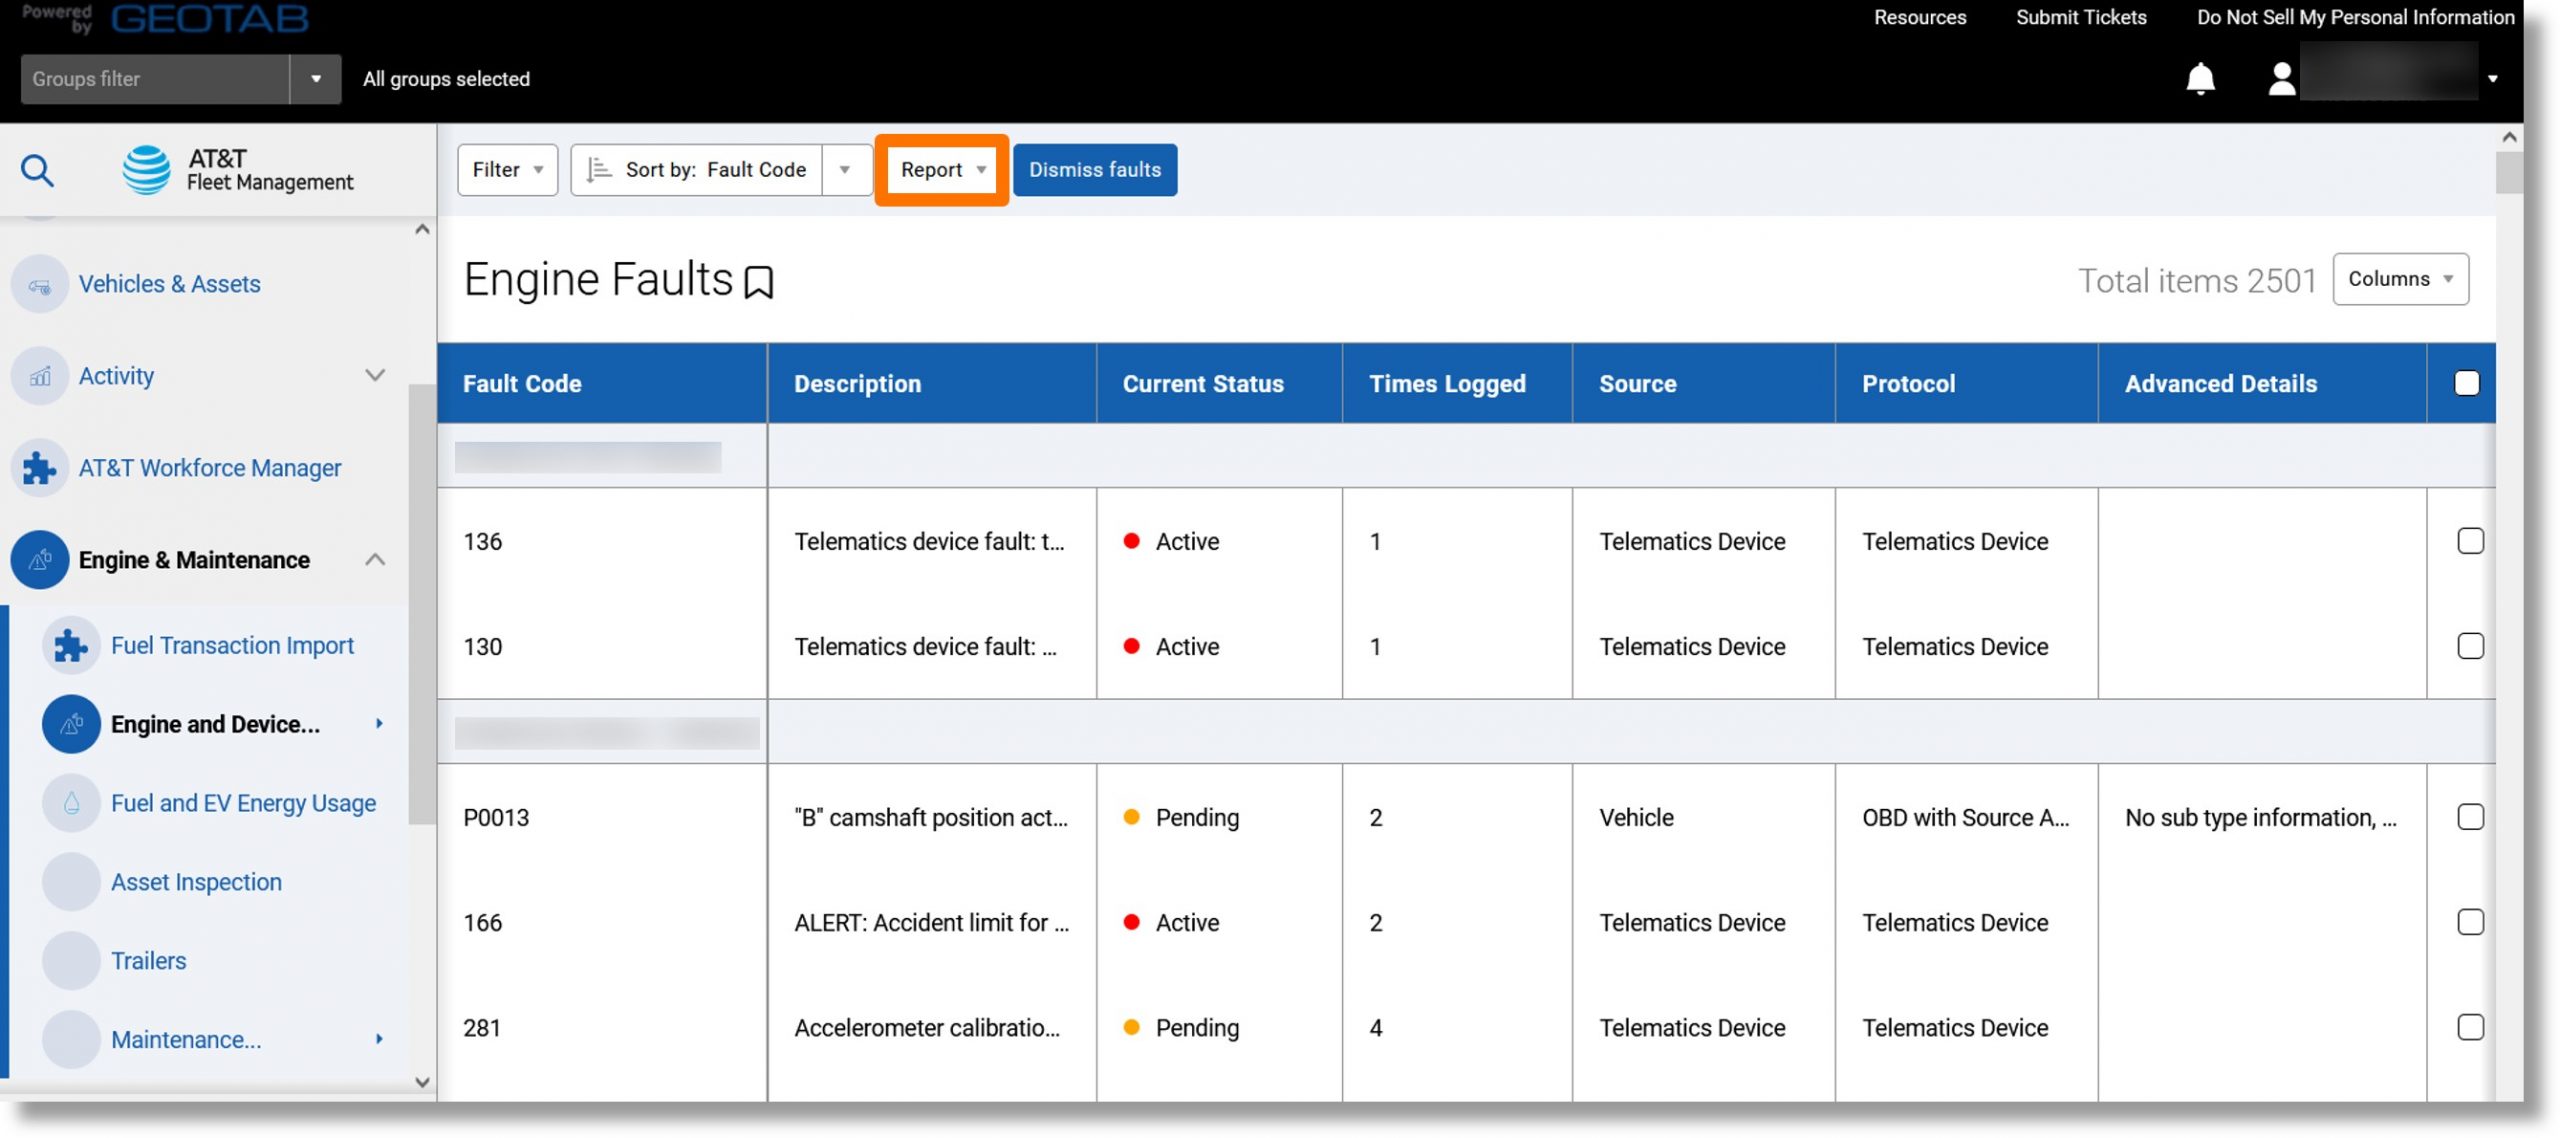
- Click on Details and then click on the ellipsis icon
 to the right of either “Standard” or “Advanced”.
- Click on View in browser.
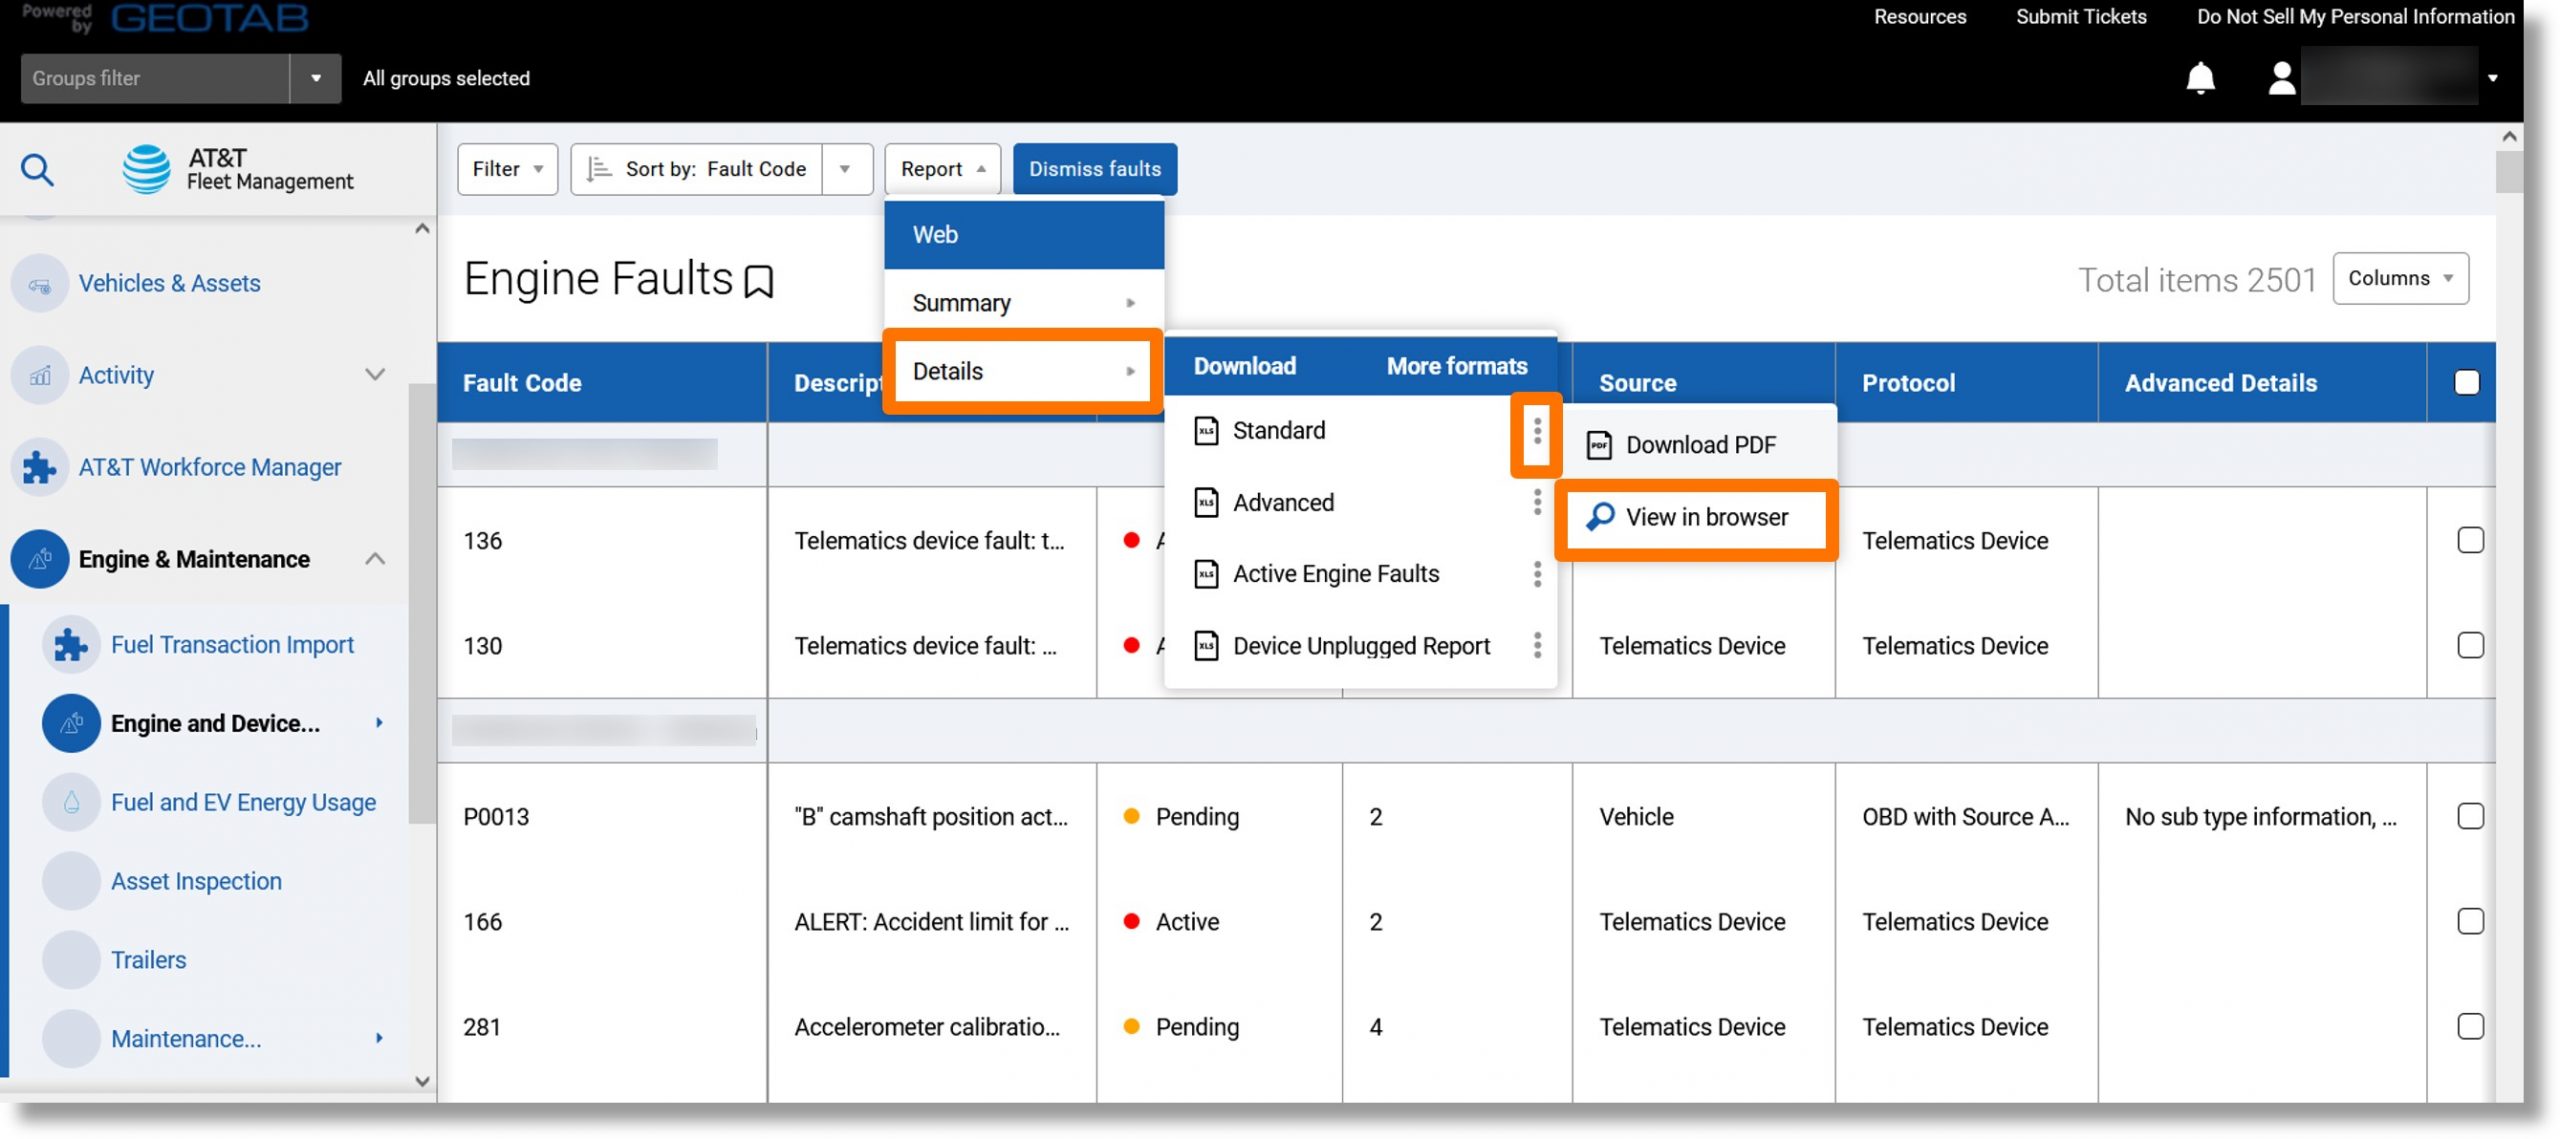
- The Engine Faults report displays.

Top
Engine Measurements Report
Use: Displays in-depth engine status information to stay current with each vehicle’s engine health.
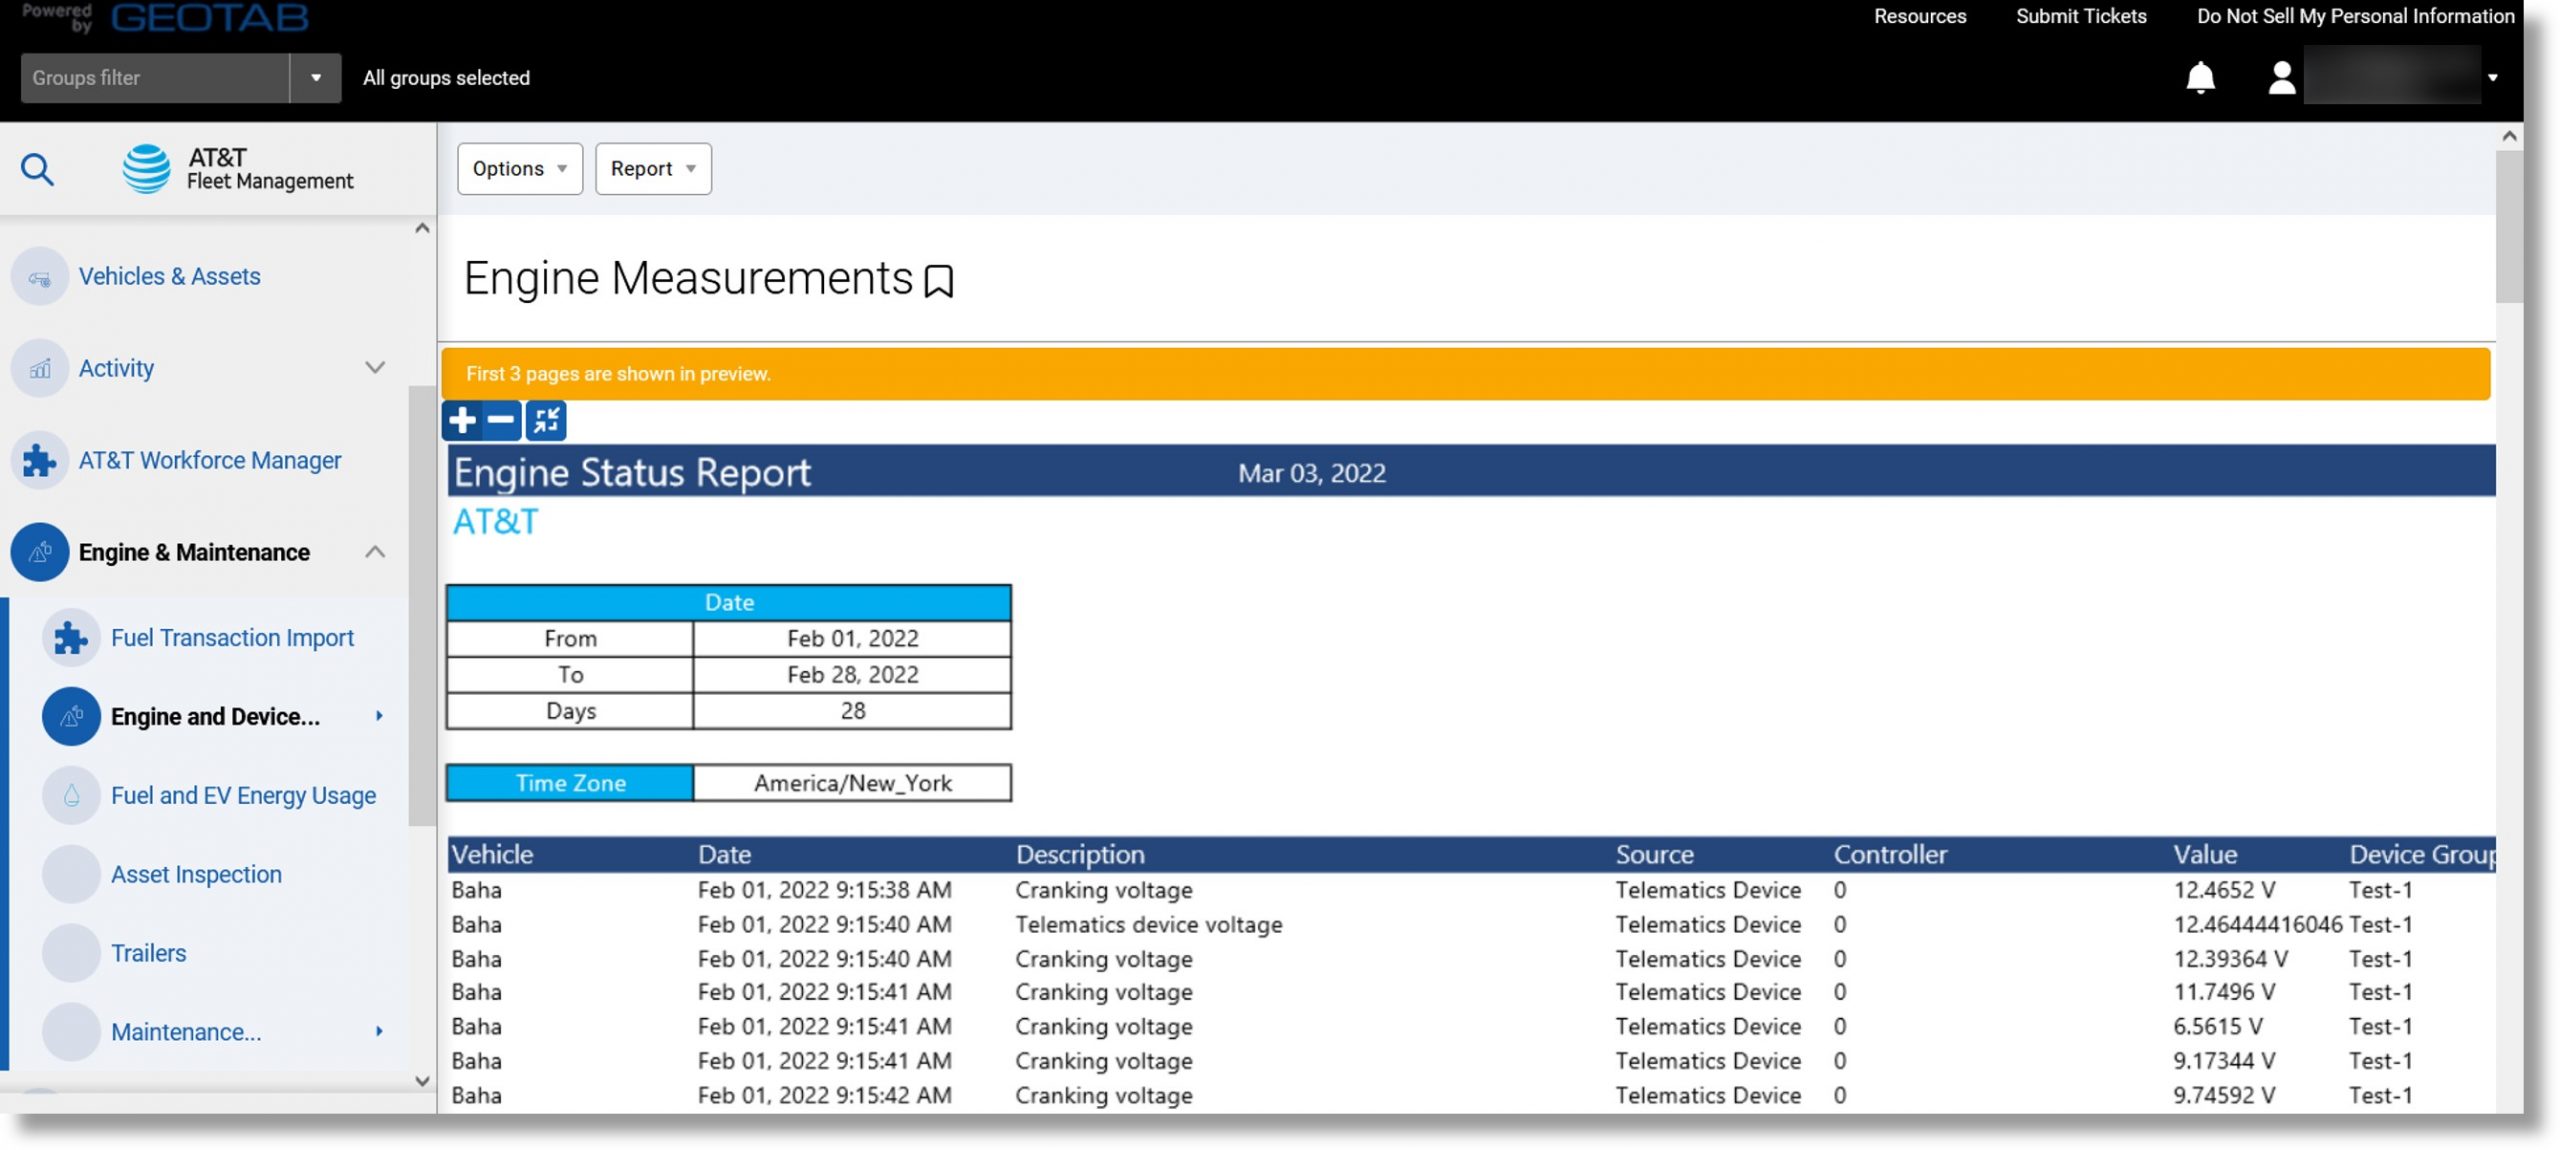
Information included: Vehicle, date and time of the event, engine status data, source, and measurement of engine status event.
Additional Information when exported: Device group, etc.
Accessing the report:
- Click on Engine & Maintenance on the left and scroll down.
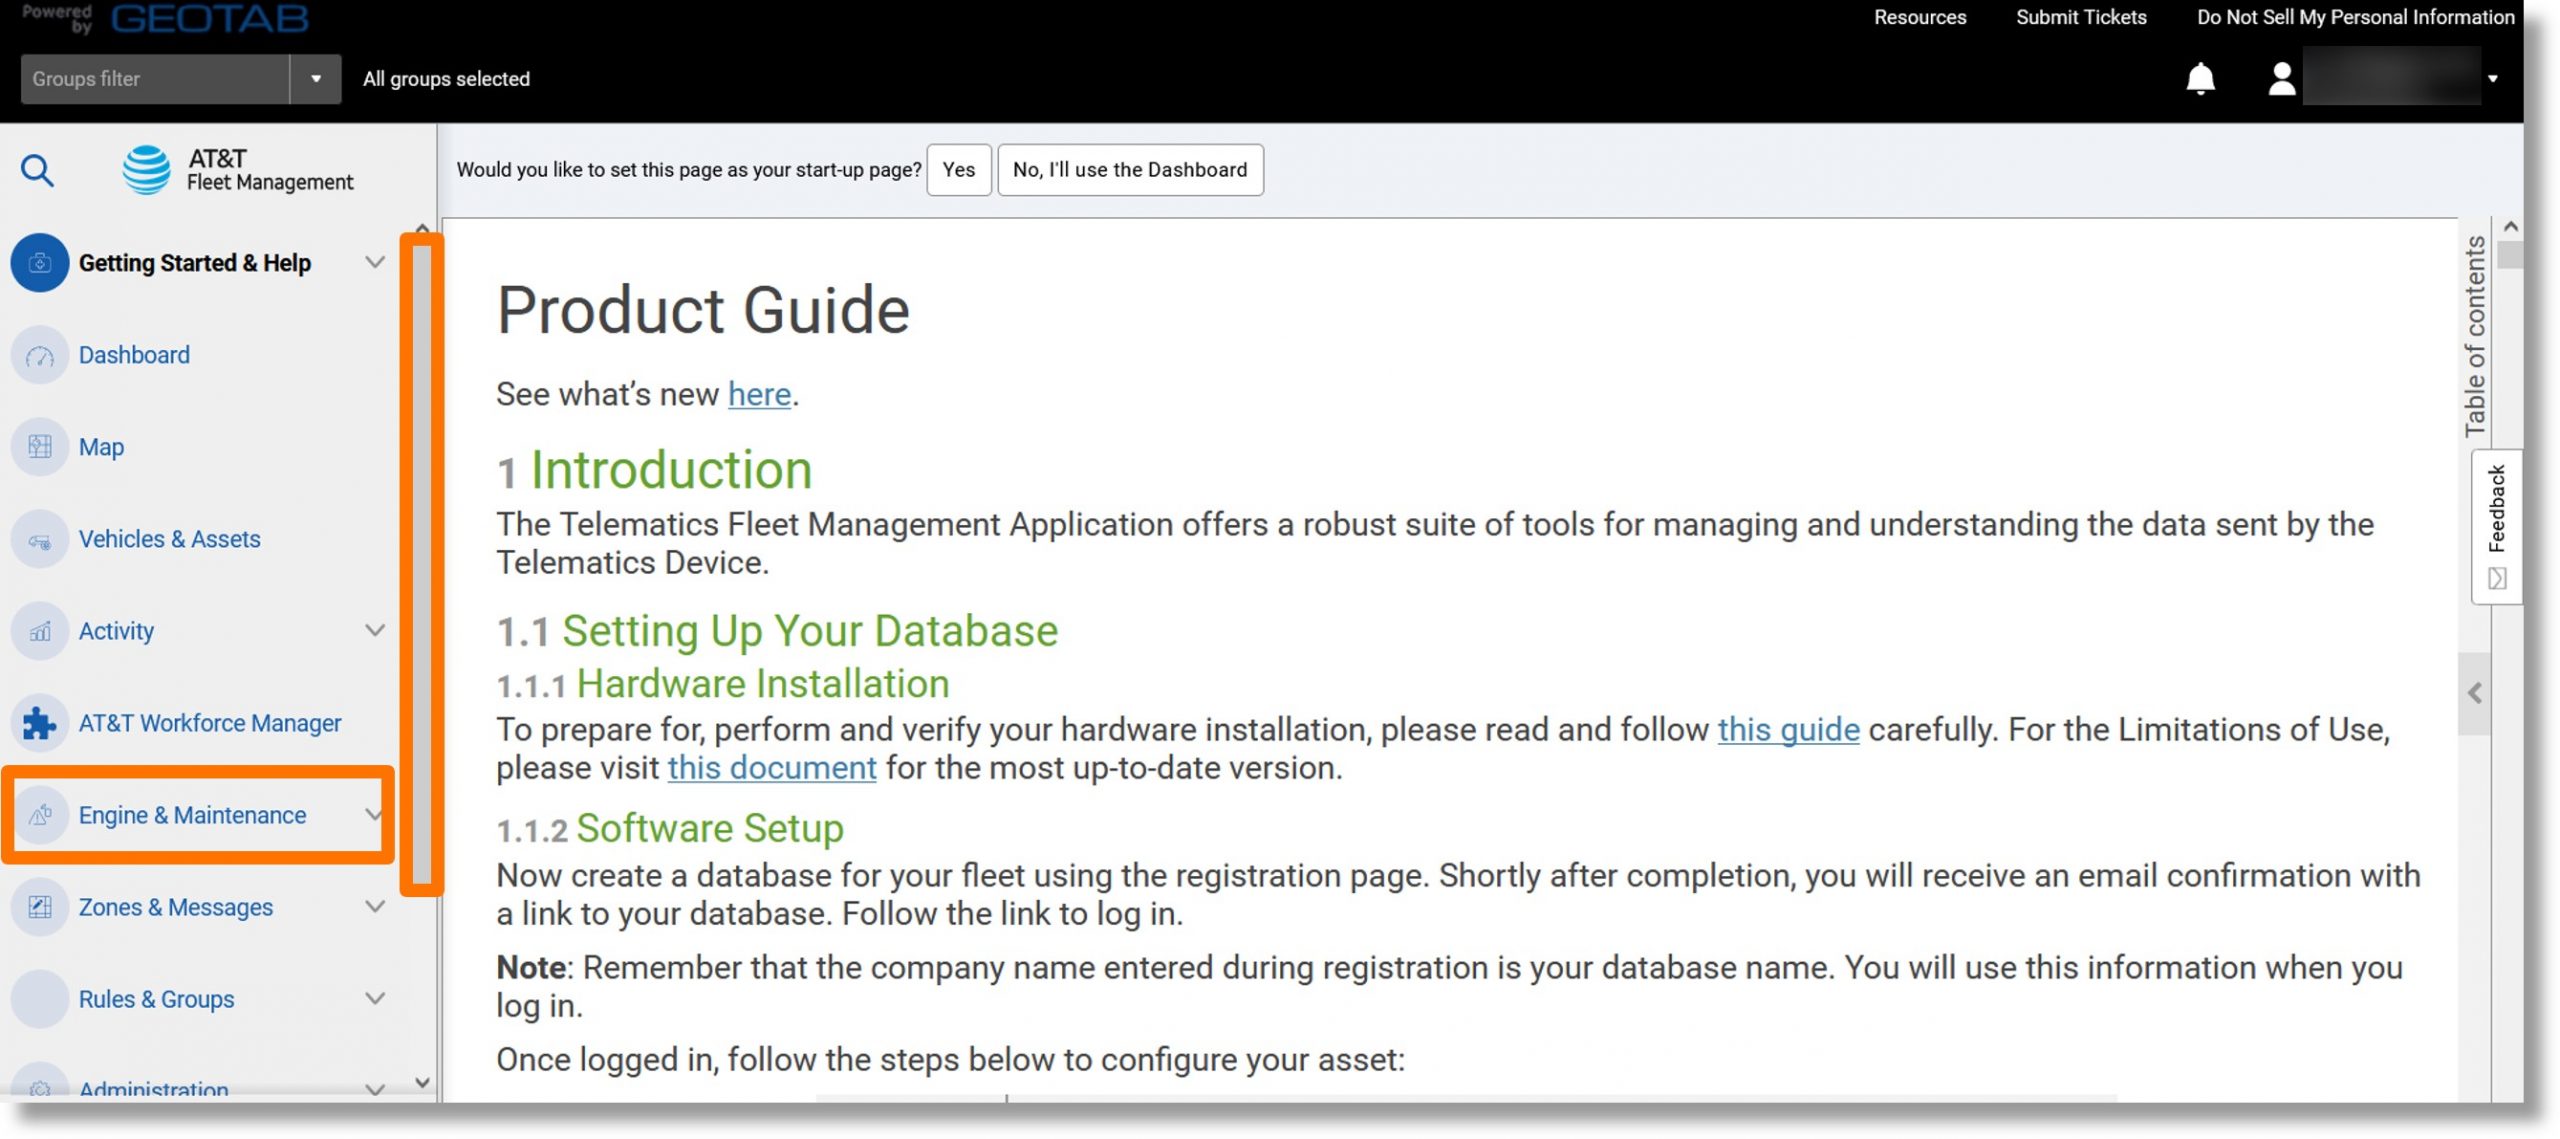
- Click on Engine and Device….
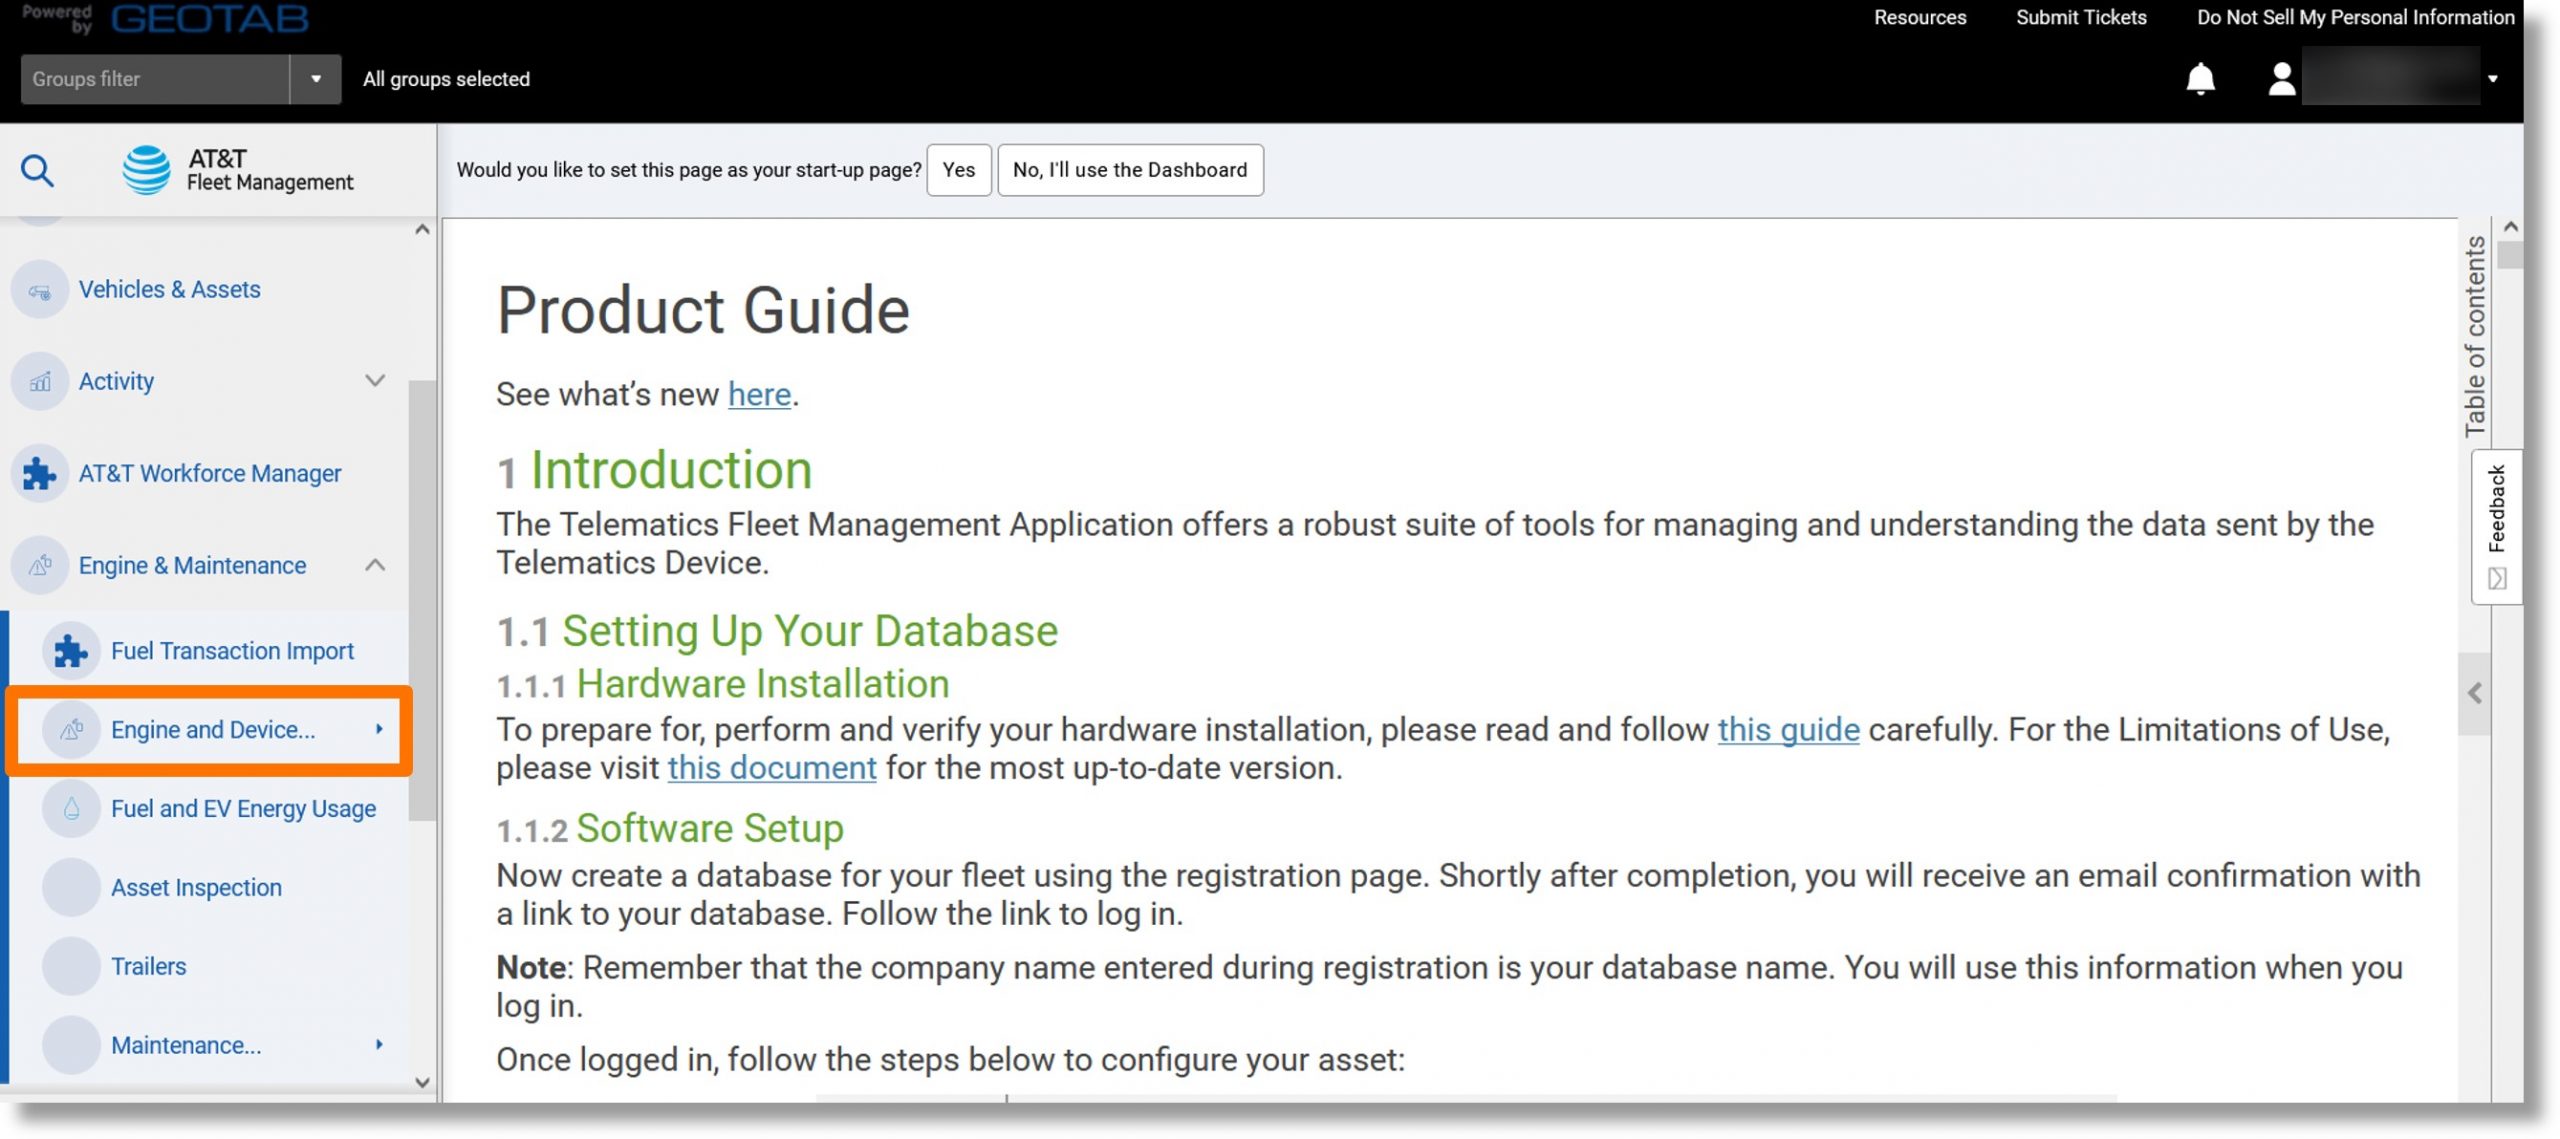
- Click on Measurements.
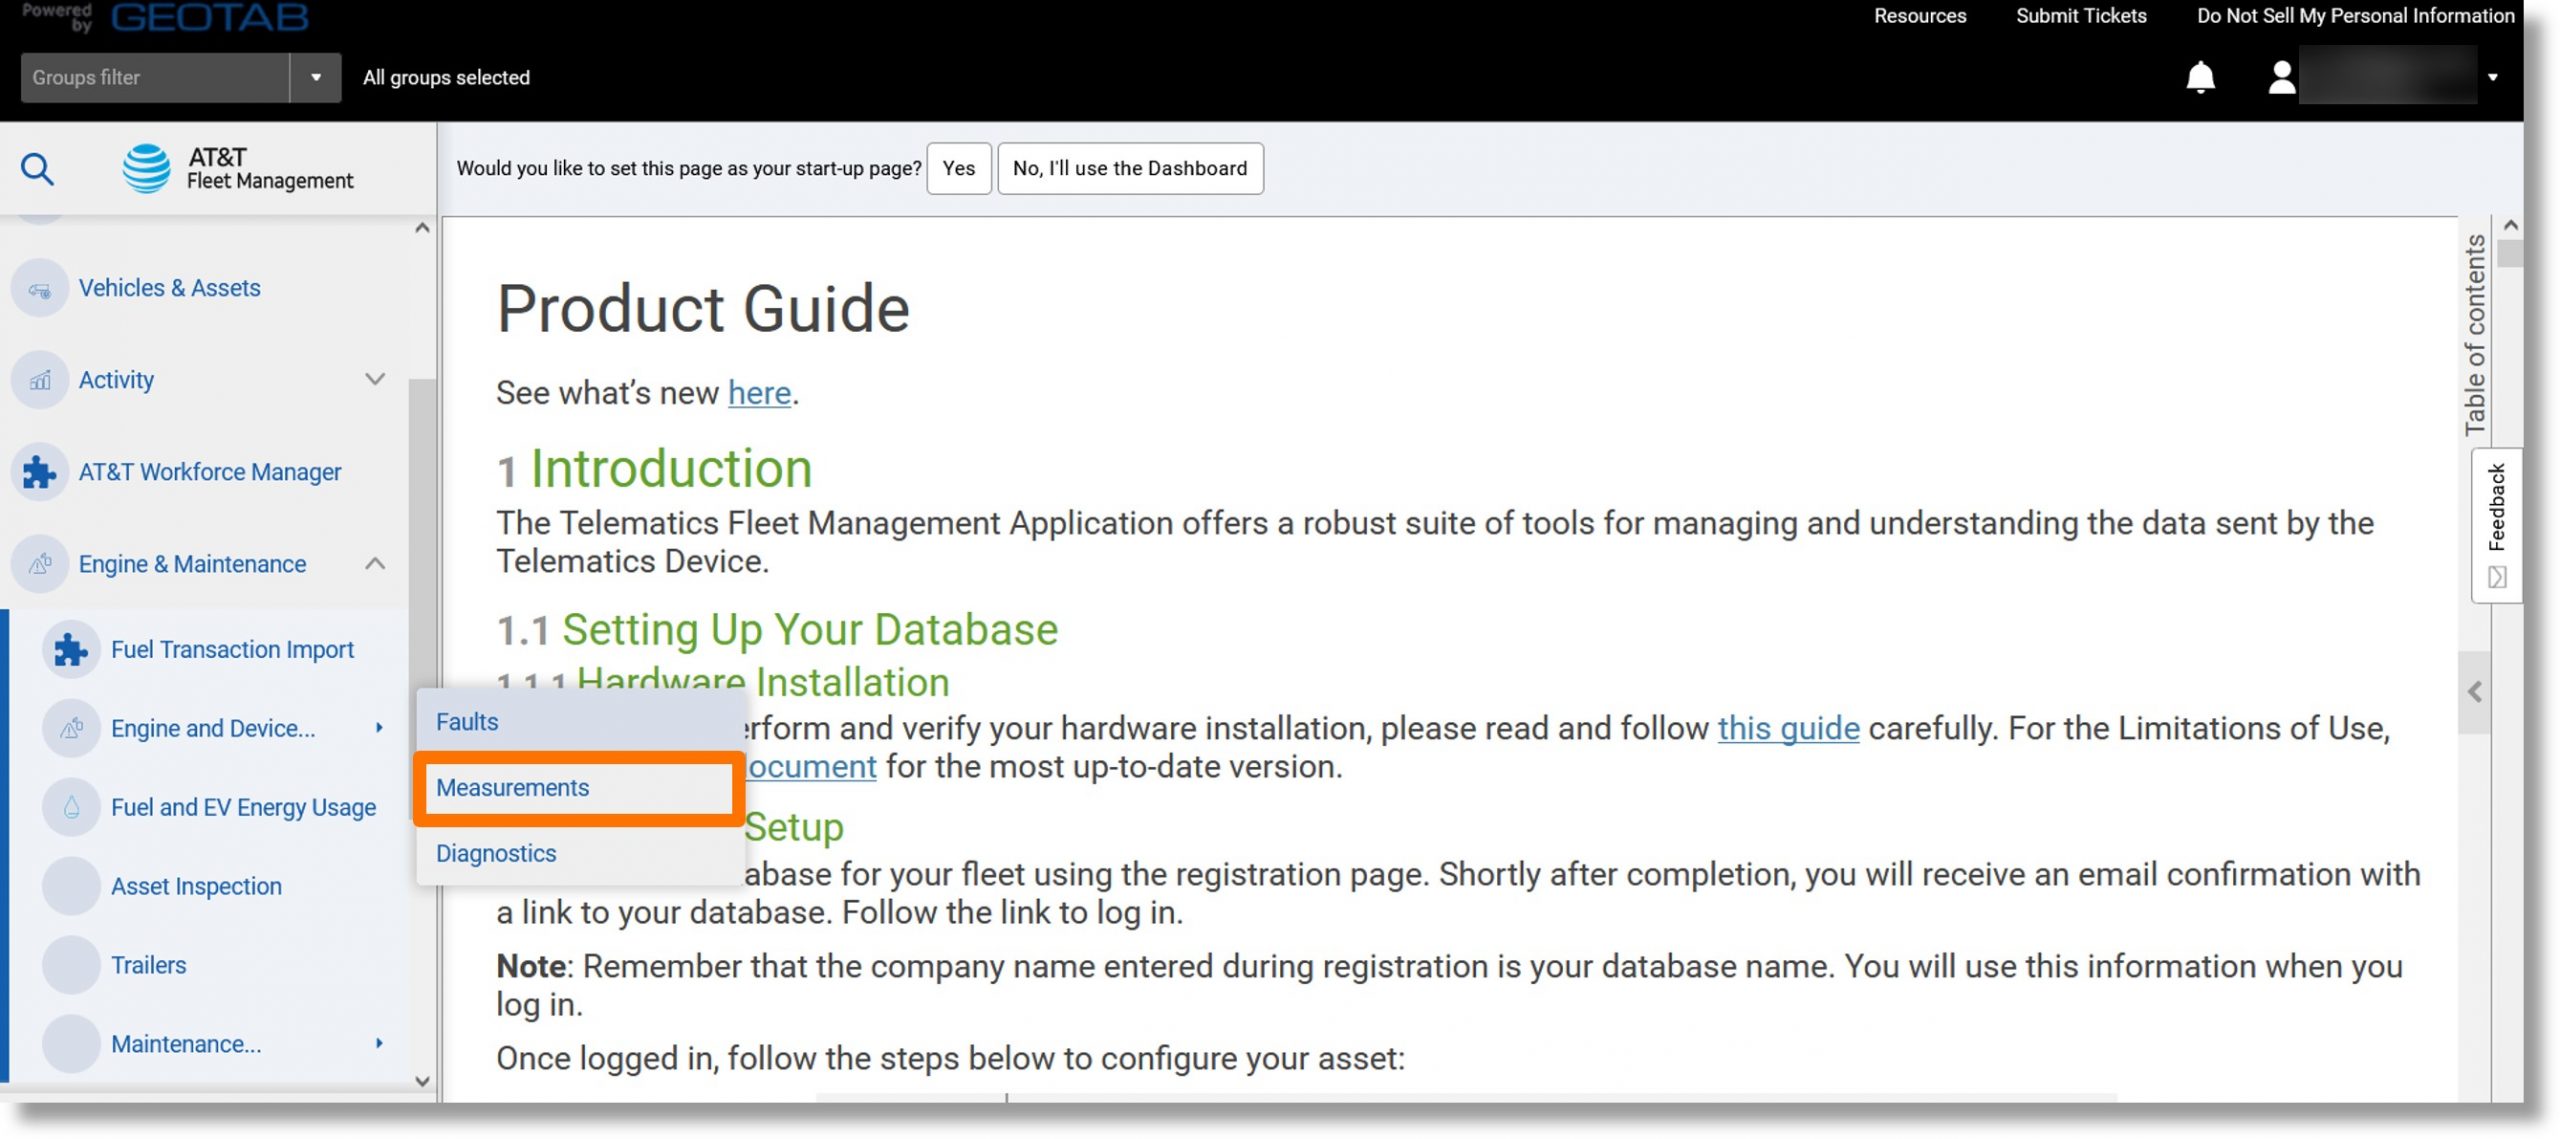
- Click on the desired parameters and then click the Apply changes button.
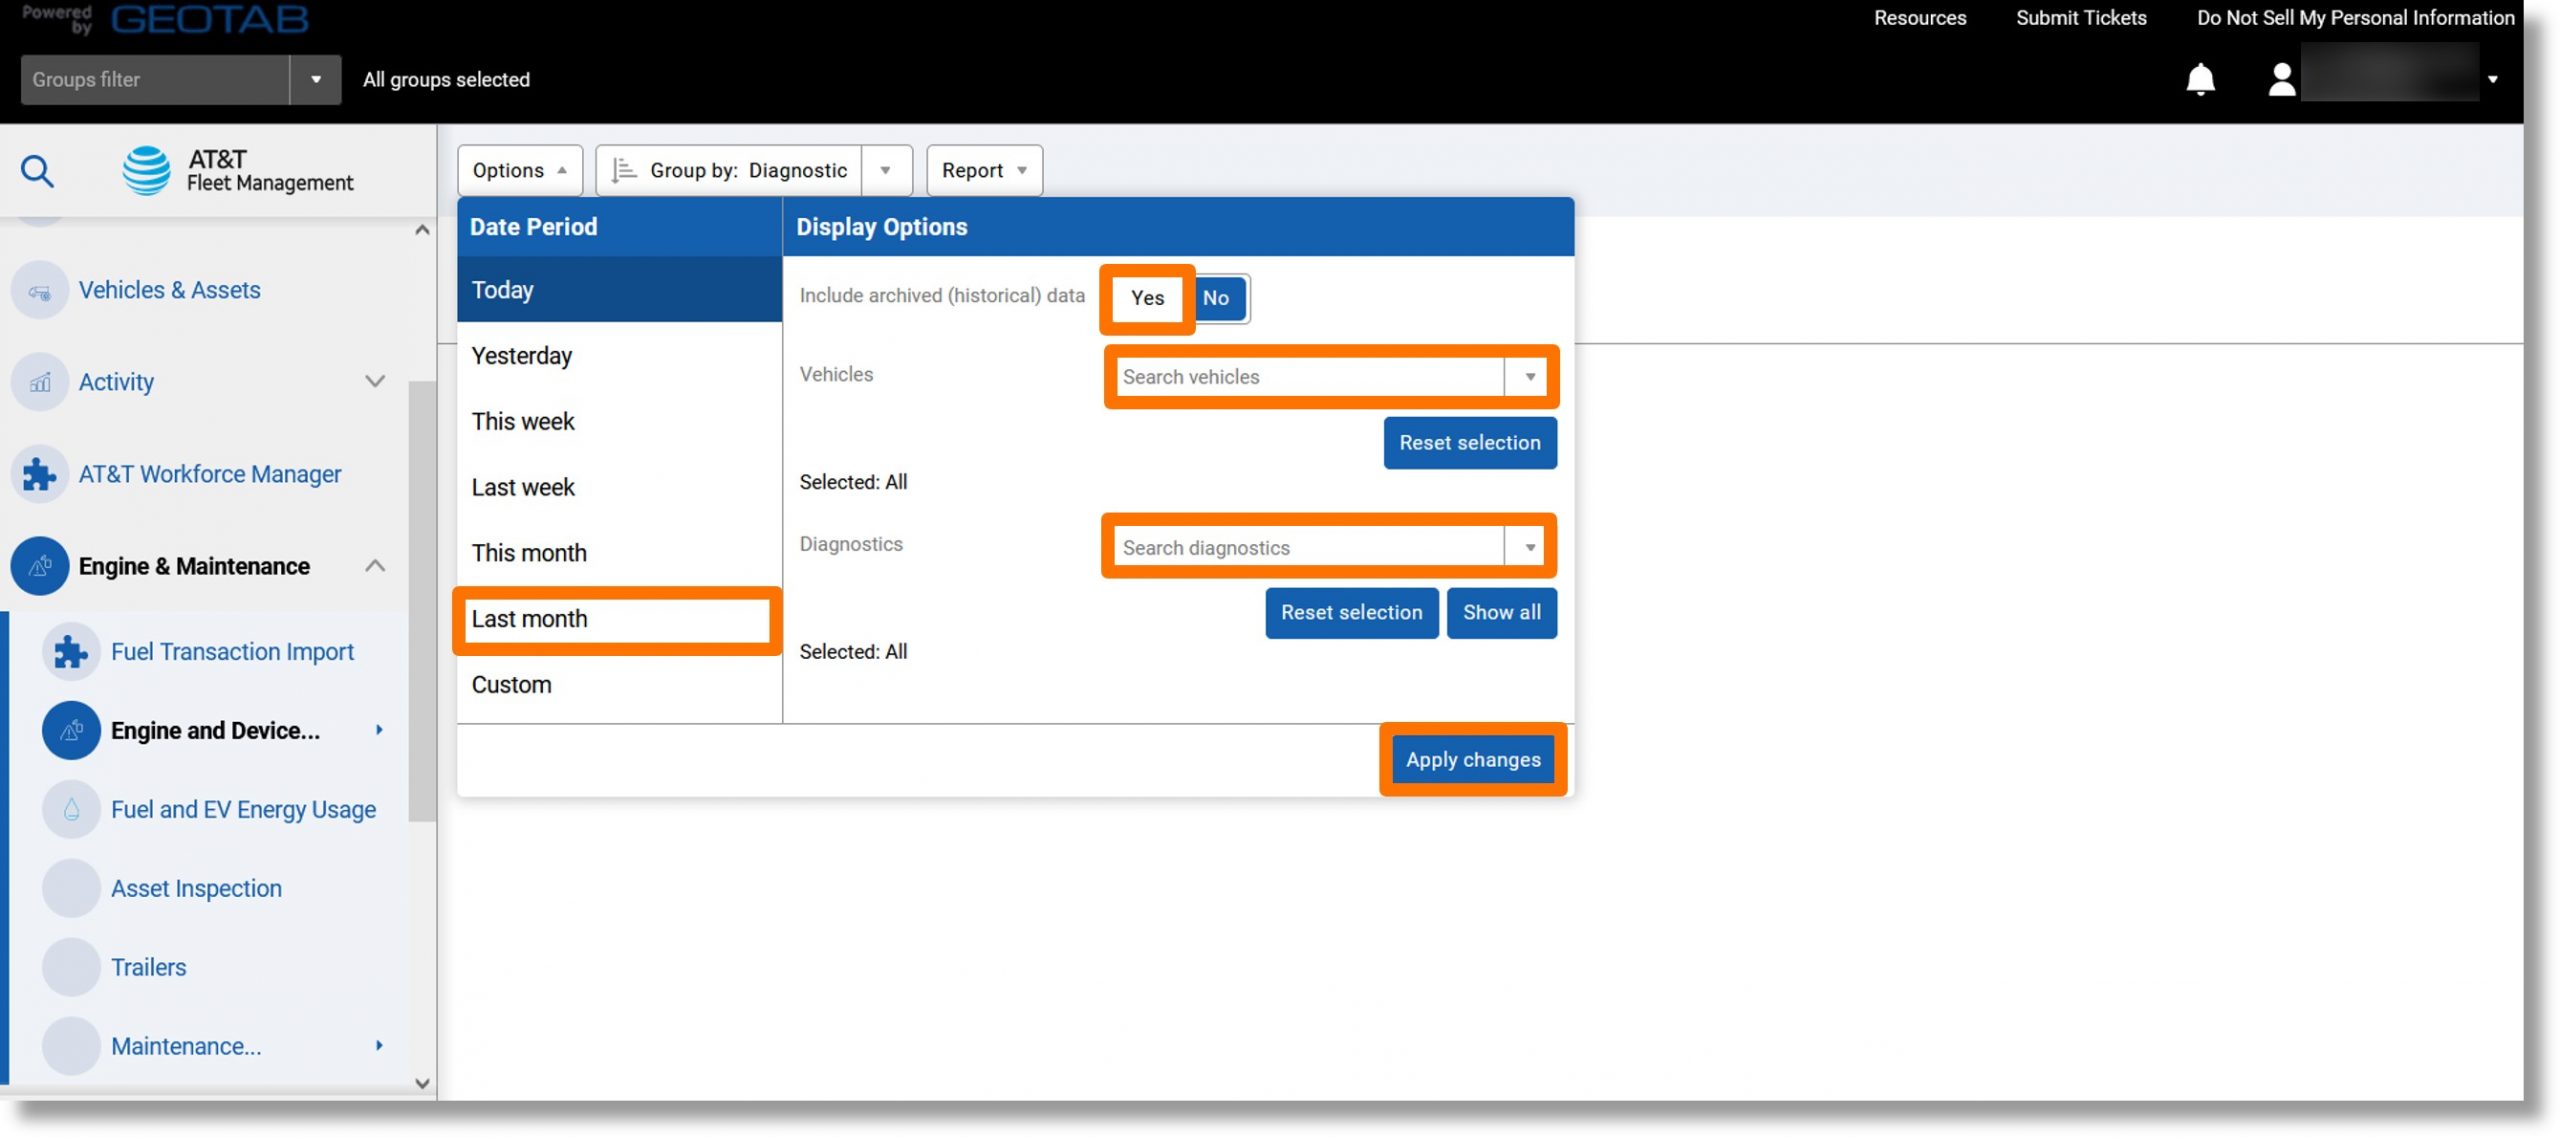
- Click on the Report dropdown.
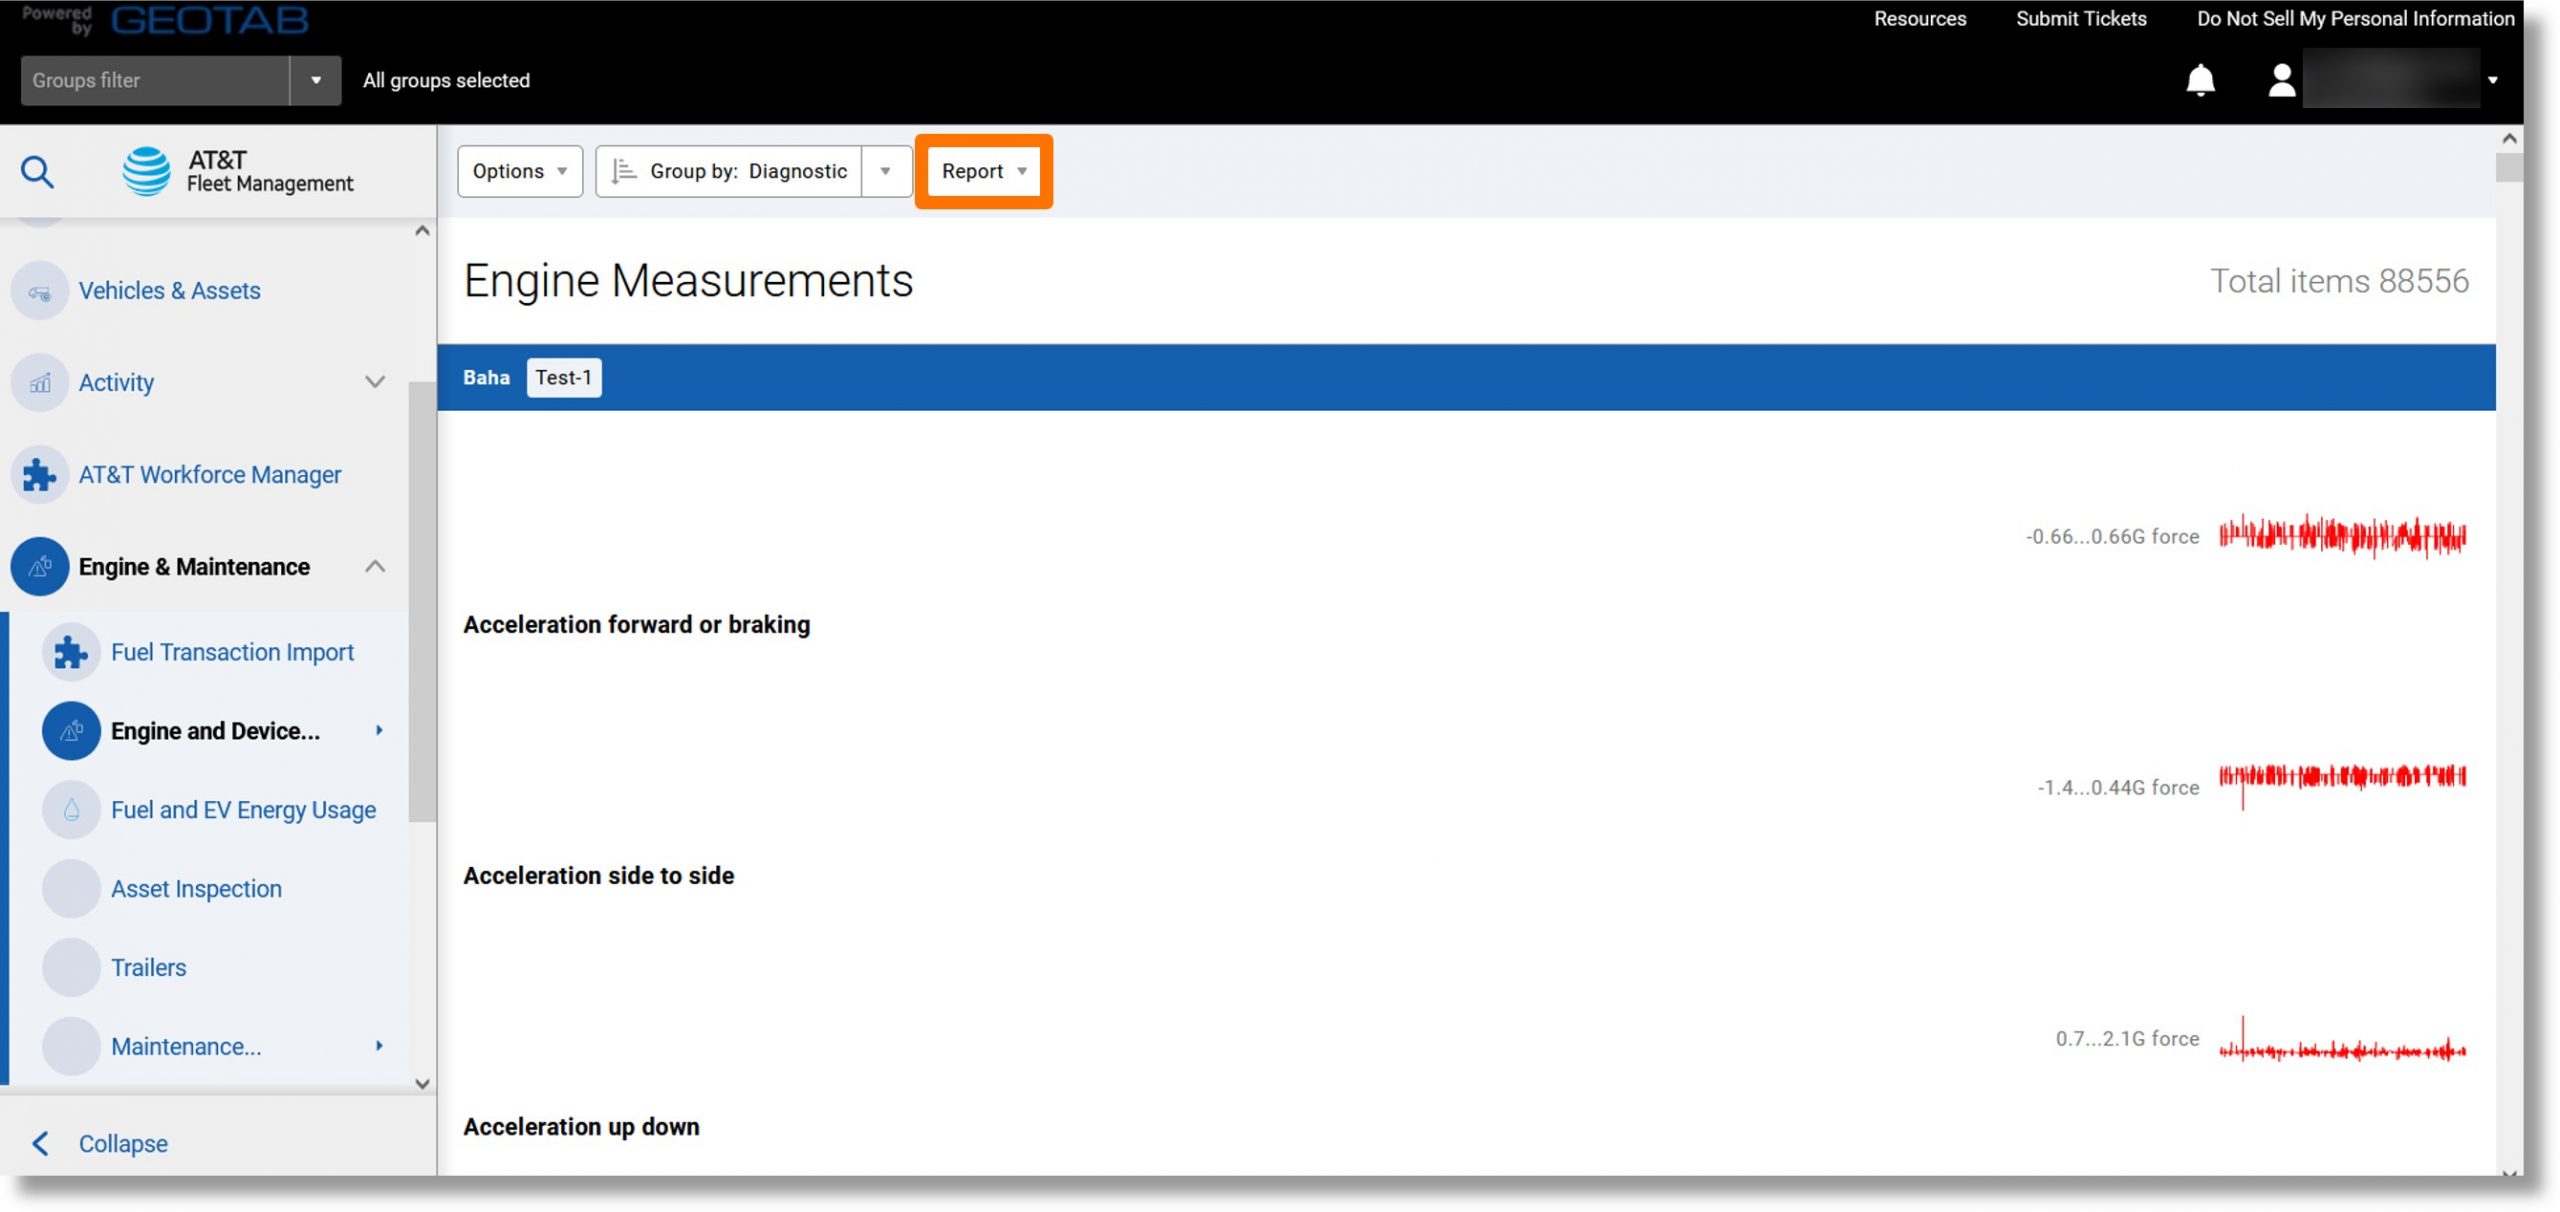
- Click on the ellipsis icon
 to the right of either “Standard” or “Advanced” and then click on View in browser.
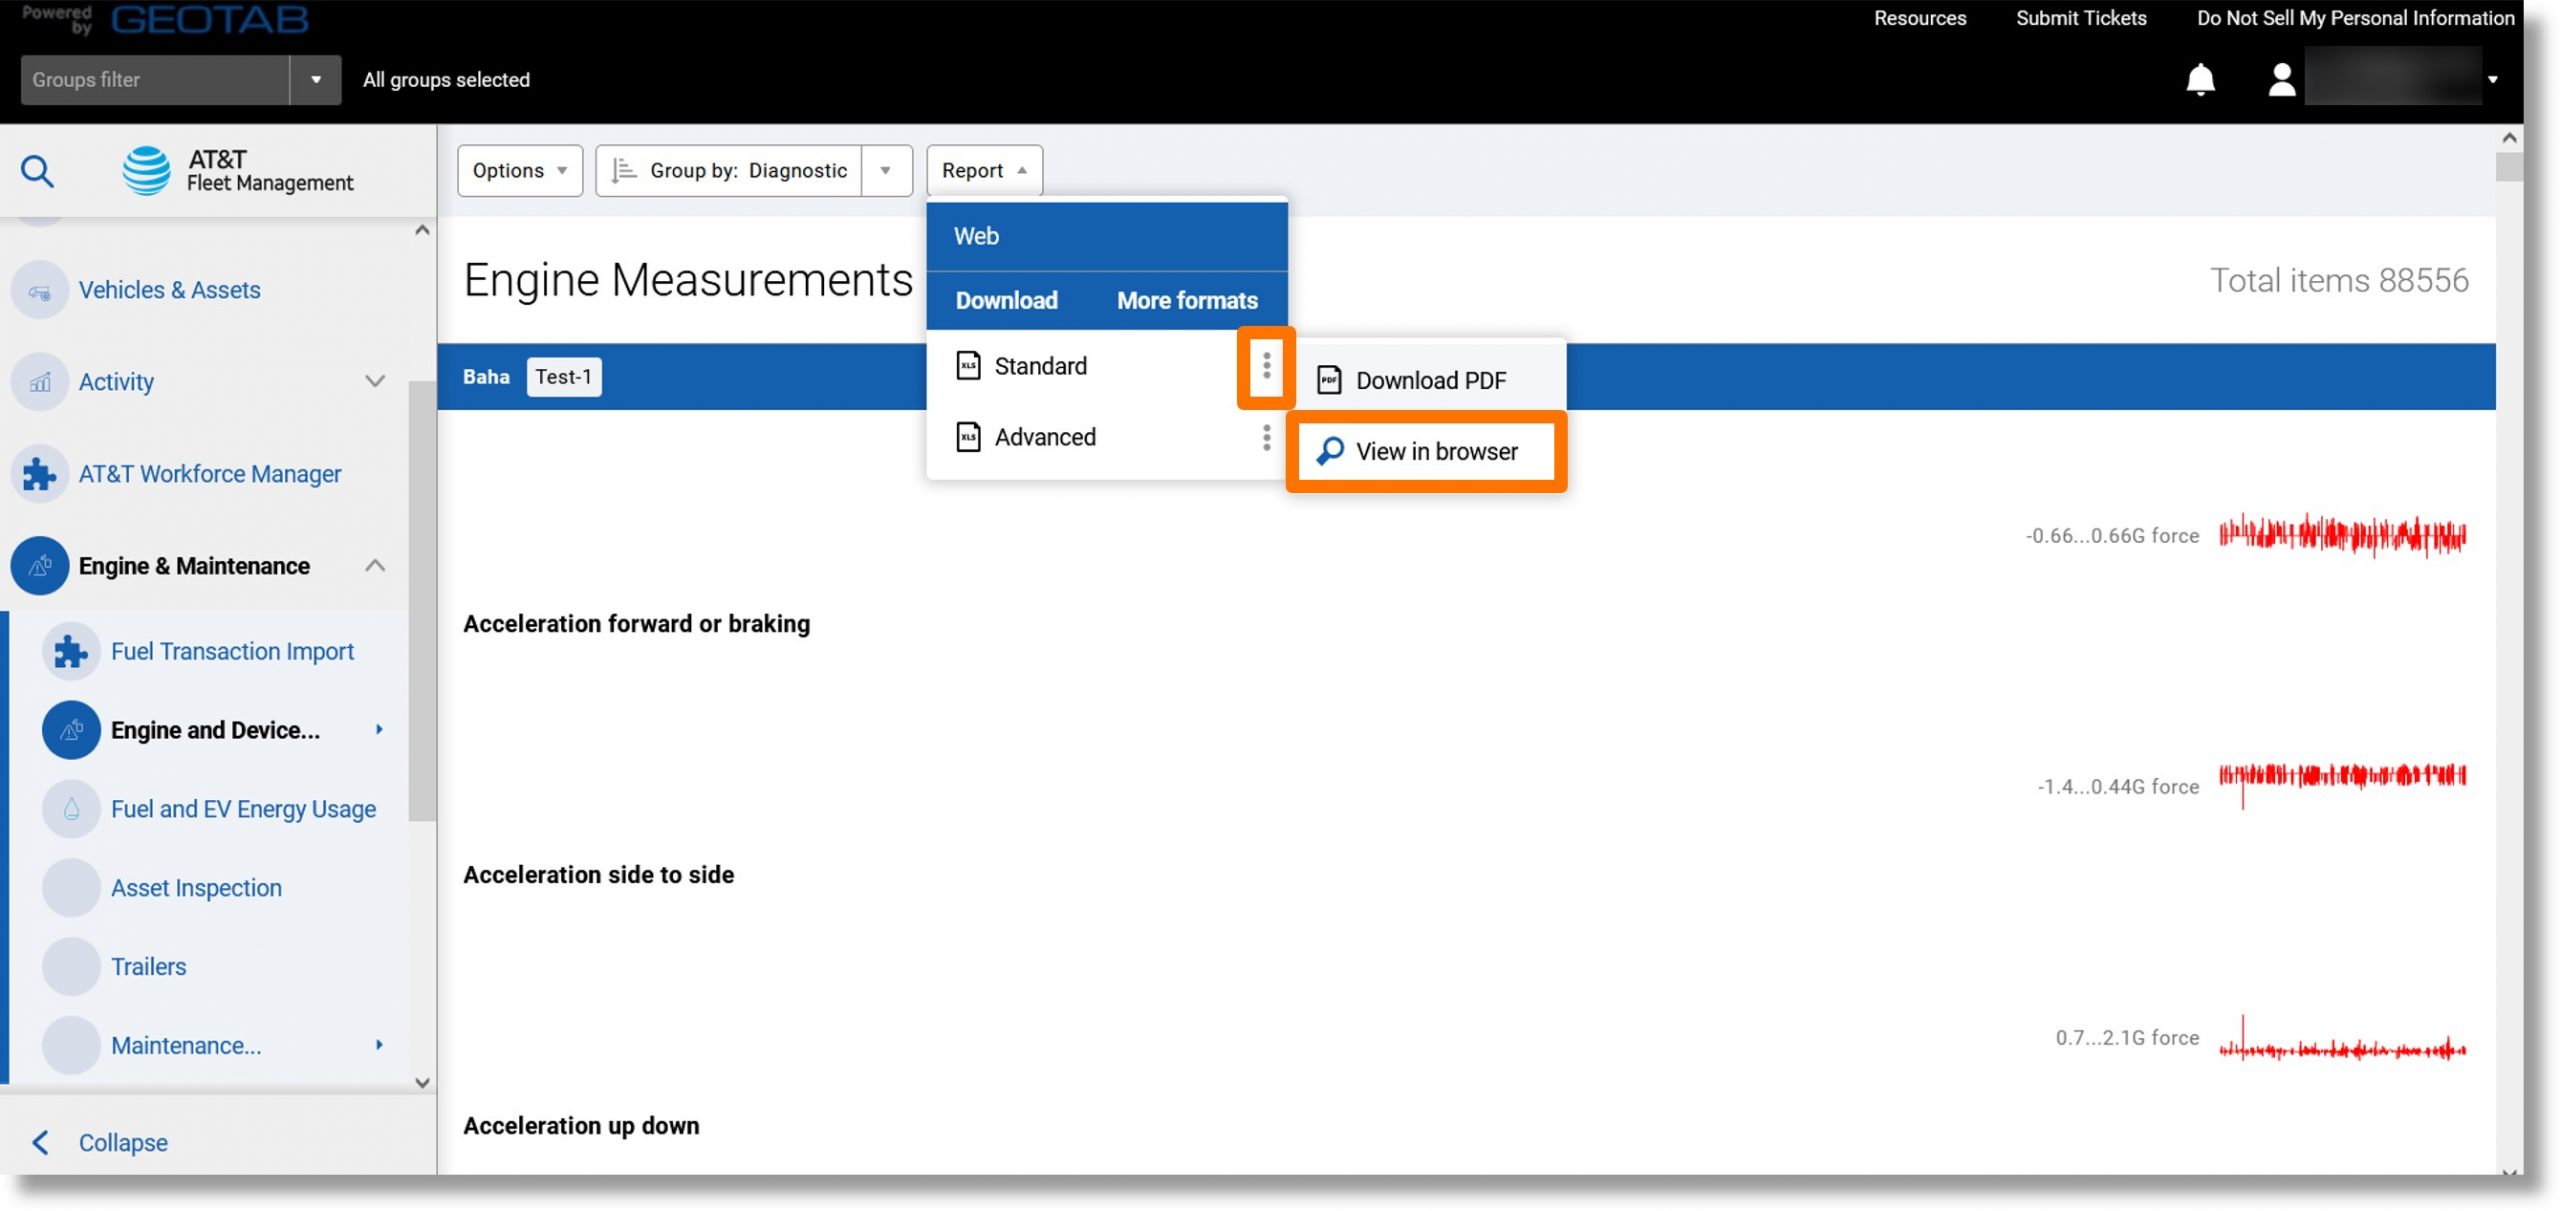
- The Engine Measurements report displays.
Top
Fuel and EV Energy Usage Report
Use: Provides an overview of the amount of fuel used in a selected time period.
Information included: Miles per gallon, fuel used, and the distance traveled.
Additional Information when exported: Fuel economy metric, fuel economy (US), etc.
Accessing the report:
- Click on Engine & Maintenance in the column on the left and scroll down.
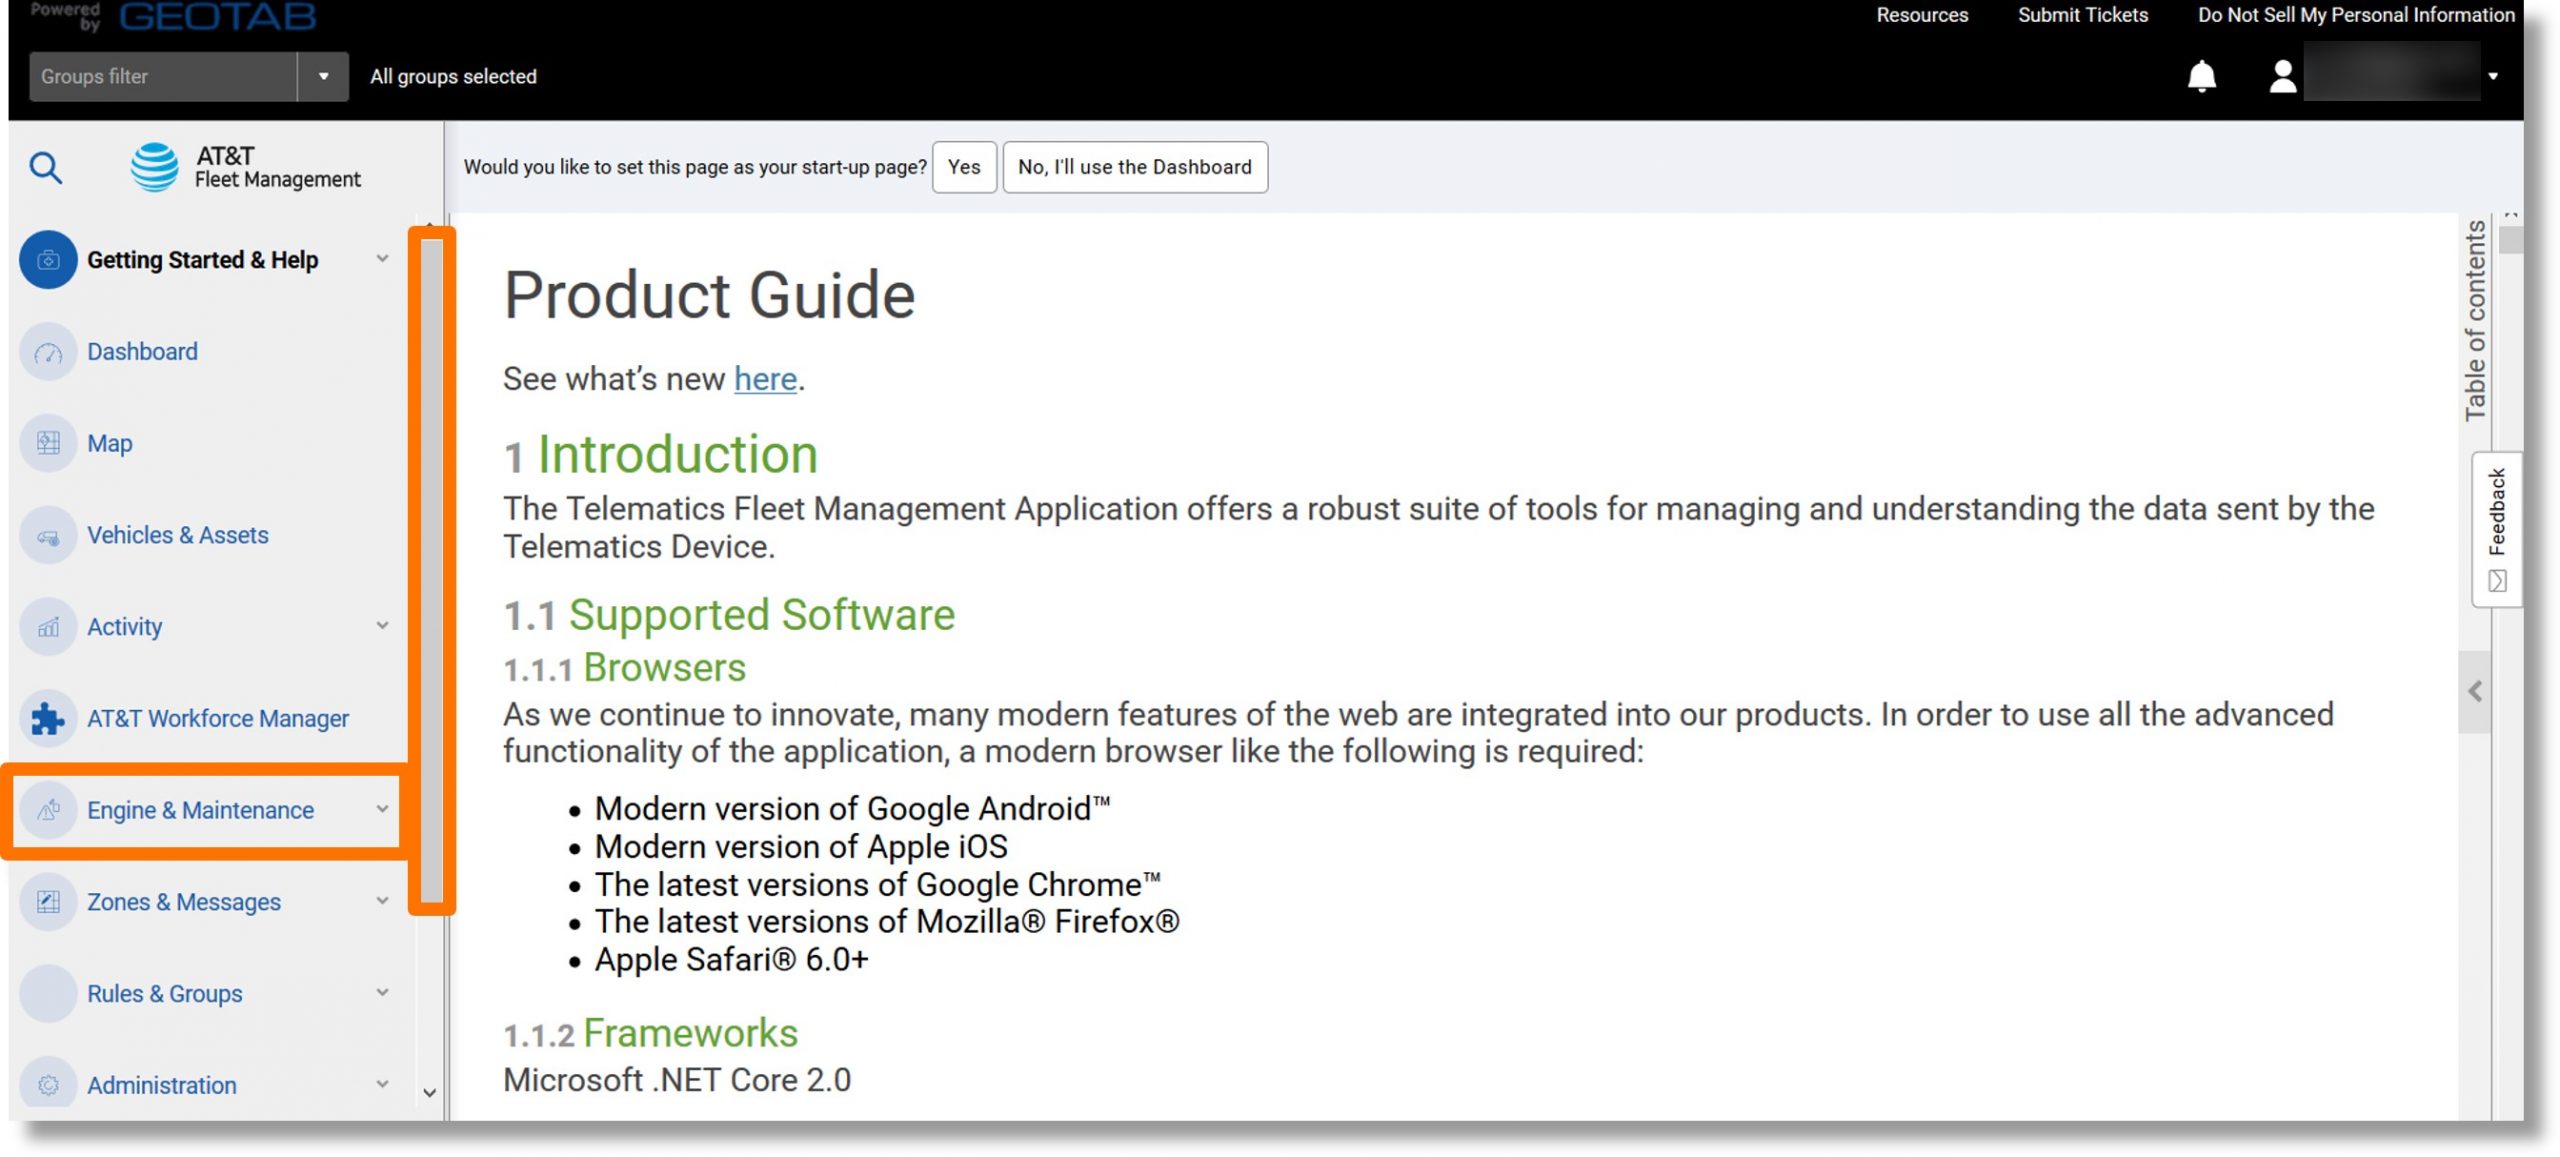
- Click on Fuel and EV Energy Usage.
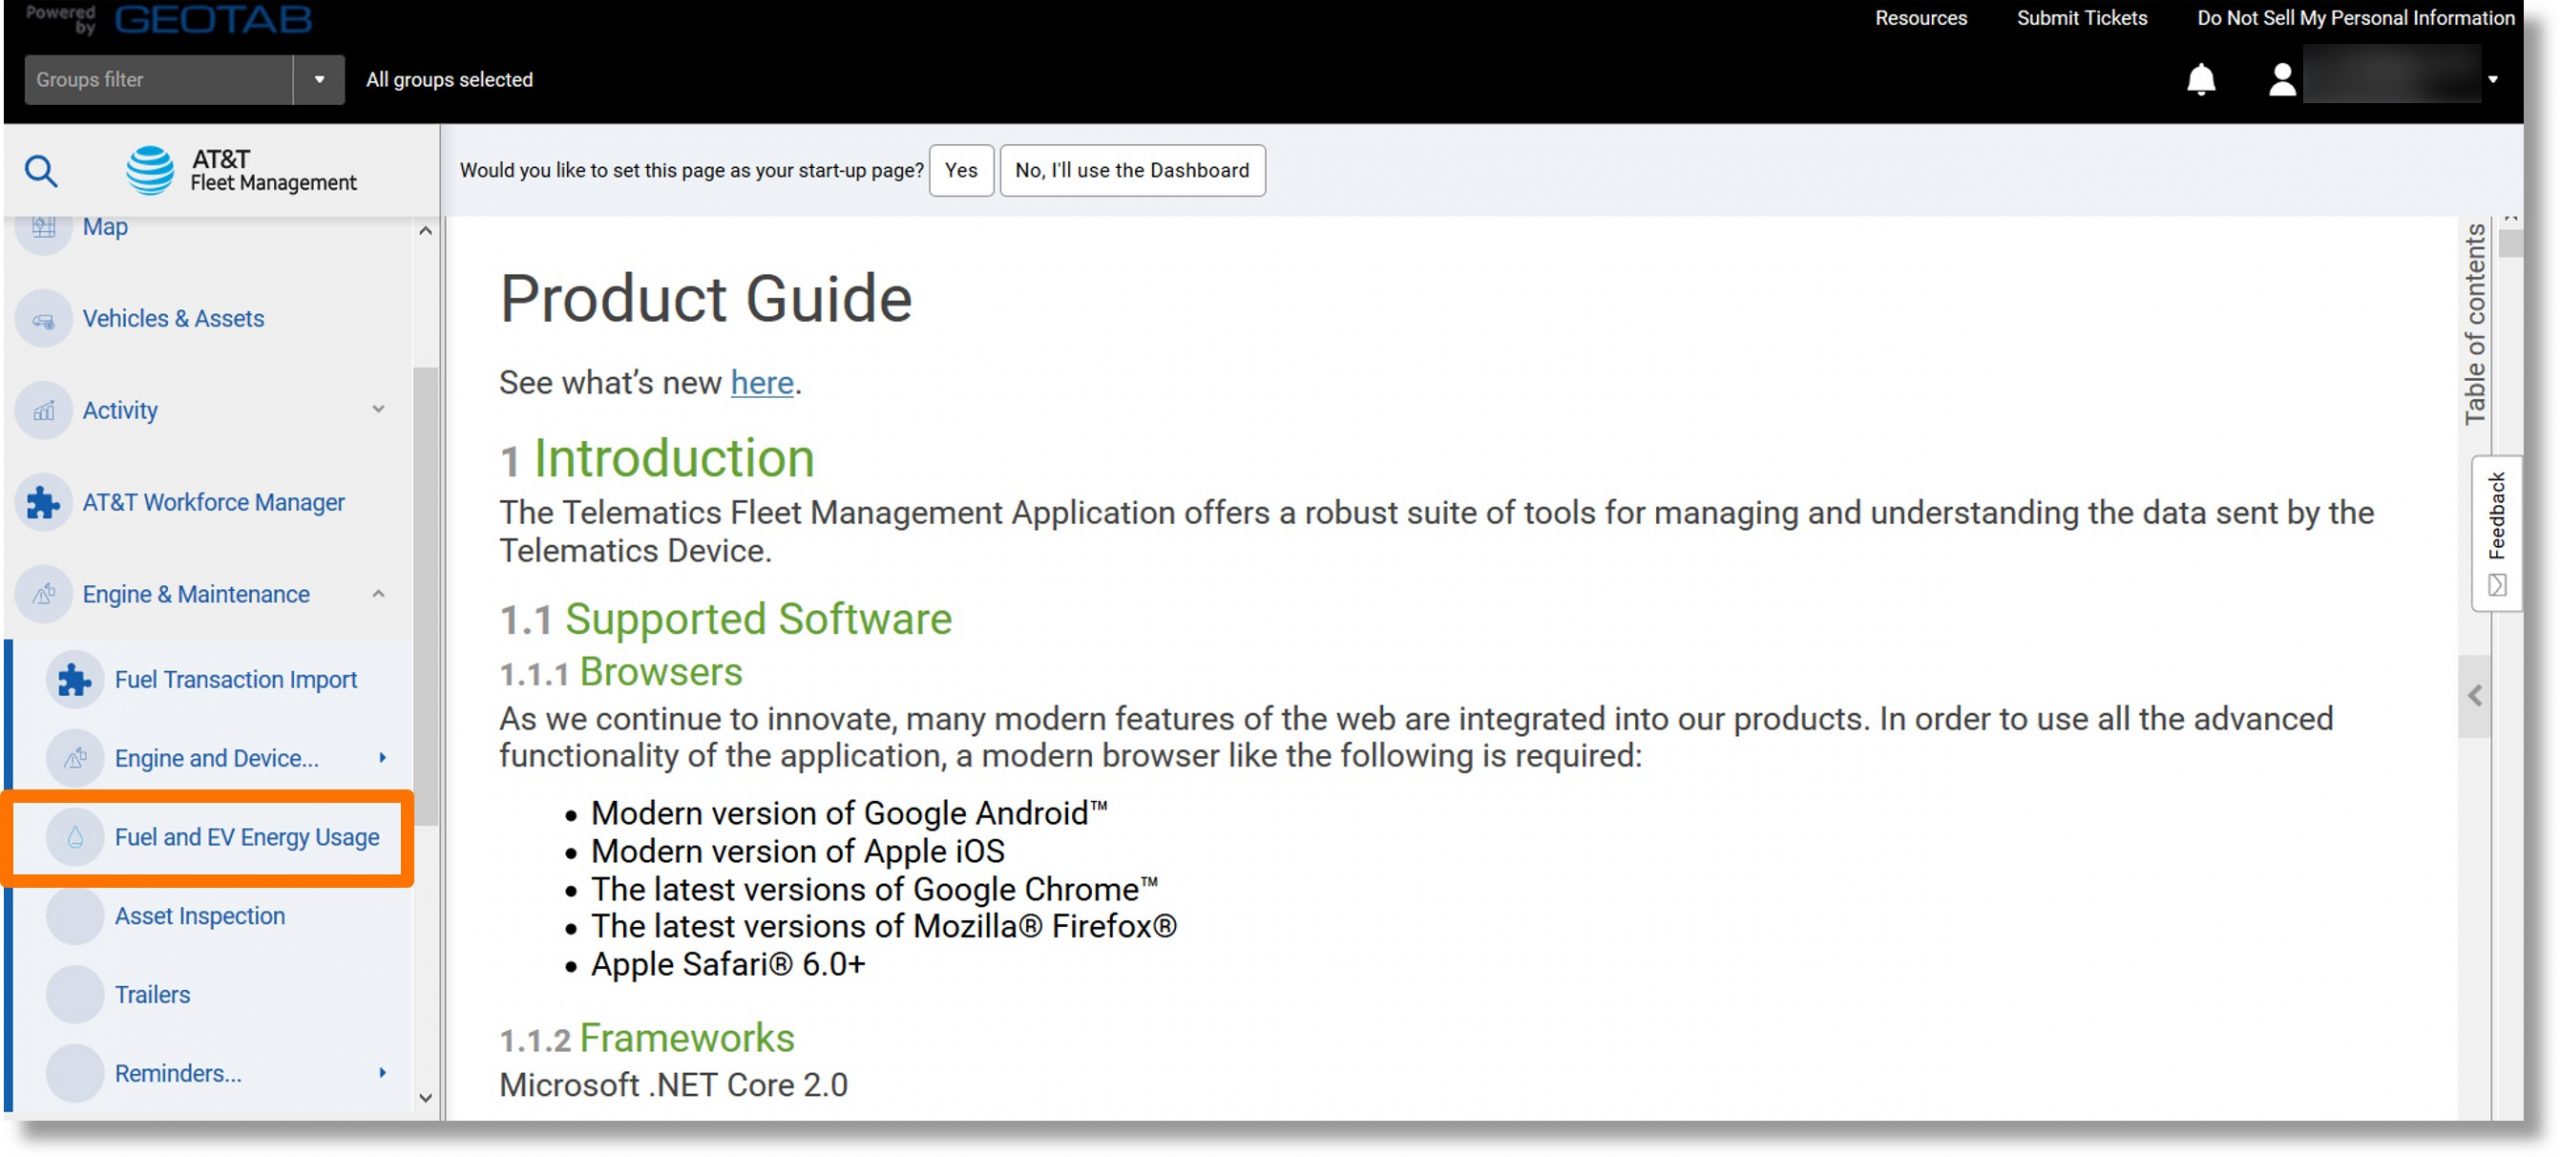
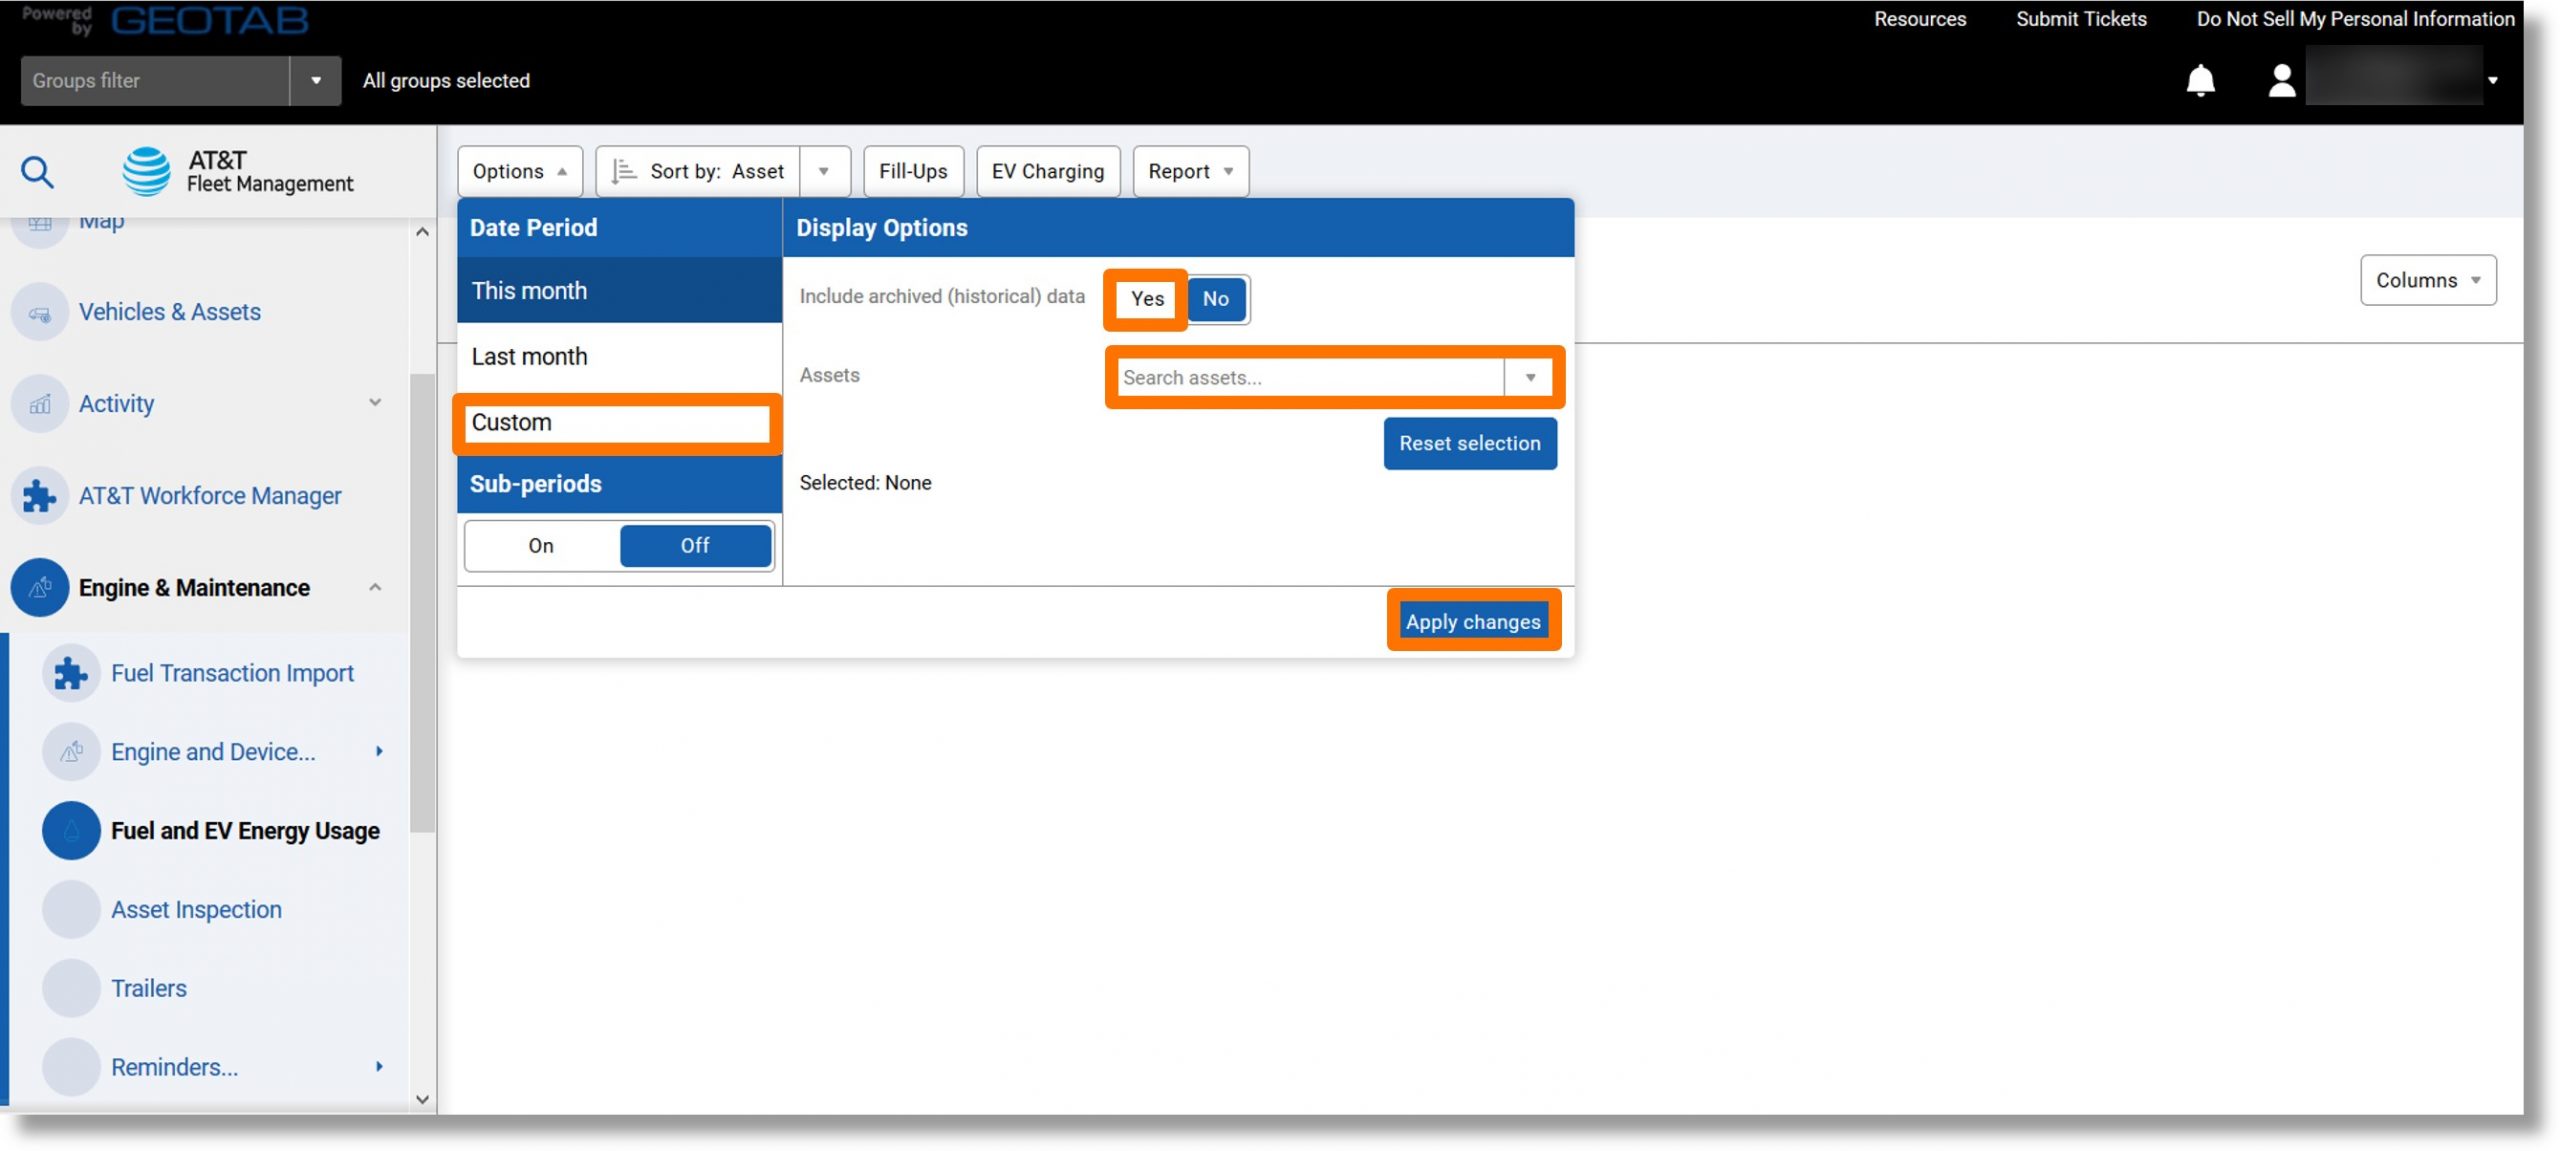
- Click on the desired range under “DATE PERIOD”.
- Click on the On or Off button under “SUB-PERIODS”.
- Click on the desired sub-timeframe.
- Click on the Yes or No button to the right of “Include archived (historical) data”.
- Click on the dropdown menu to the right of “Assets”.
- Click on the desired vehicle.
- Click the Apply changes button.
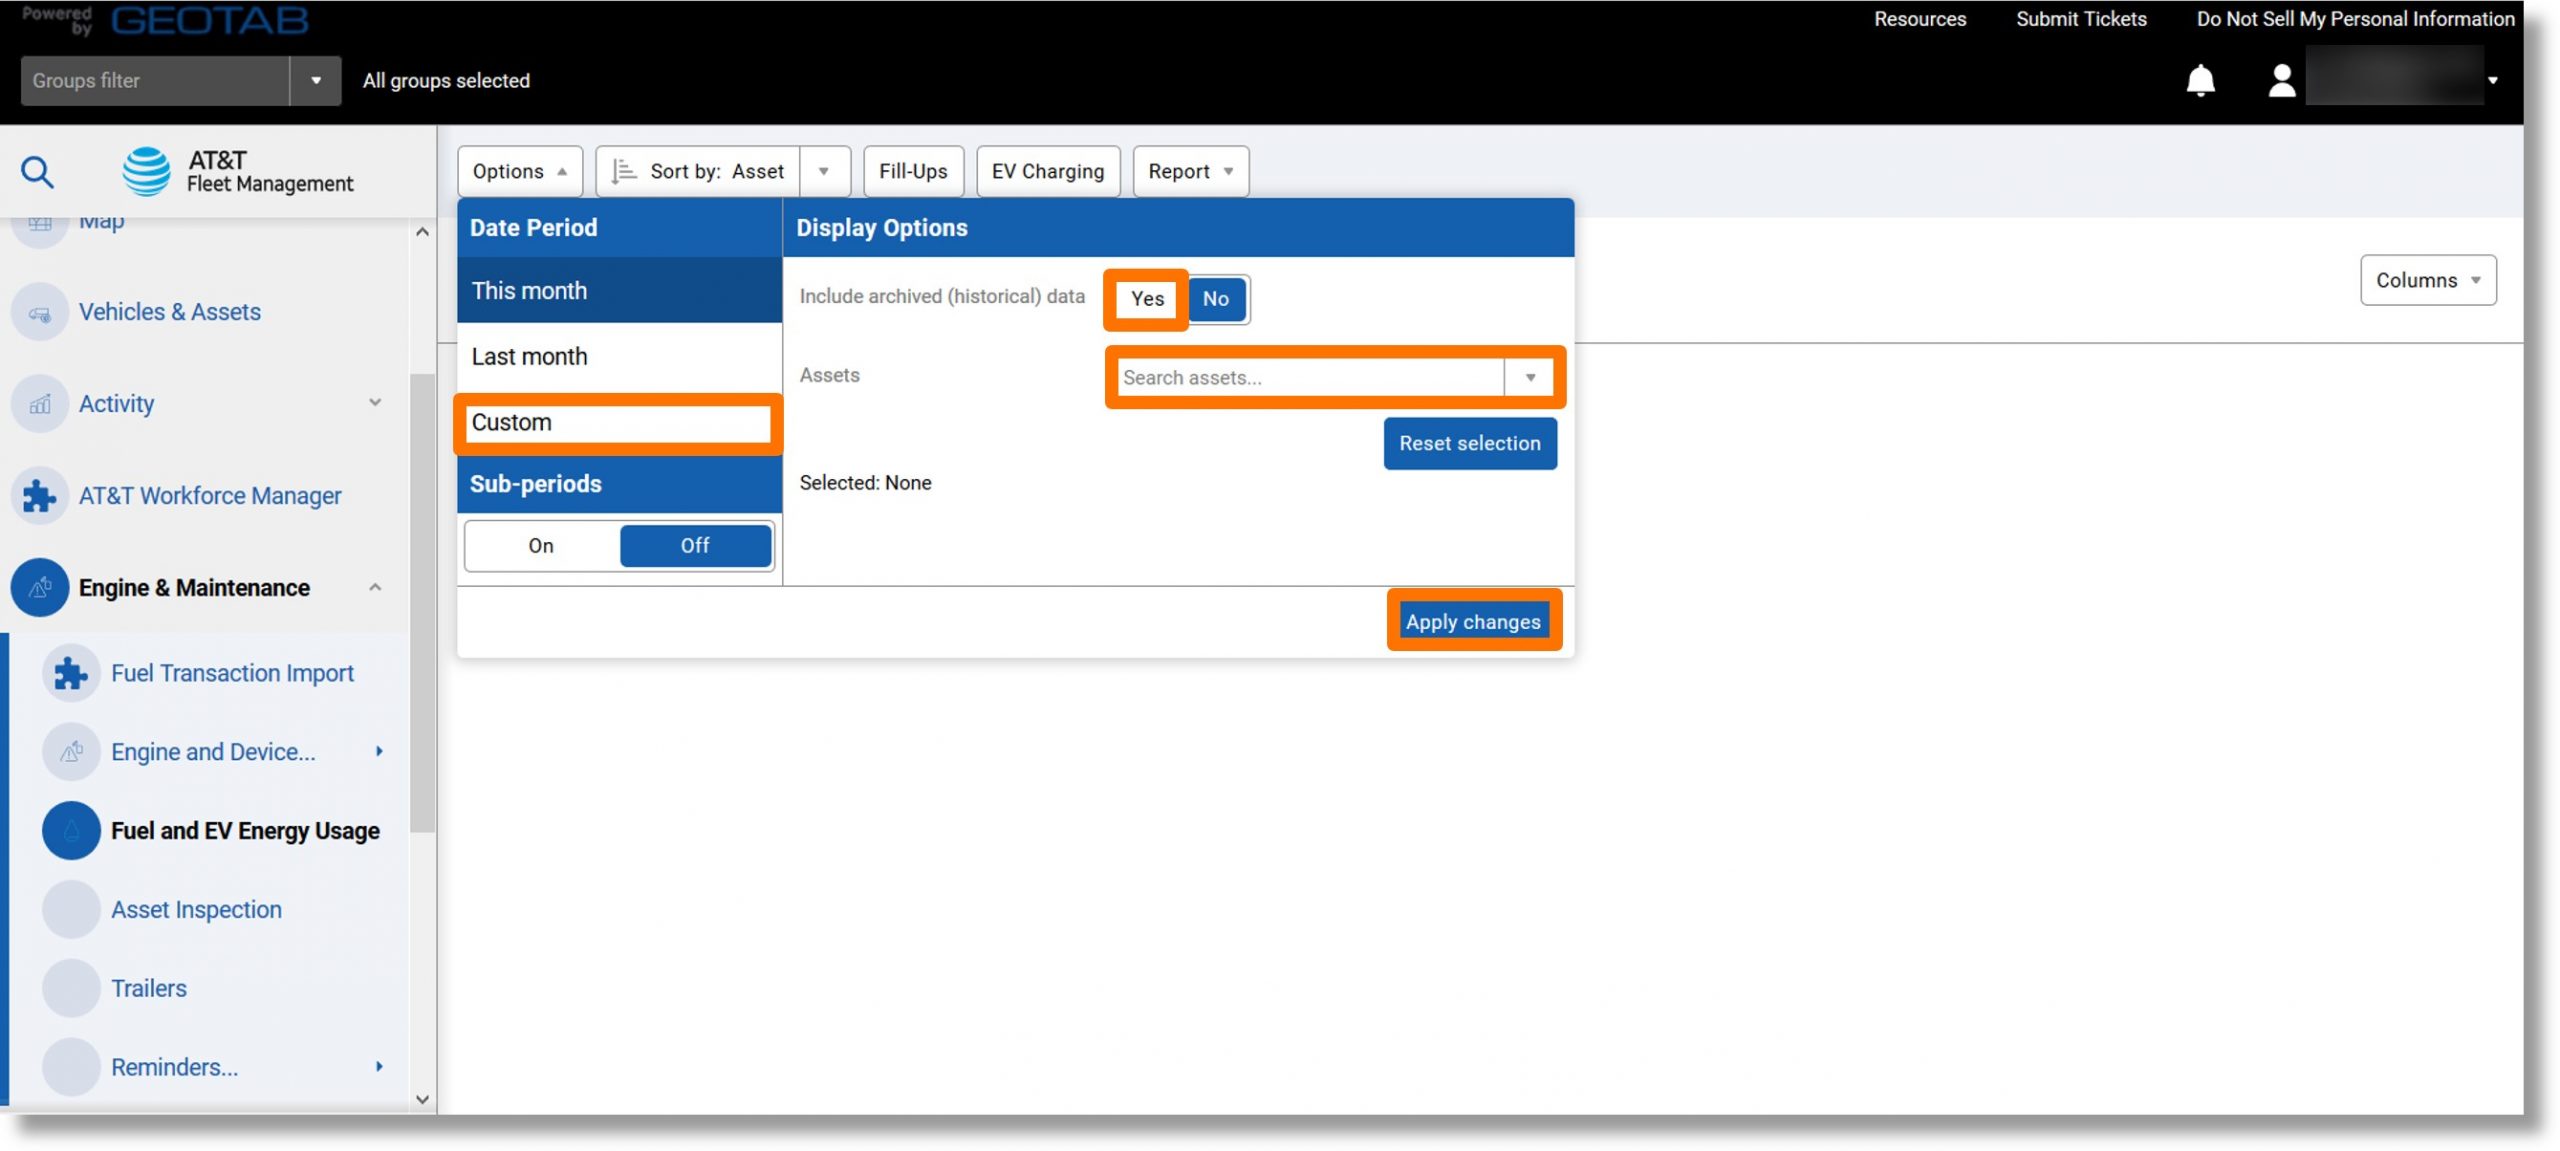
- Click on the Reports dropdown.
- Click on the ellipsis icon
 to the right of either “Standard”, “Advanced”, or “Average Fuel Economy”.
- Click on View in browser.
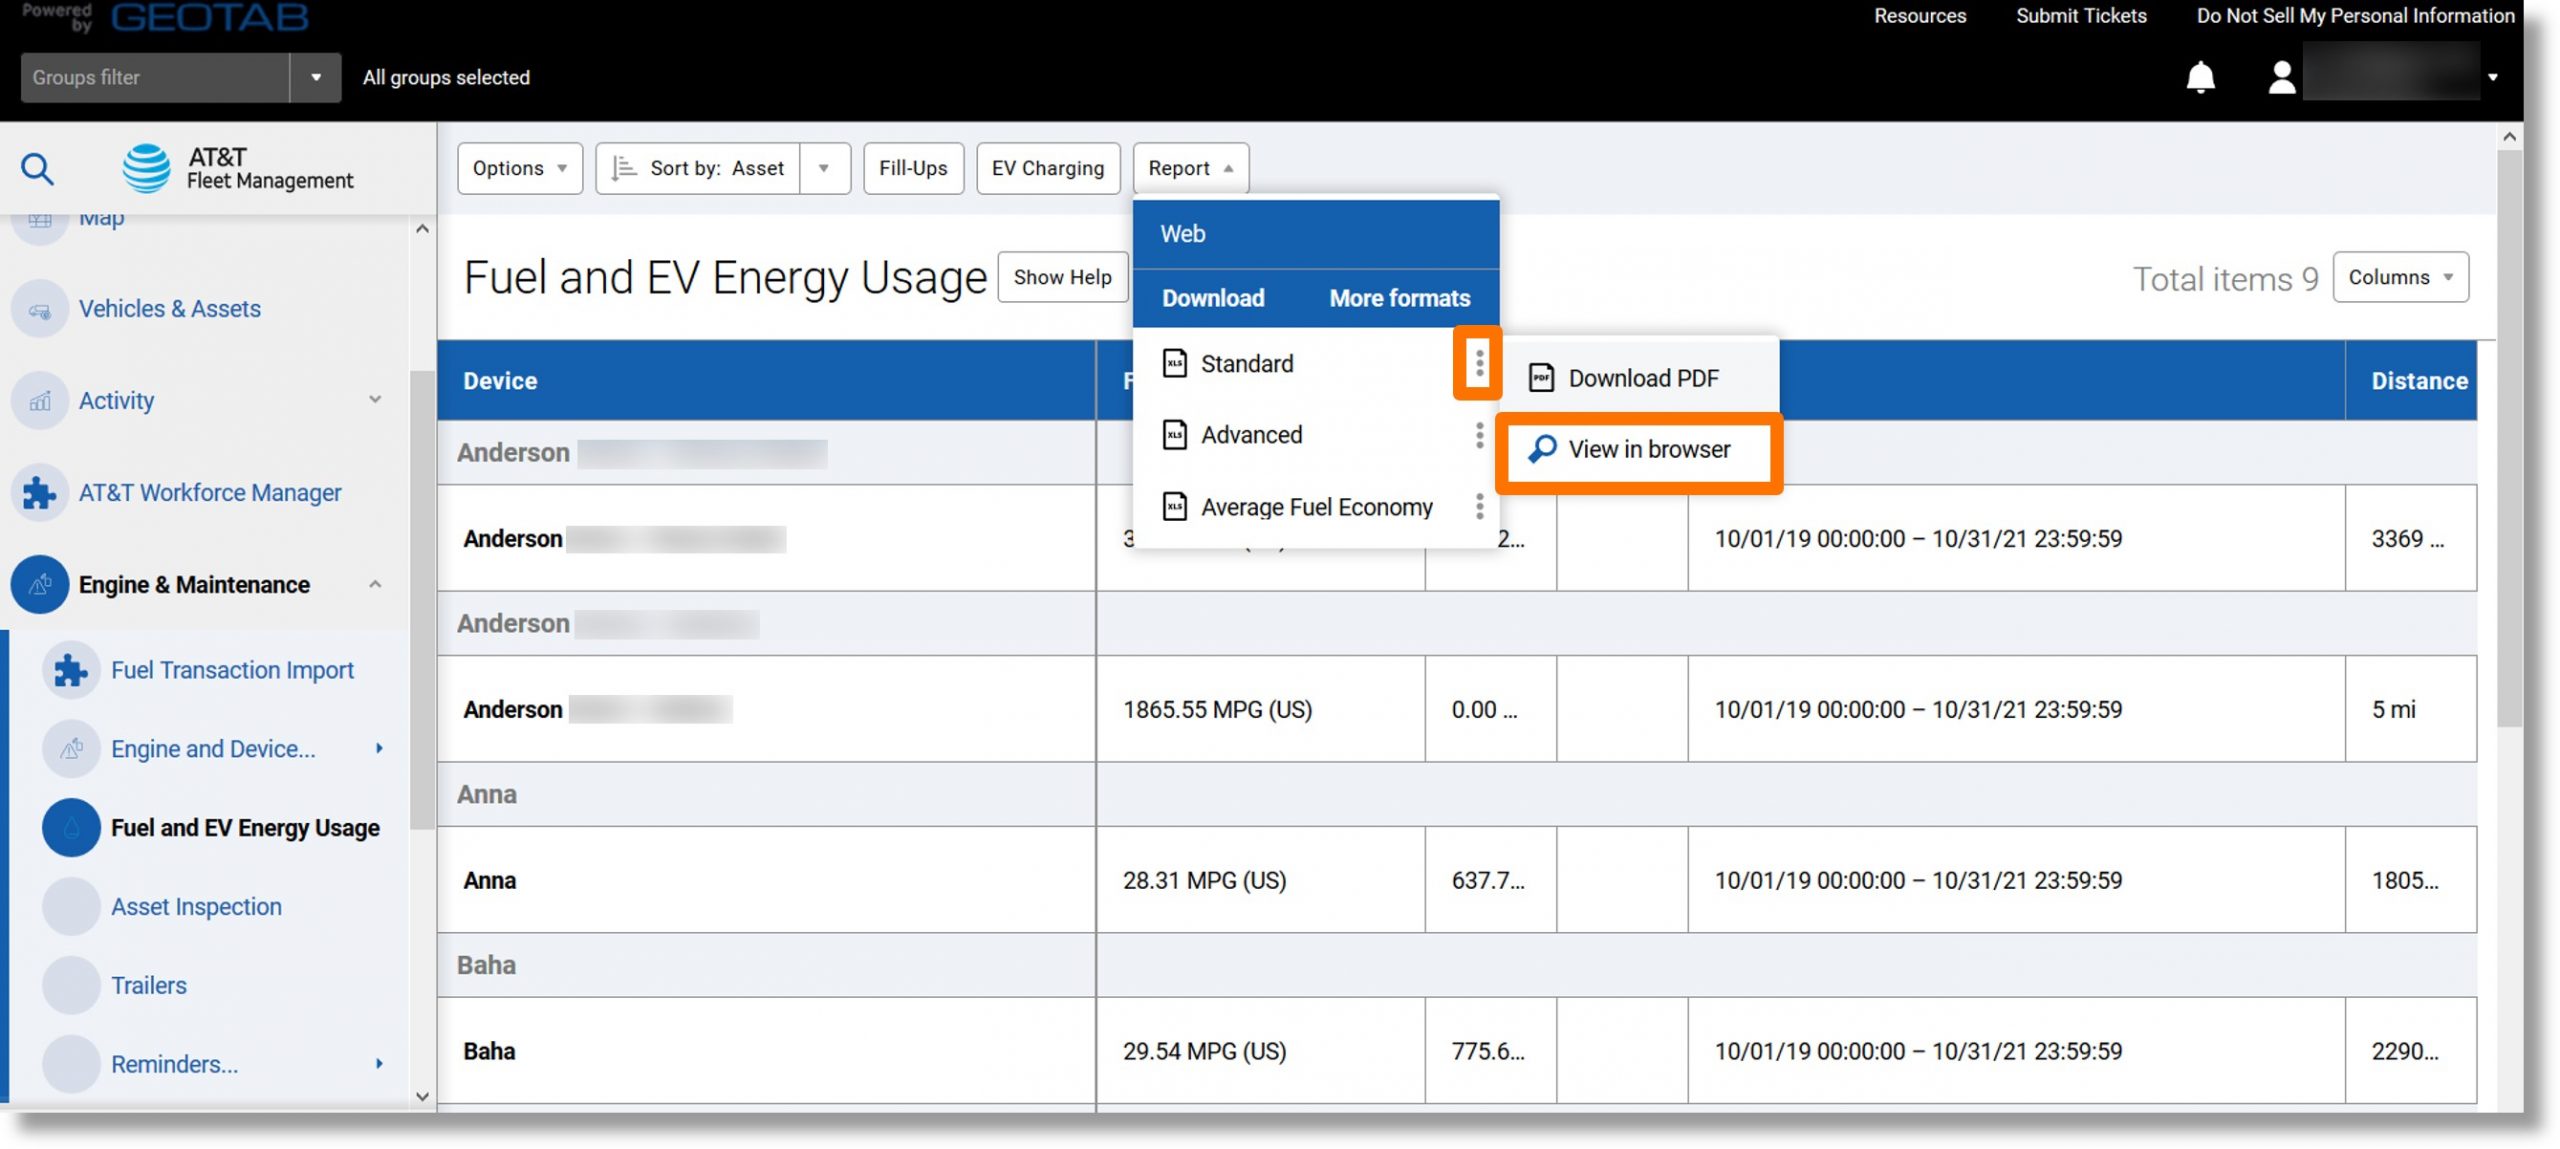
- The Fuel and EV Energy Usage overview displays.
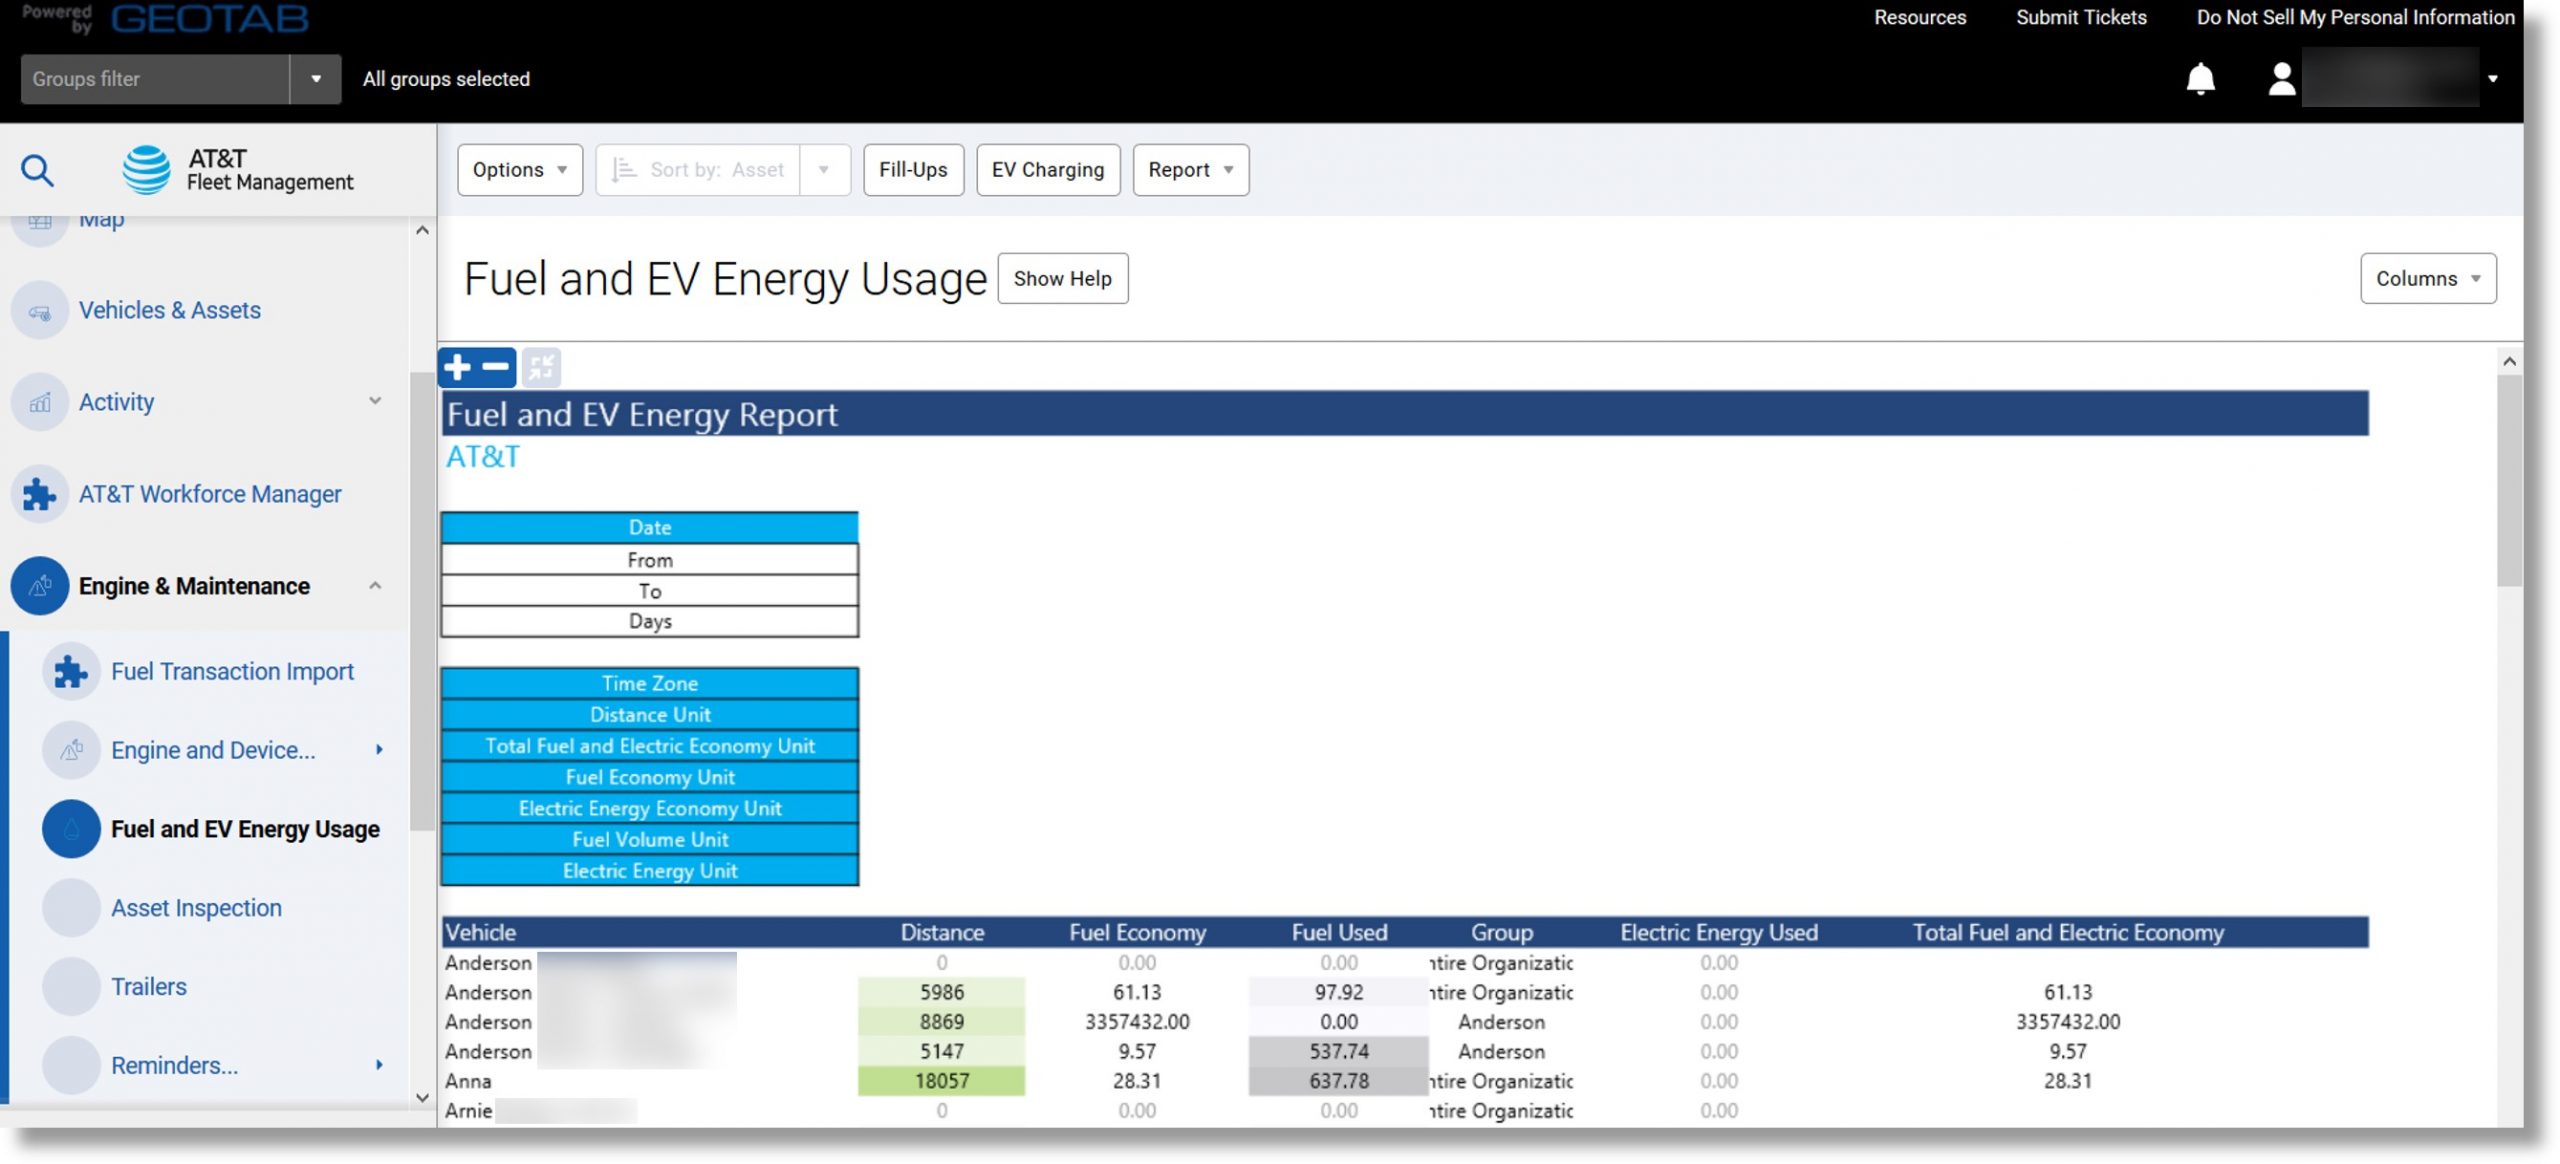
Top
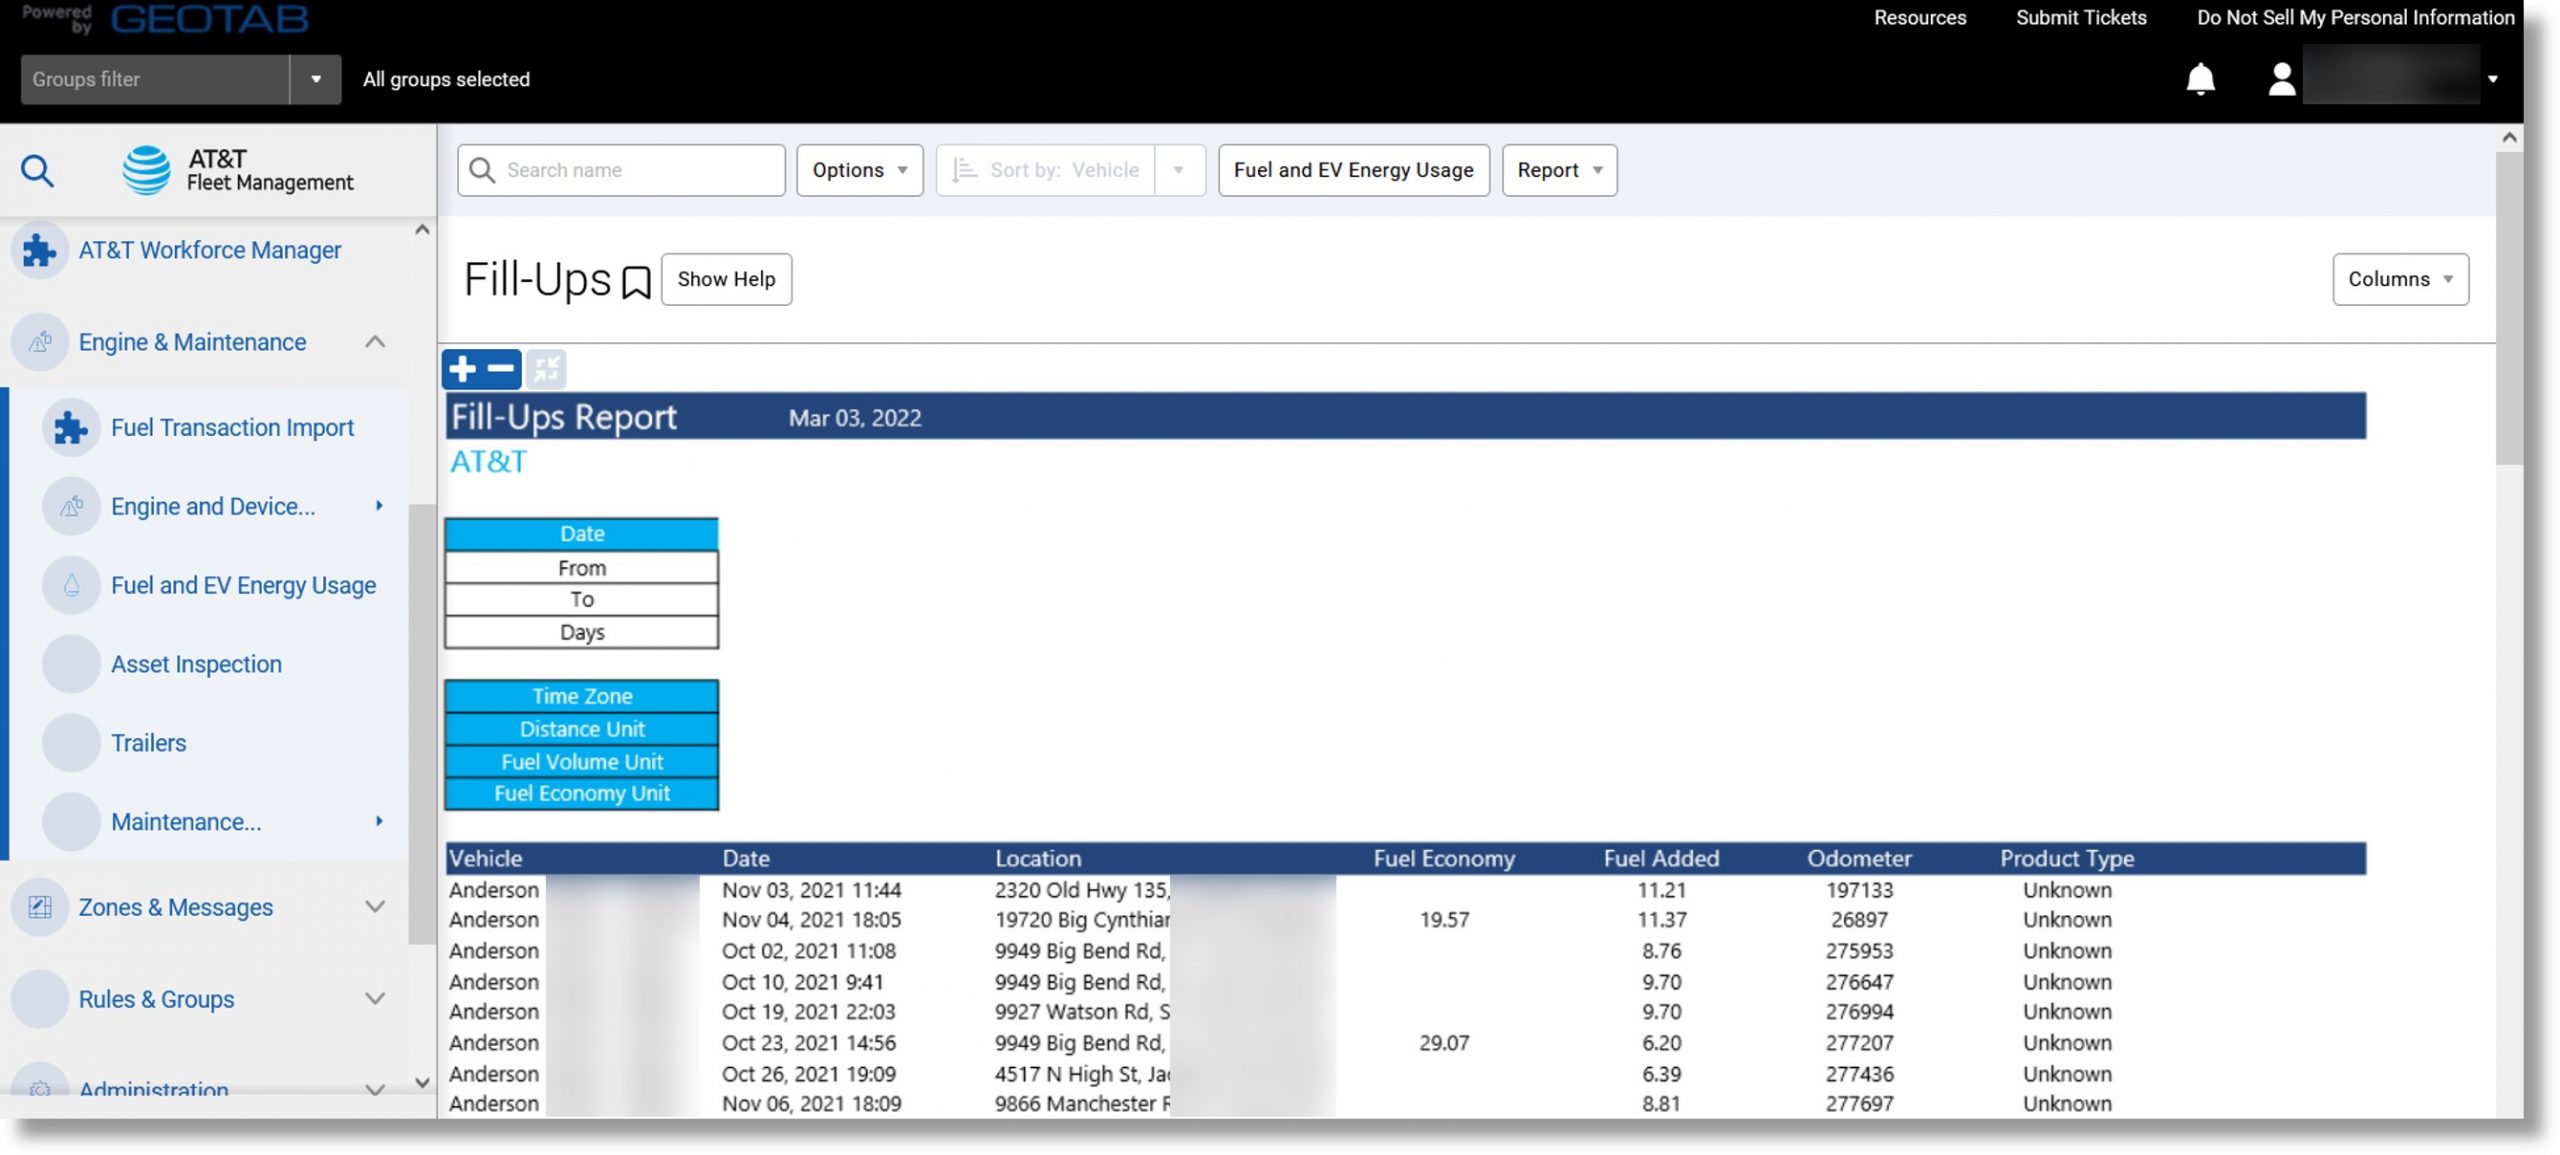
Fill-Ups Report
Use: Storing and retrieving fuel card data from any vendor and provide basic fill up data if you’re not using a fuel card at all. The fill-ups graph displays the running fuel-in and fuel-out for a vehicle for a period of time.
Information included: Date and time of fill-up, fill-up location, mpg, volume, odometer, cost (if fuel card data included).
Accessing the report:
- Click on Engine & Maintenance in the menu on the left and scroll down.
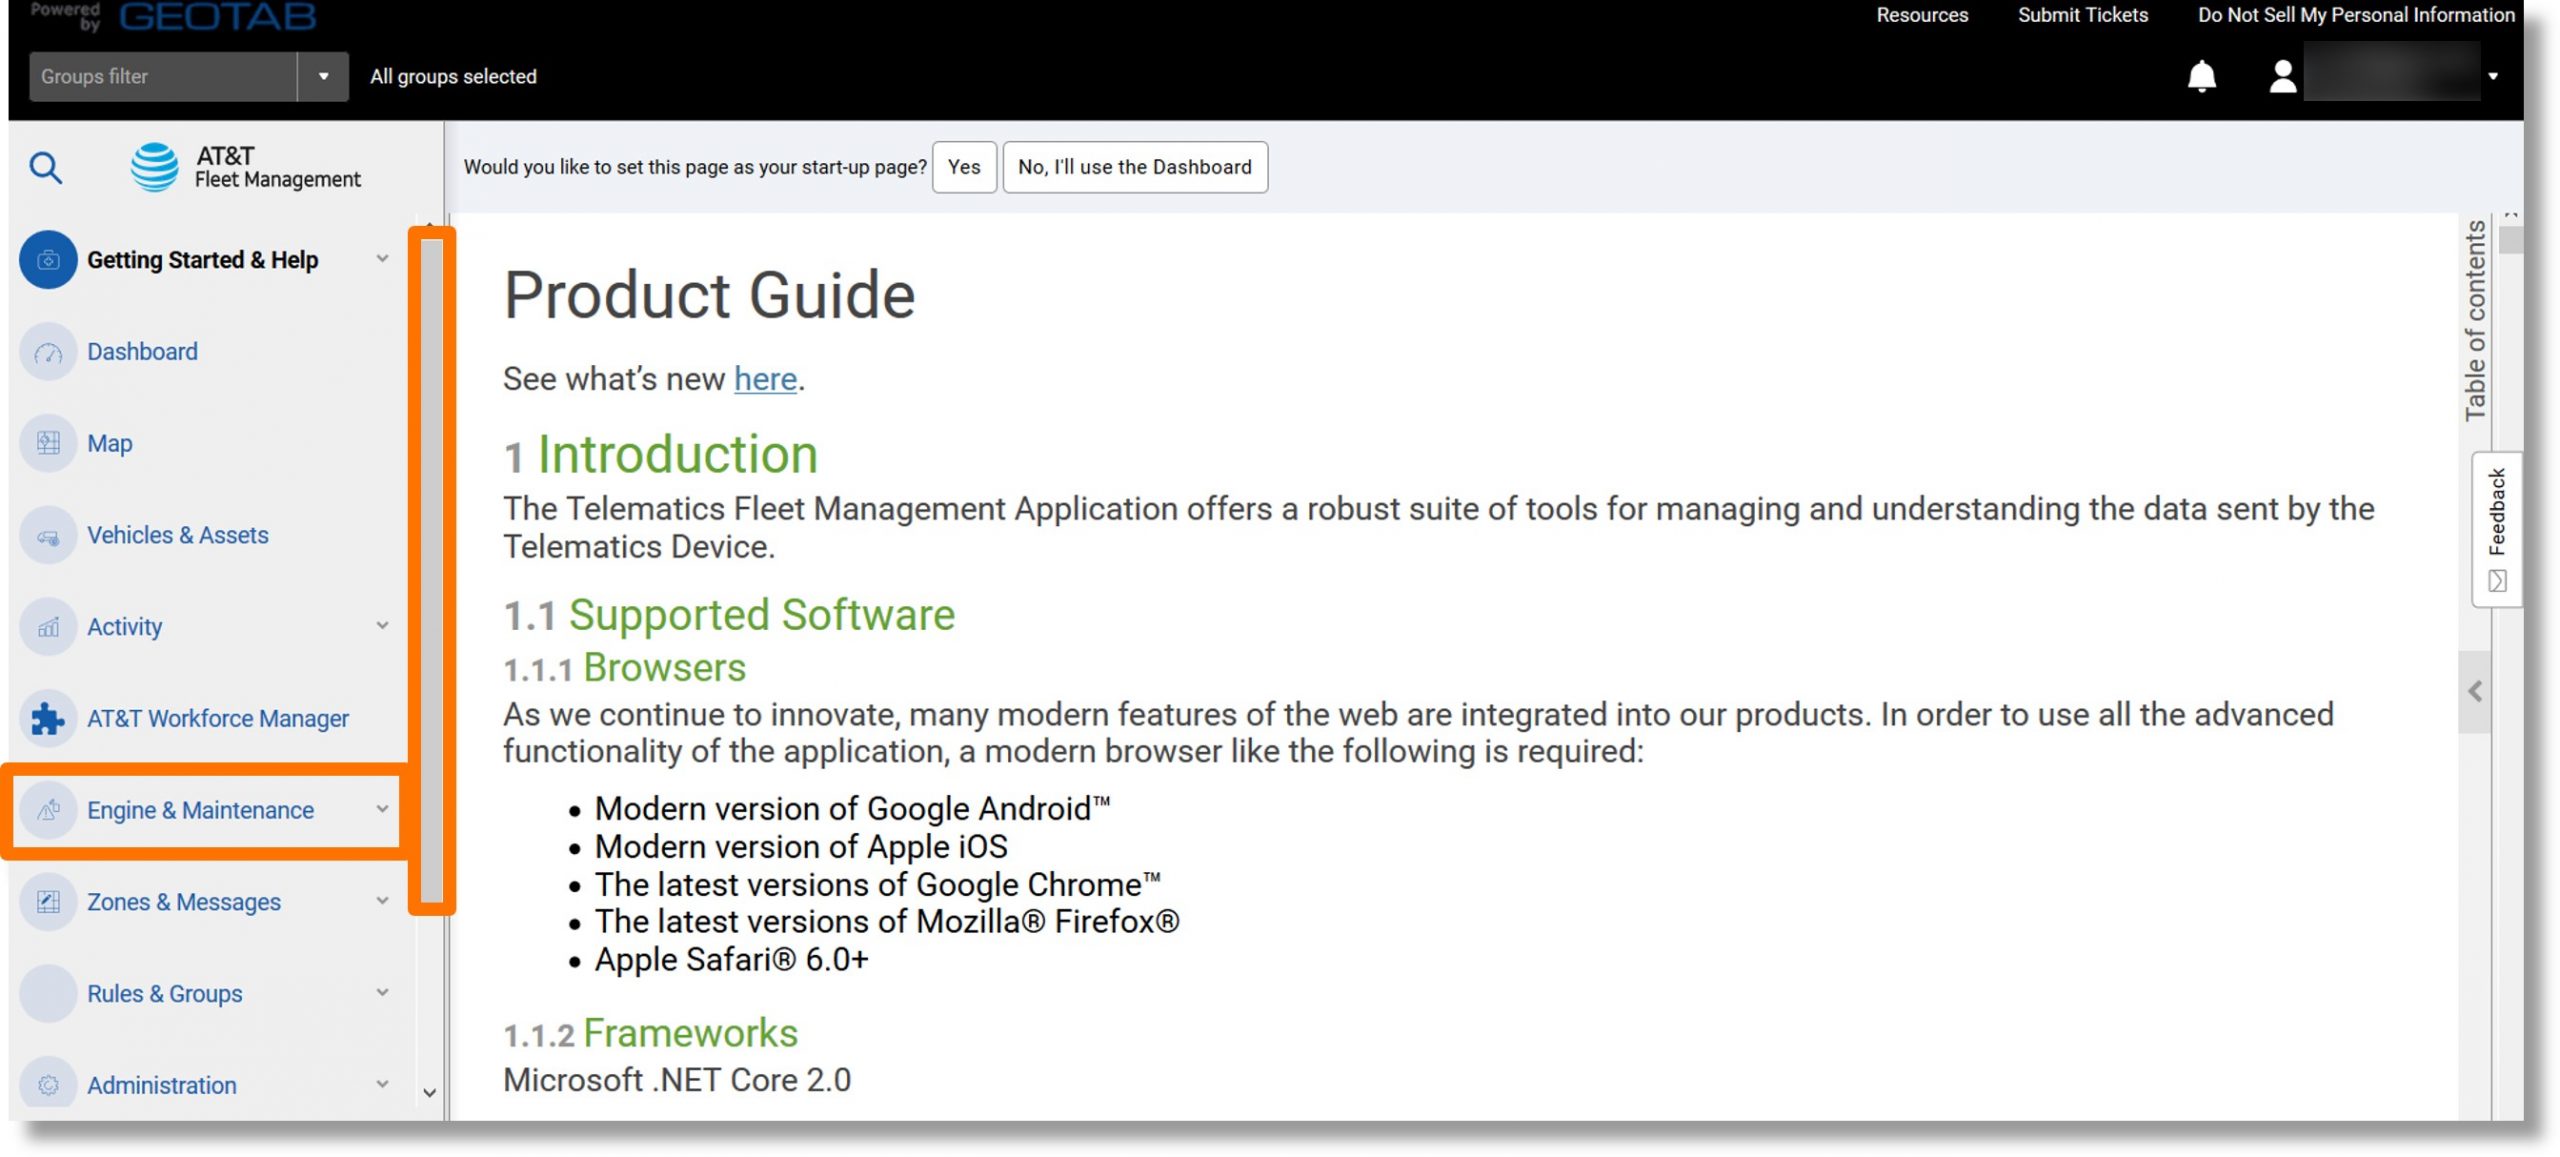
- Click on Fuel and EV Energy Usage.
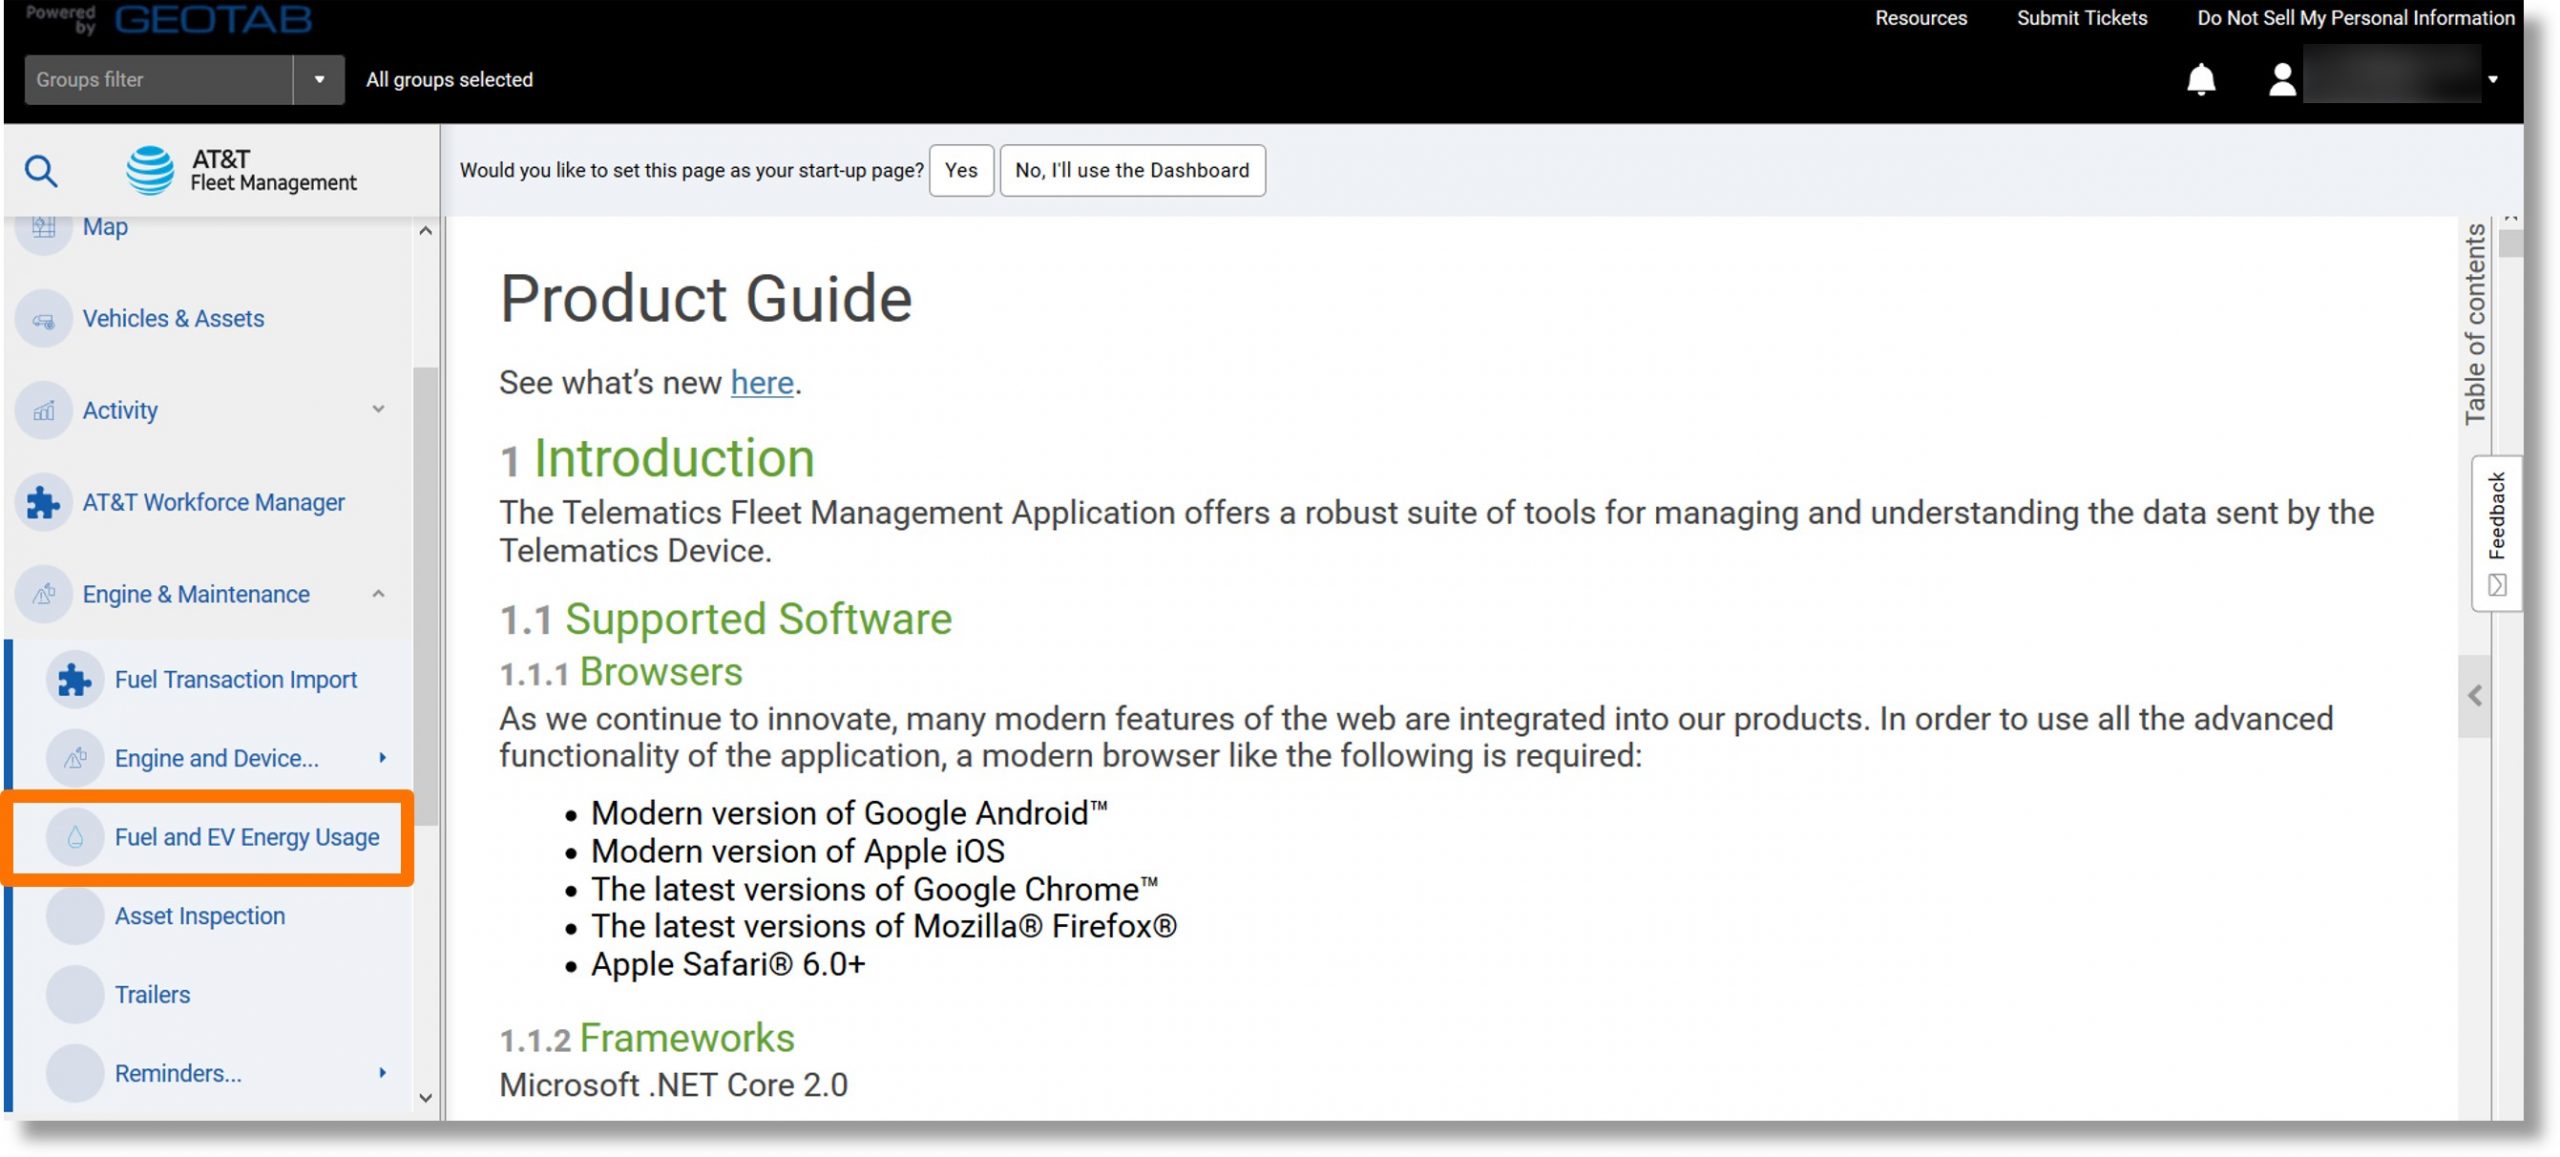
- Select the desired parameters and click on the Apply changes button.
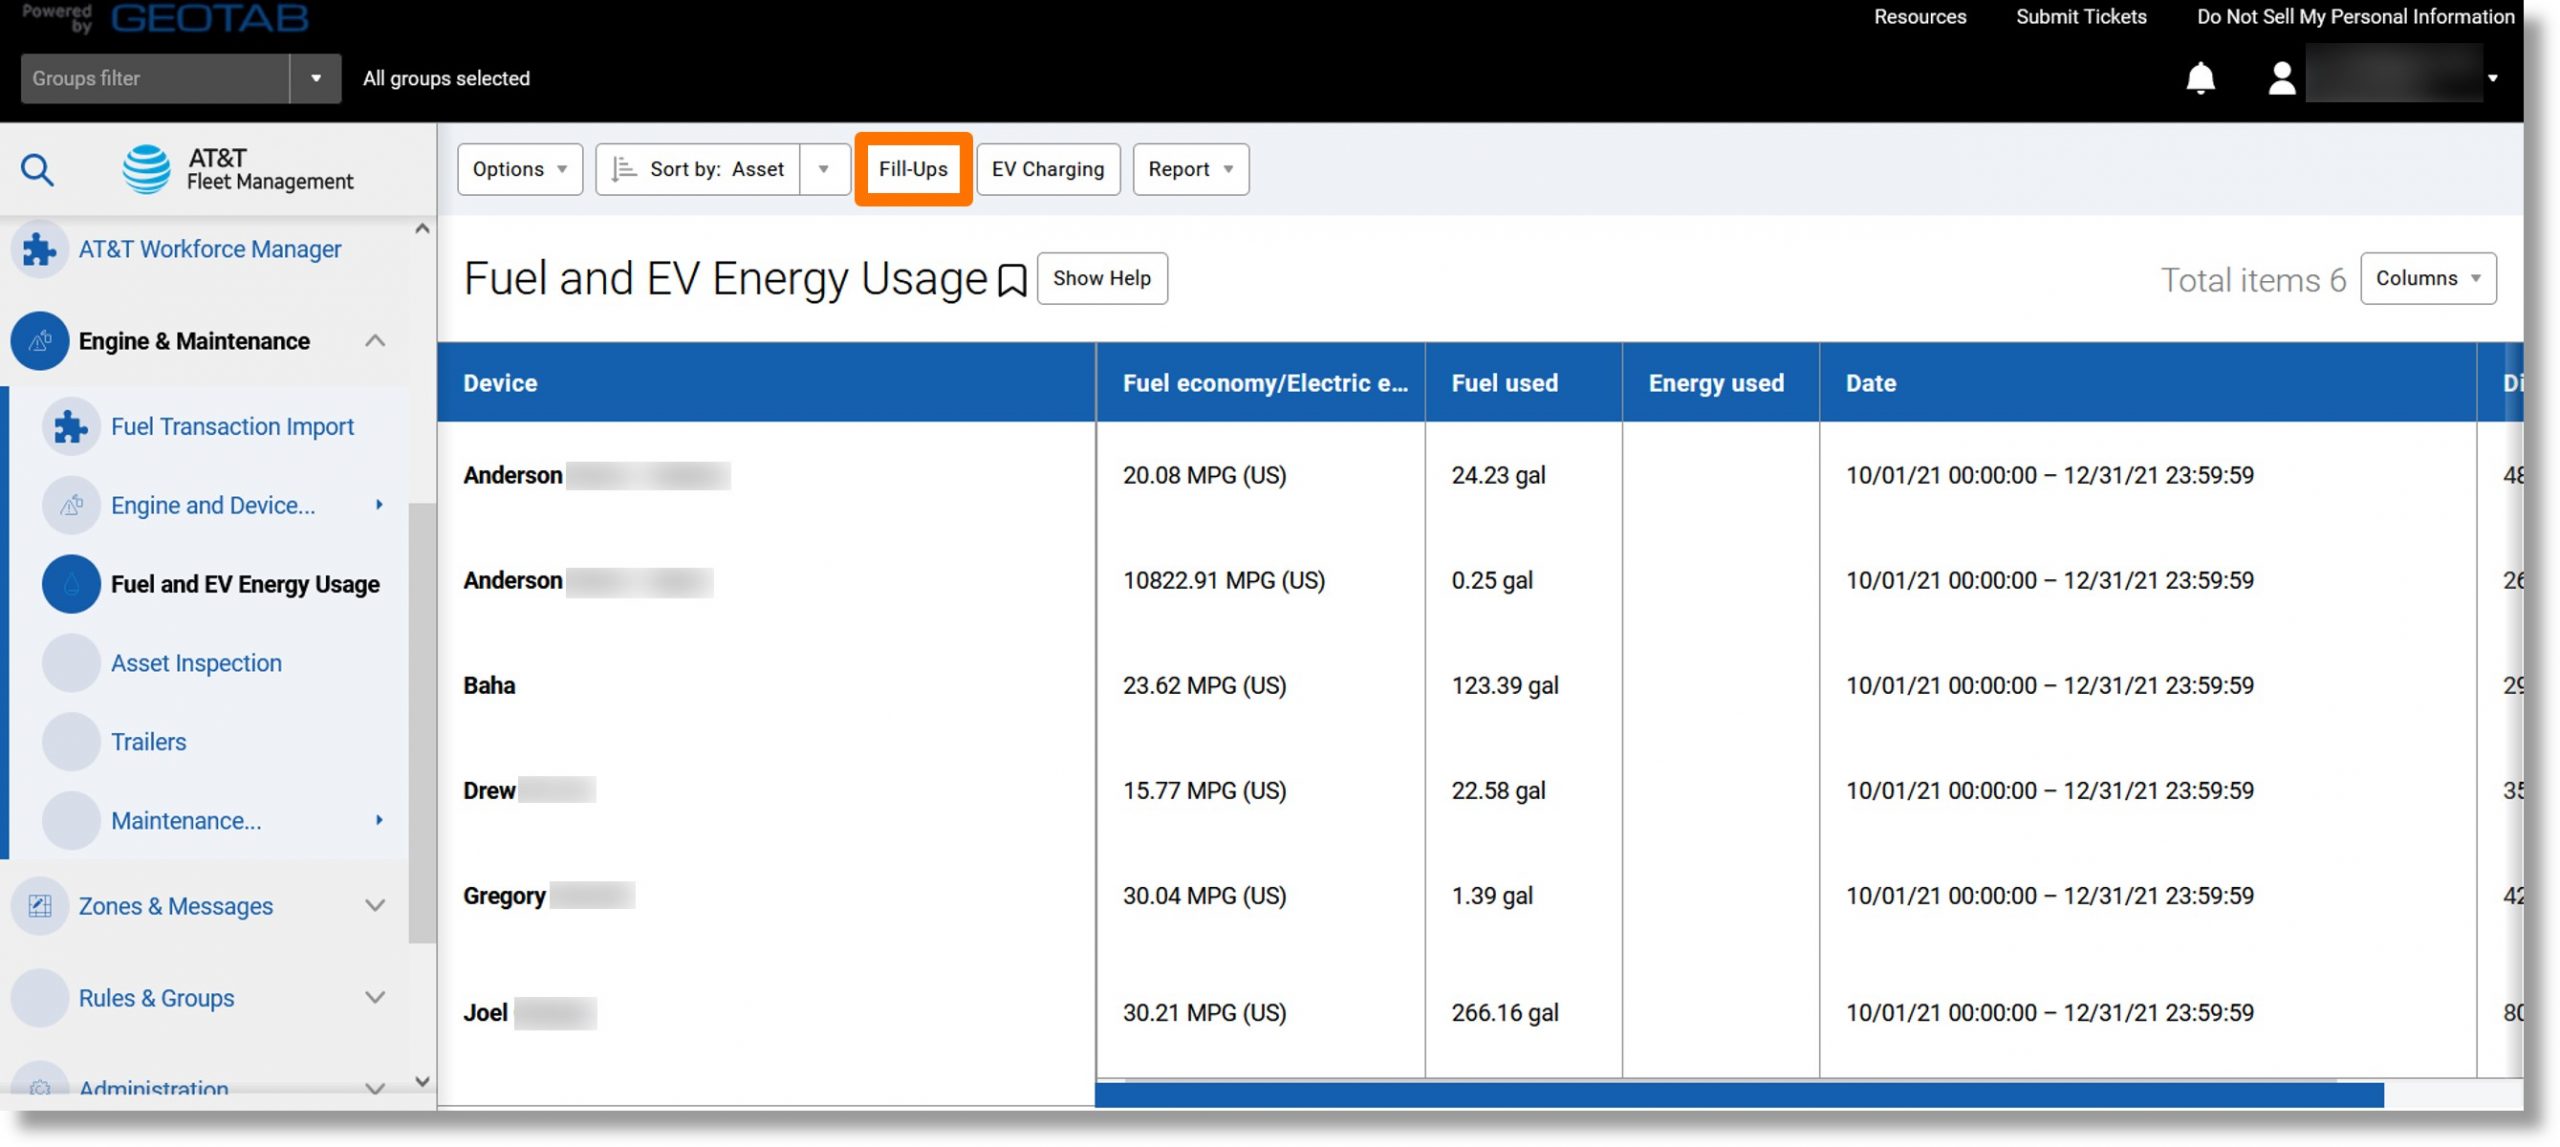
- Click on the Fill-Ups button near the top of the page.
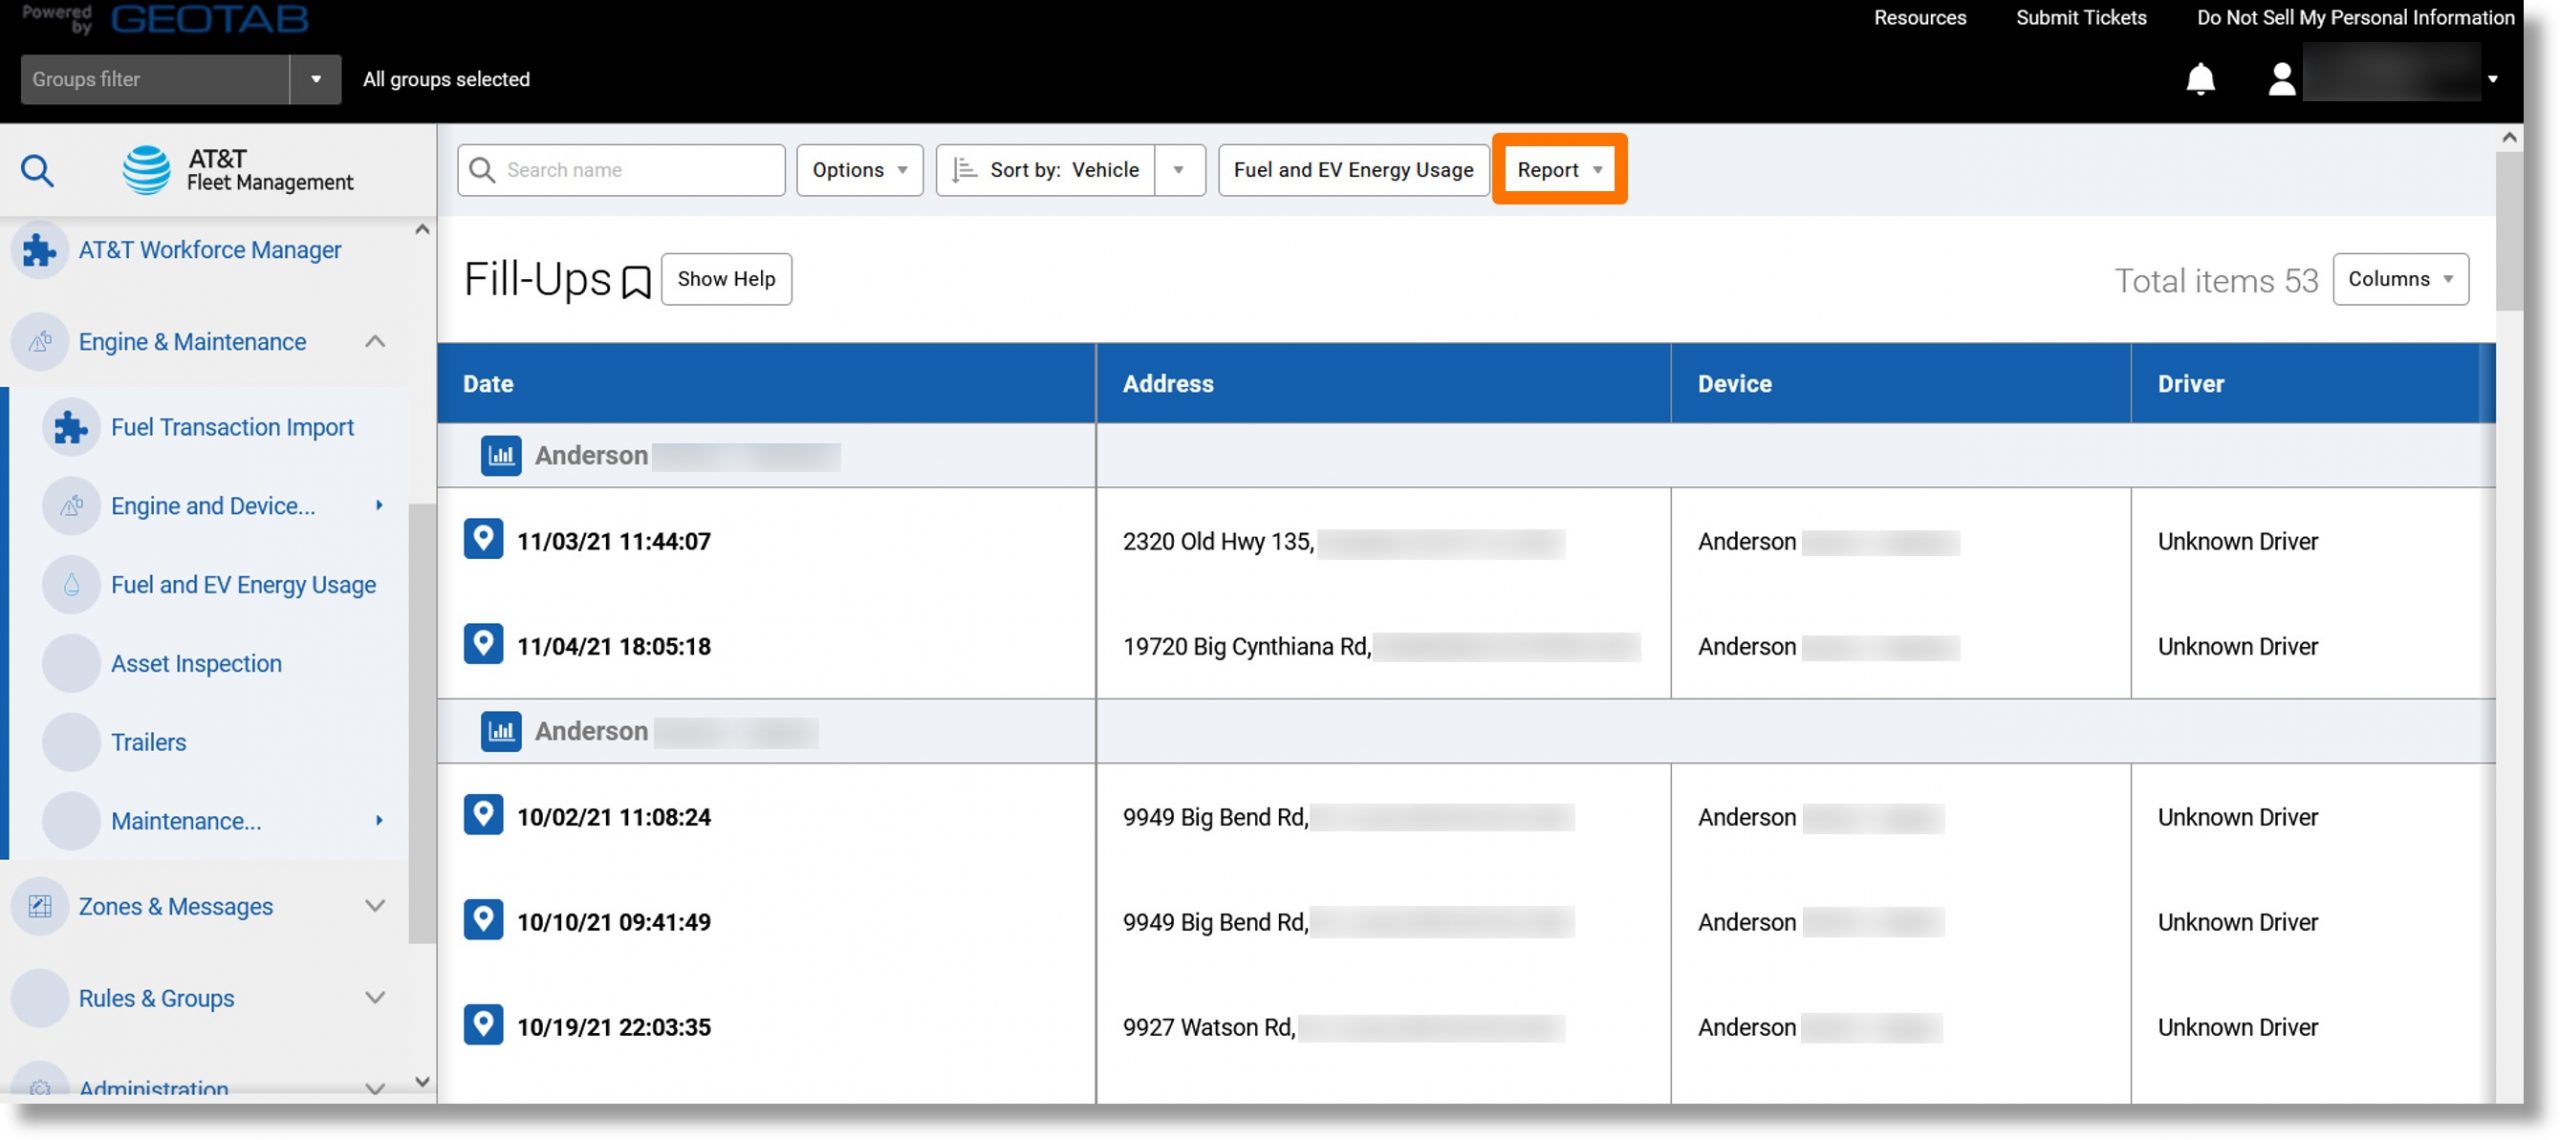
- Click on the Report dropdown.
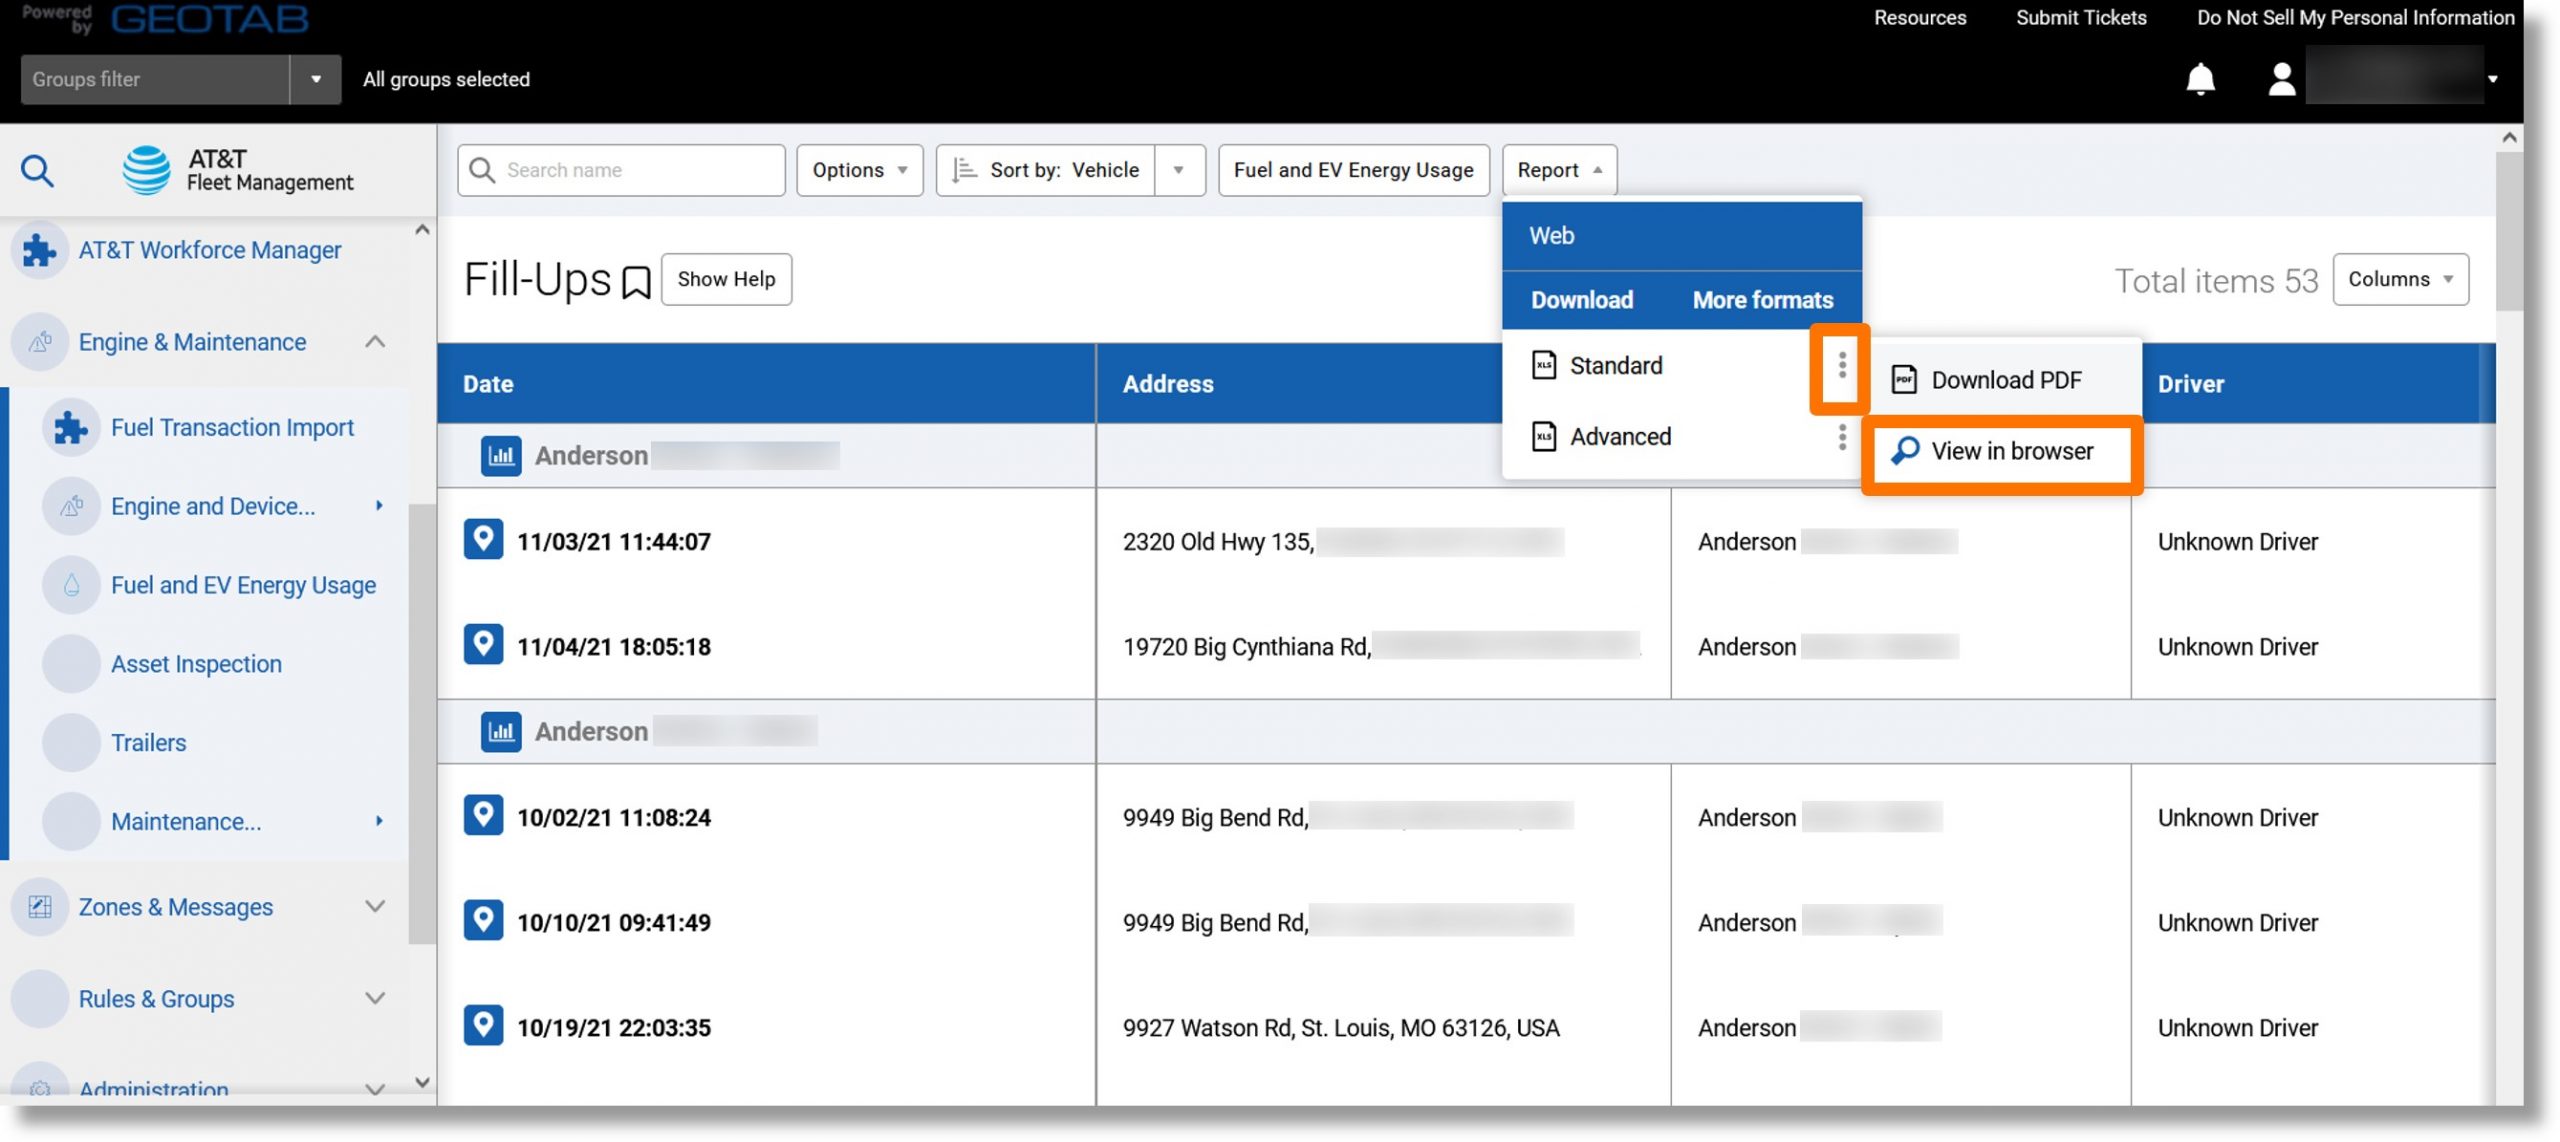
- Click on the ellipsis icon
 to the right of either “Standard” or “Advanced” and then click on View in browser.
- The Fill-Ups report displays.
Top
Customer Visit Report
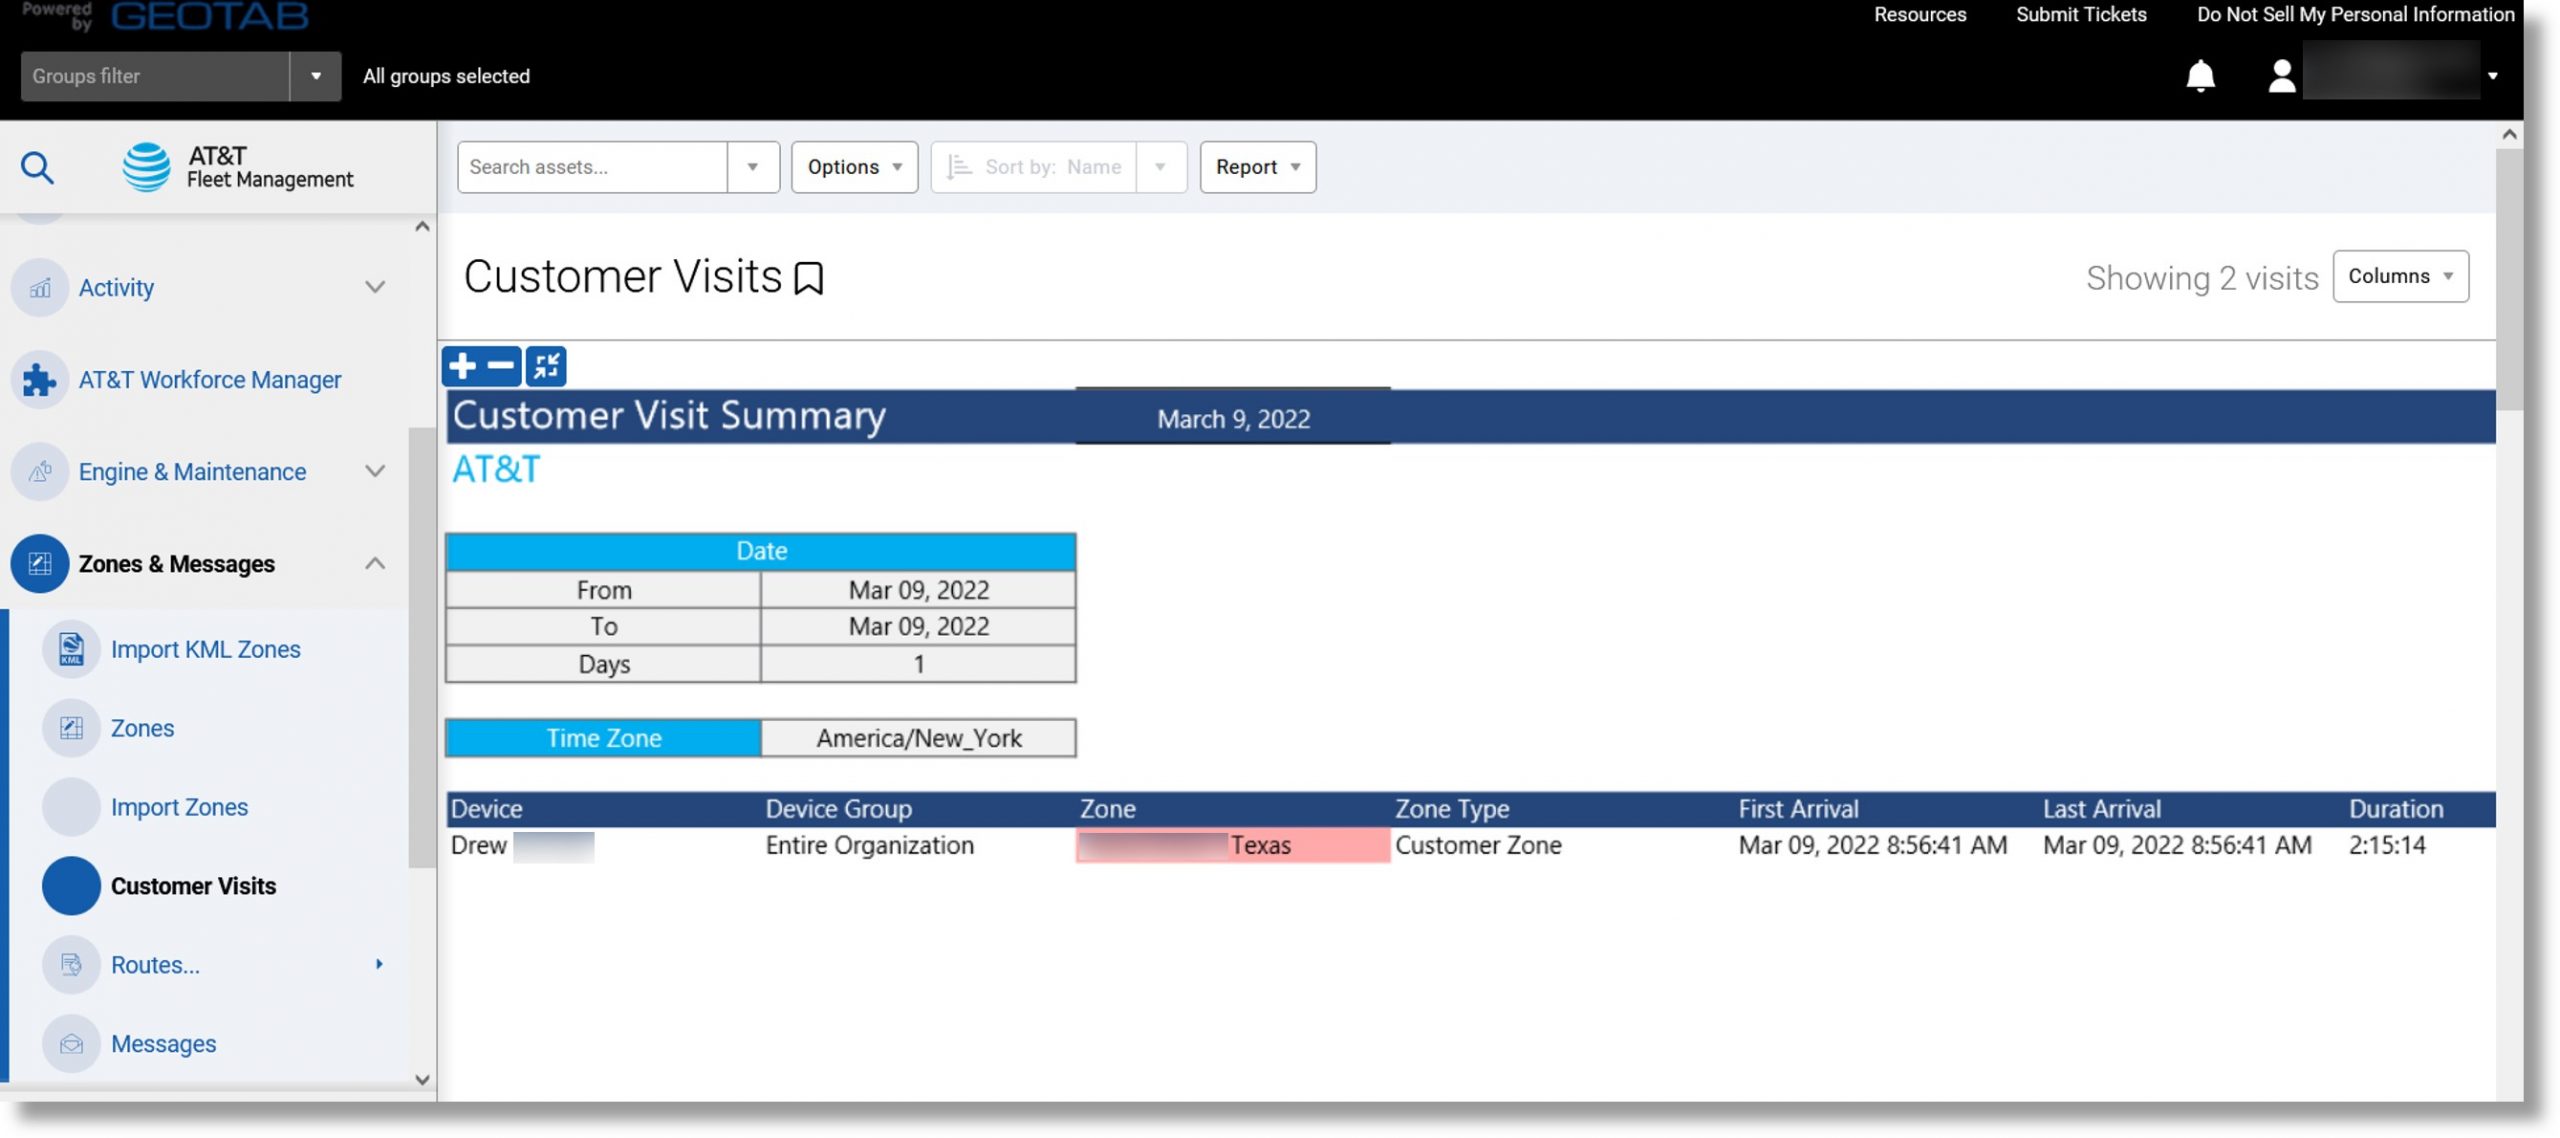
Use: Provides details on how long your vehicles spent at locations and identifies opportunities to increase productivity. This report also helps confirm customer job completion.
Information included: Zones, vehicle, driver (if applicable), time of arrival and departure, and duration spent in a zone.
Additional Information when exported: Latitude and longitude, etc.
Accessing the report:
- Click on Zones & Messages in the menu on the left and then scroll down.
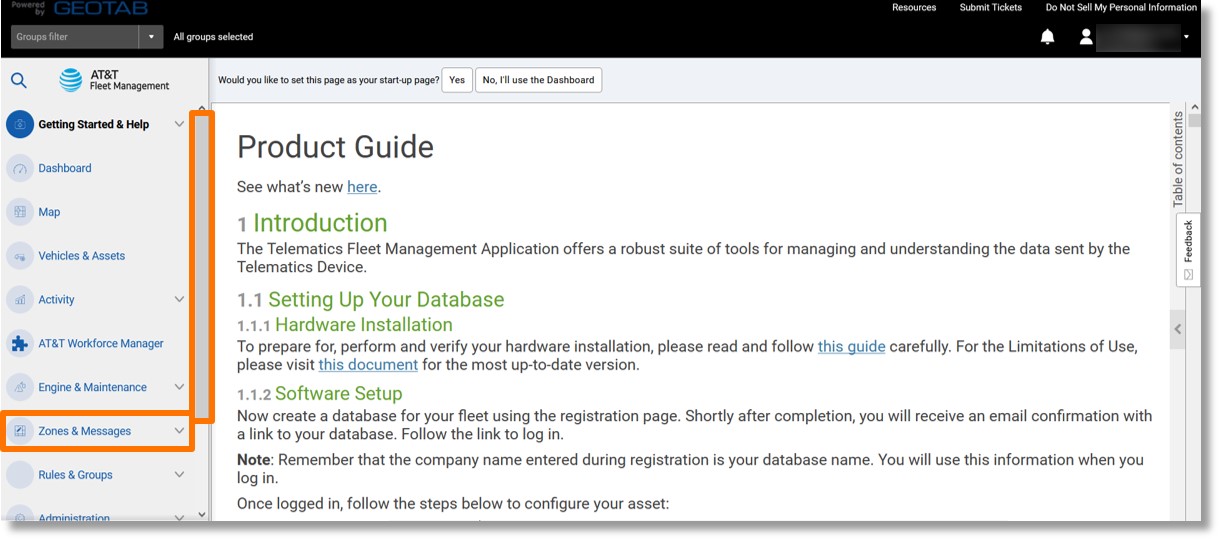
- Click on Customer Visits.
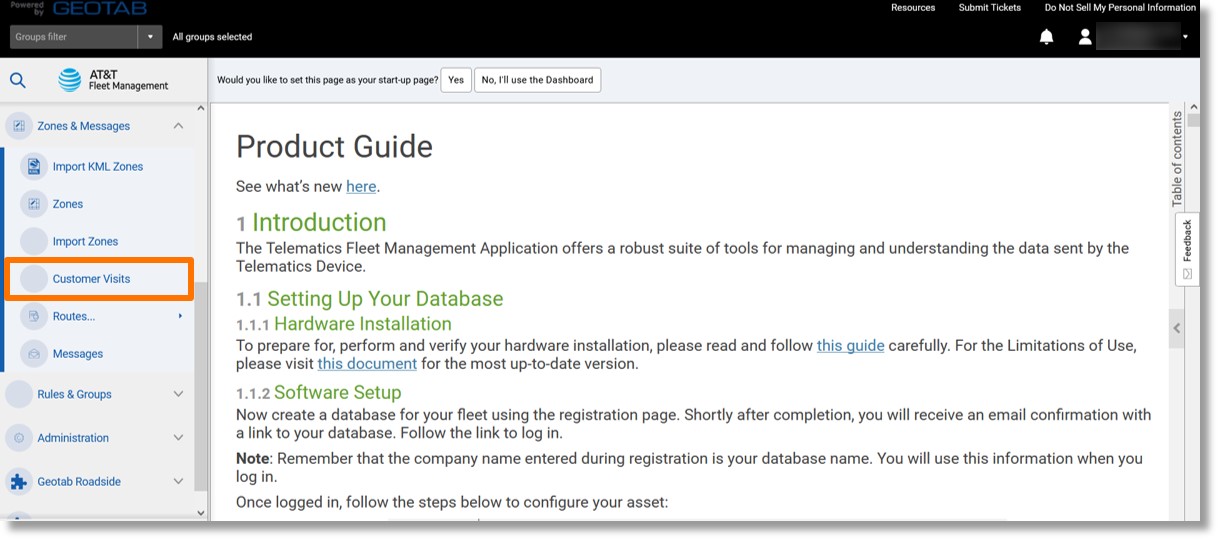
- The Vehicles list displays.
- Select the desired vehicle(s).
Note: If no customer visits display, click on the Options dropdown. Select the desired timeframe and other parameters.
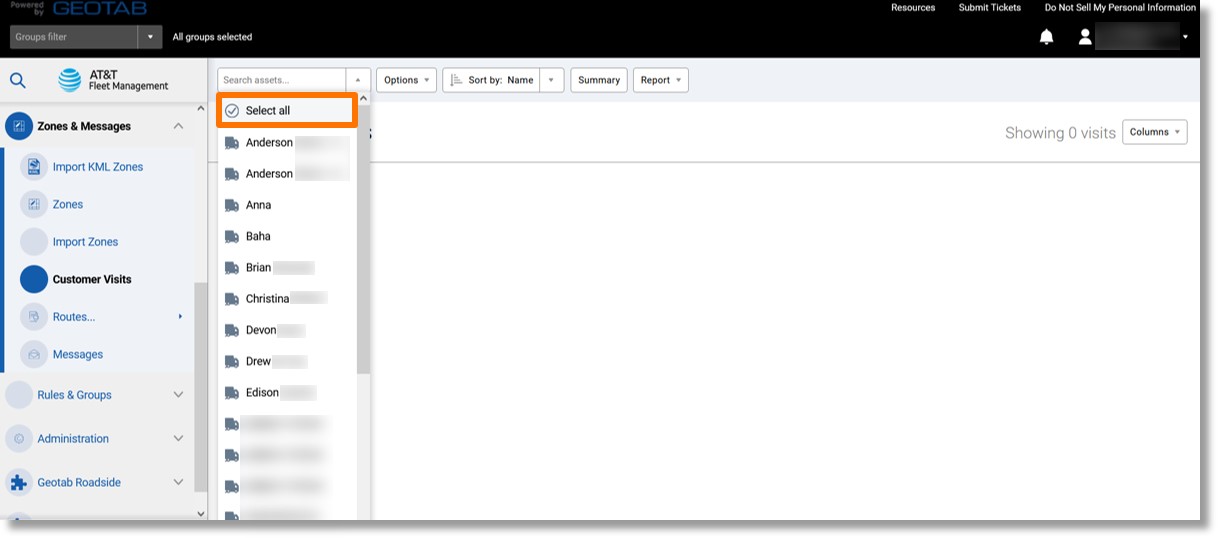
- Click on the Reports dropdown.
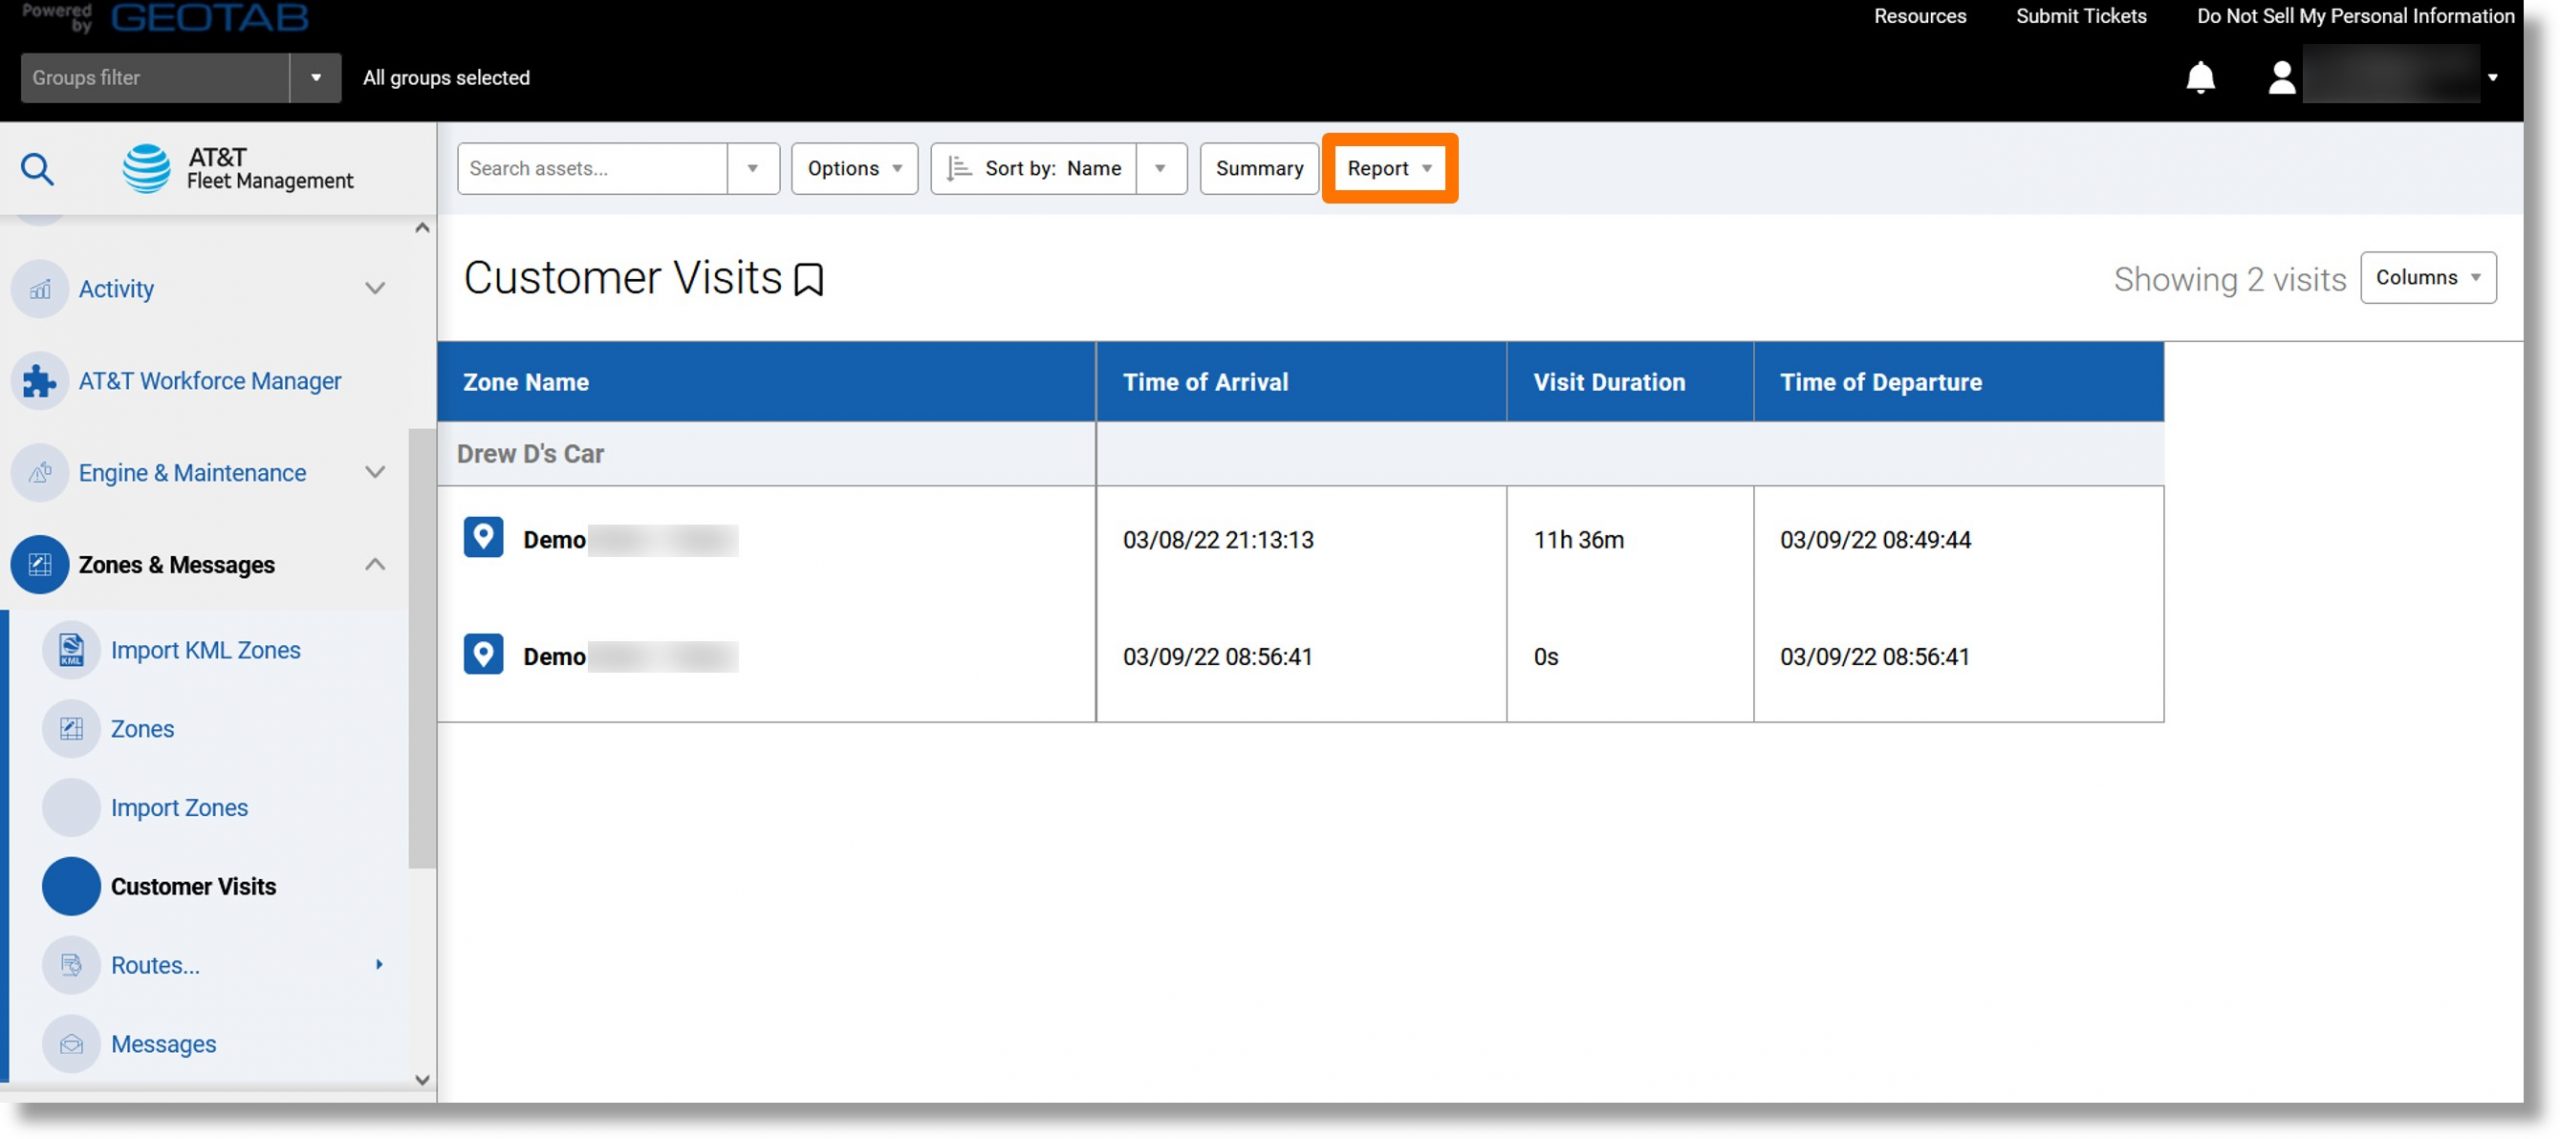
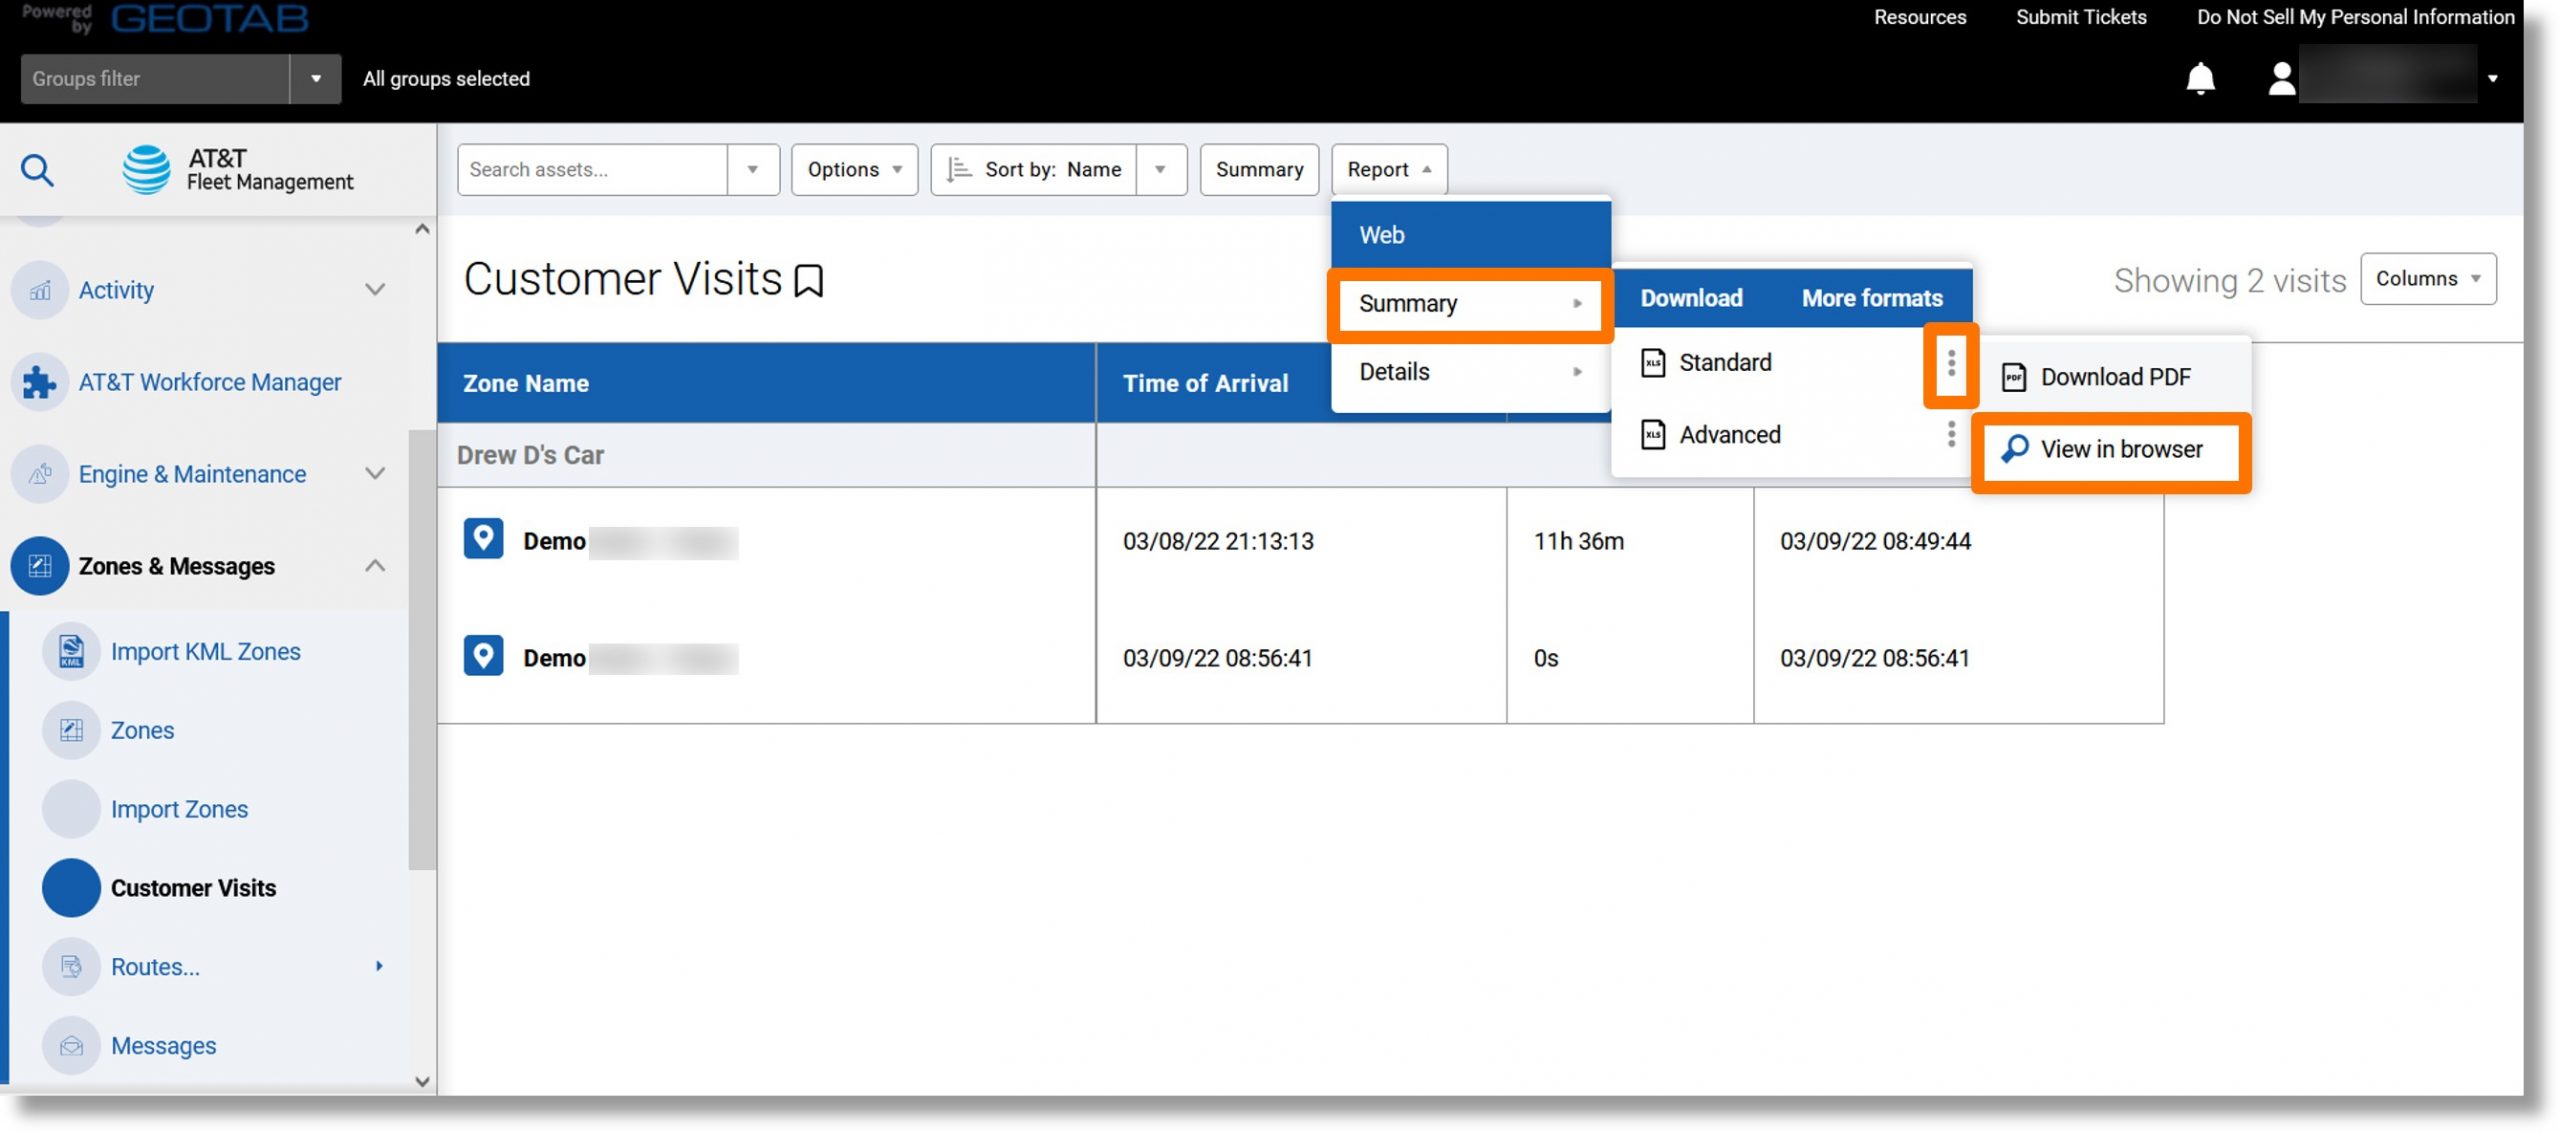
- Click on either Summary or Details.
- Click on the ellipsis icon
 to the right of either “Standard” or “Advanced” and then click on View in browser.
- The Customer Visits display.
Top
Exceptions Report
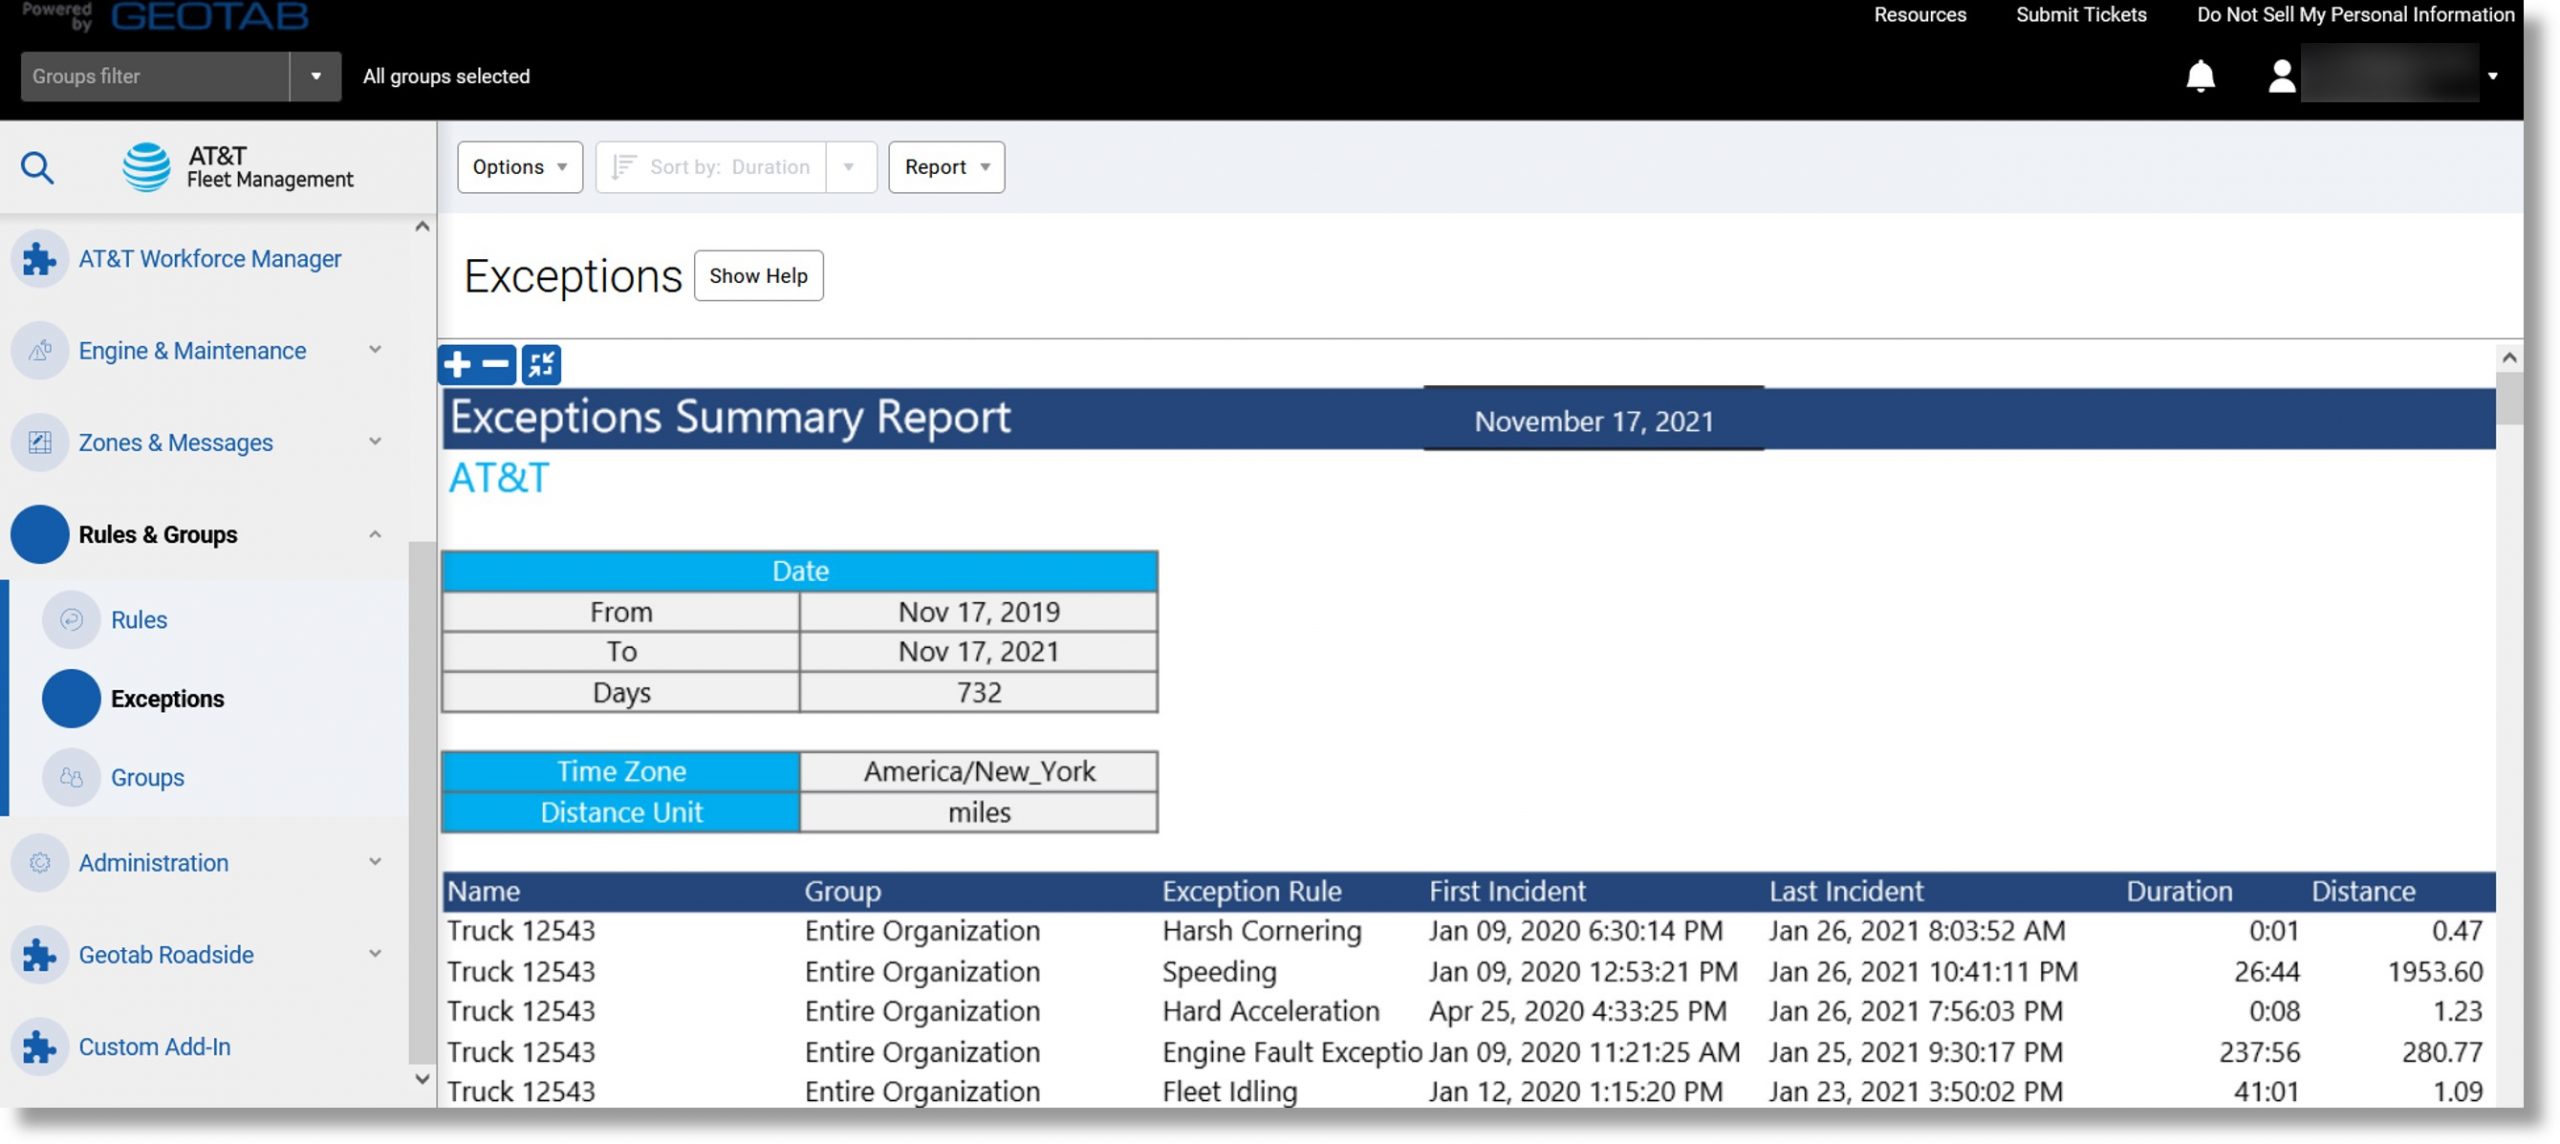
Use: Provides a summary view of the rules that were broken by each vehicle.
Information included: Broken rules, vehicle/driver that broke the rule, total duration, total distance, the total number of incidents.
Additional Information when exported: Date/time of the first and last incident, etc.
Accessing the report:
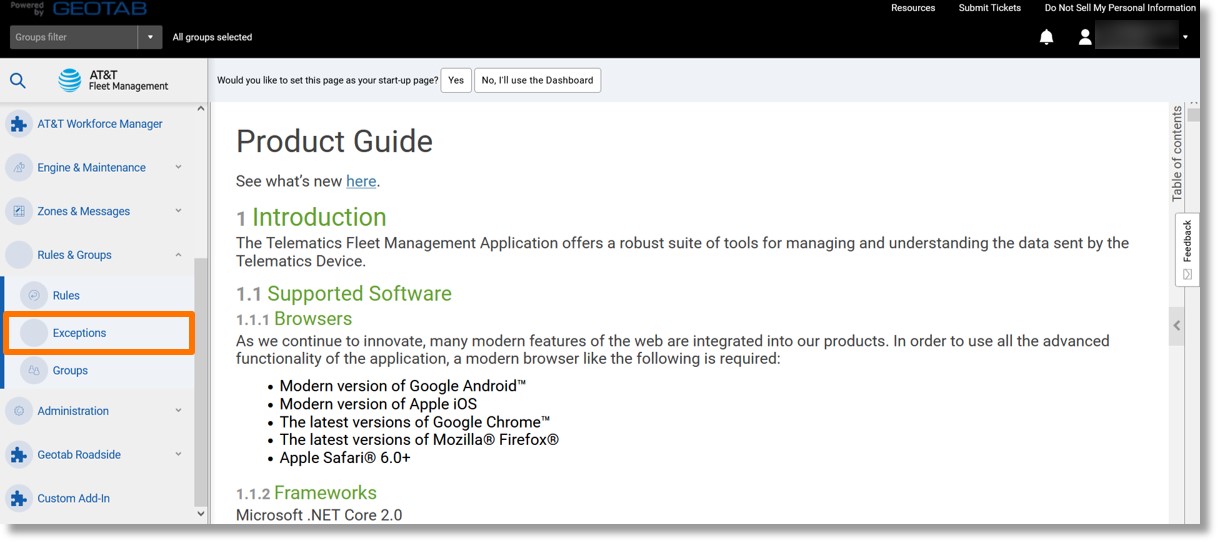
- Click on Rules & Groups in the column on the left and scroll down.
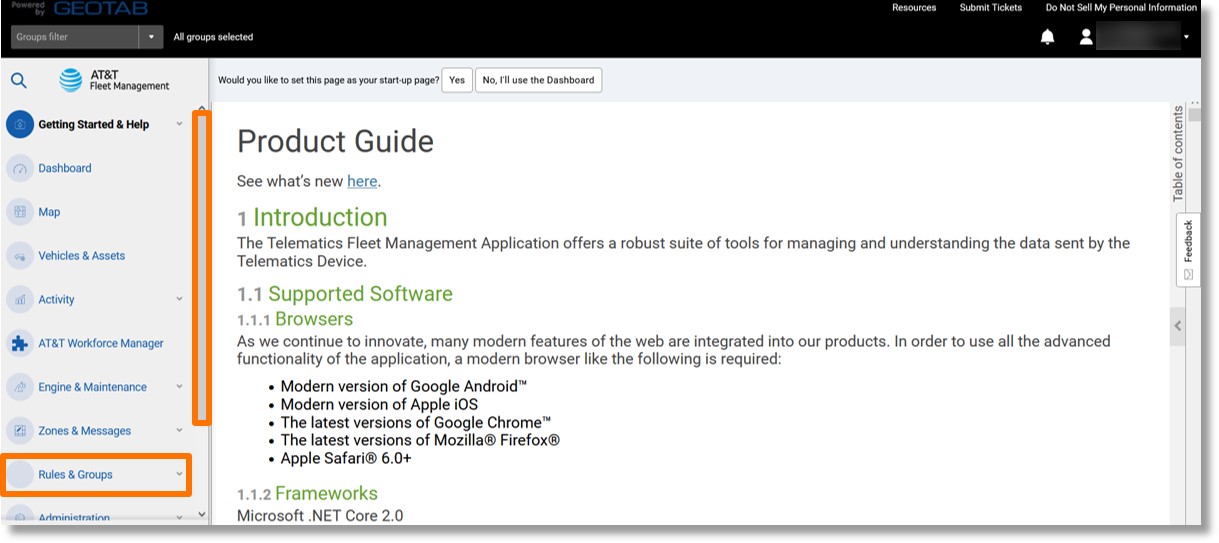
- Click on Exceptions.
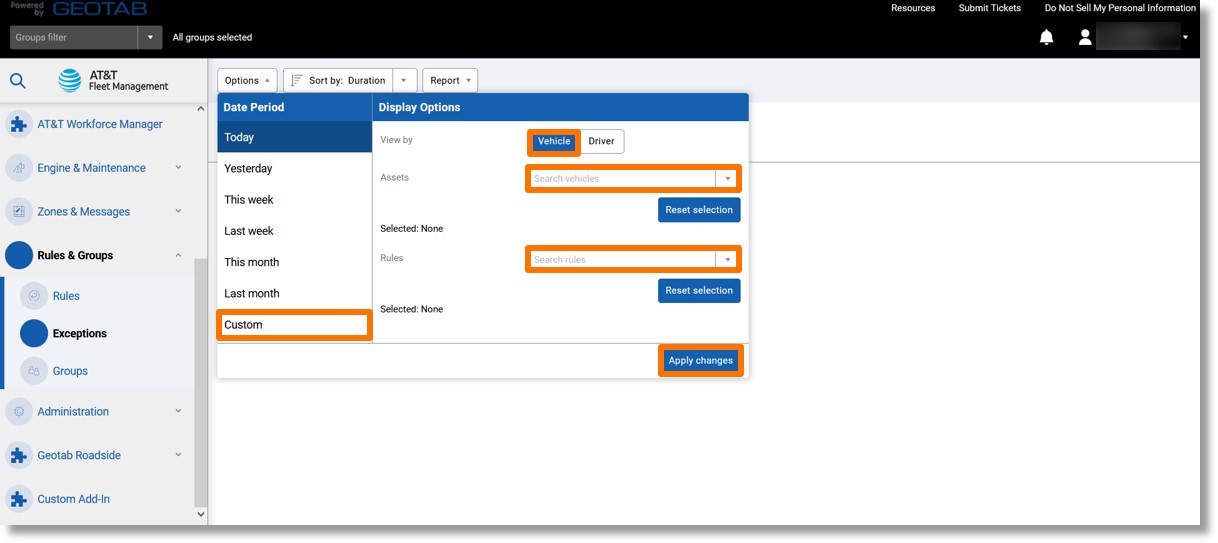
- The Options menu displays.
- Click on the desired time-frame under “DATE PERIOD”.
Note: To set a specific date range, click on Custom.
- Click on either the “Vehicle” or “Driver” button to the right of “View by”.
- Click on the dropdown to the right of “Assets” and click on the desired vehicle(s).
- Click the dropdown to the right of “Rules” and click on the desired rules(s).
- Click the Apply changes button.
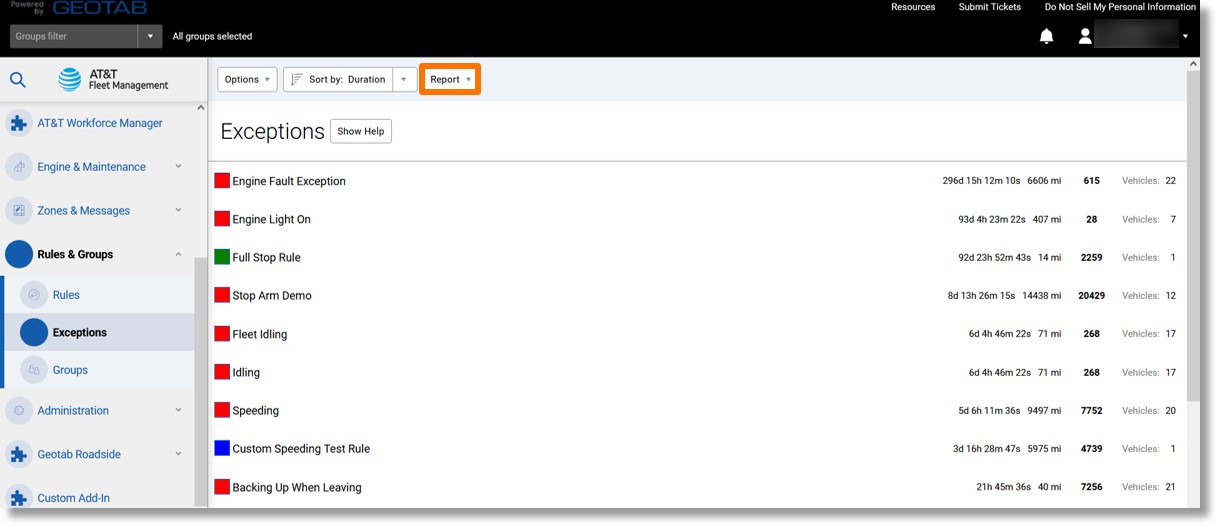
- The Exceptions list displays.
- Click on the Report dropdown box near the top of the page.
- Click on Summary or Details.
- Click on the ellipsis icon
 to the right of either “Standard”, “Advanced”, or “Aggressive Driving” and then click on View in browser.
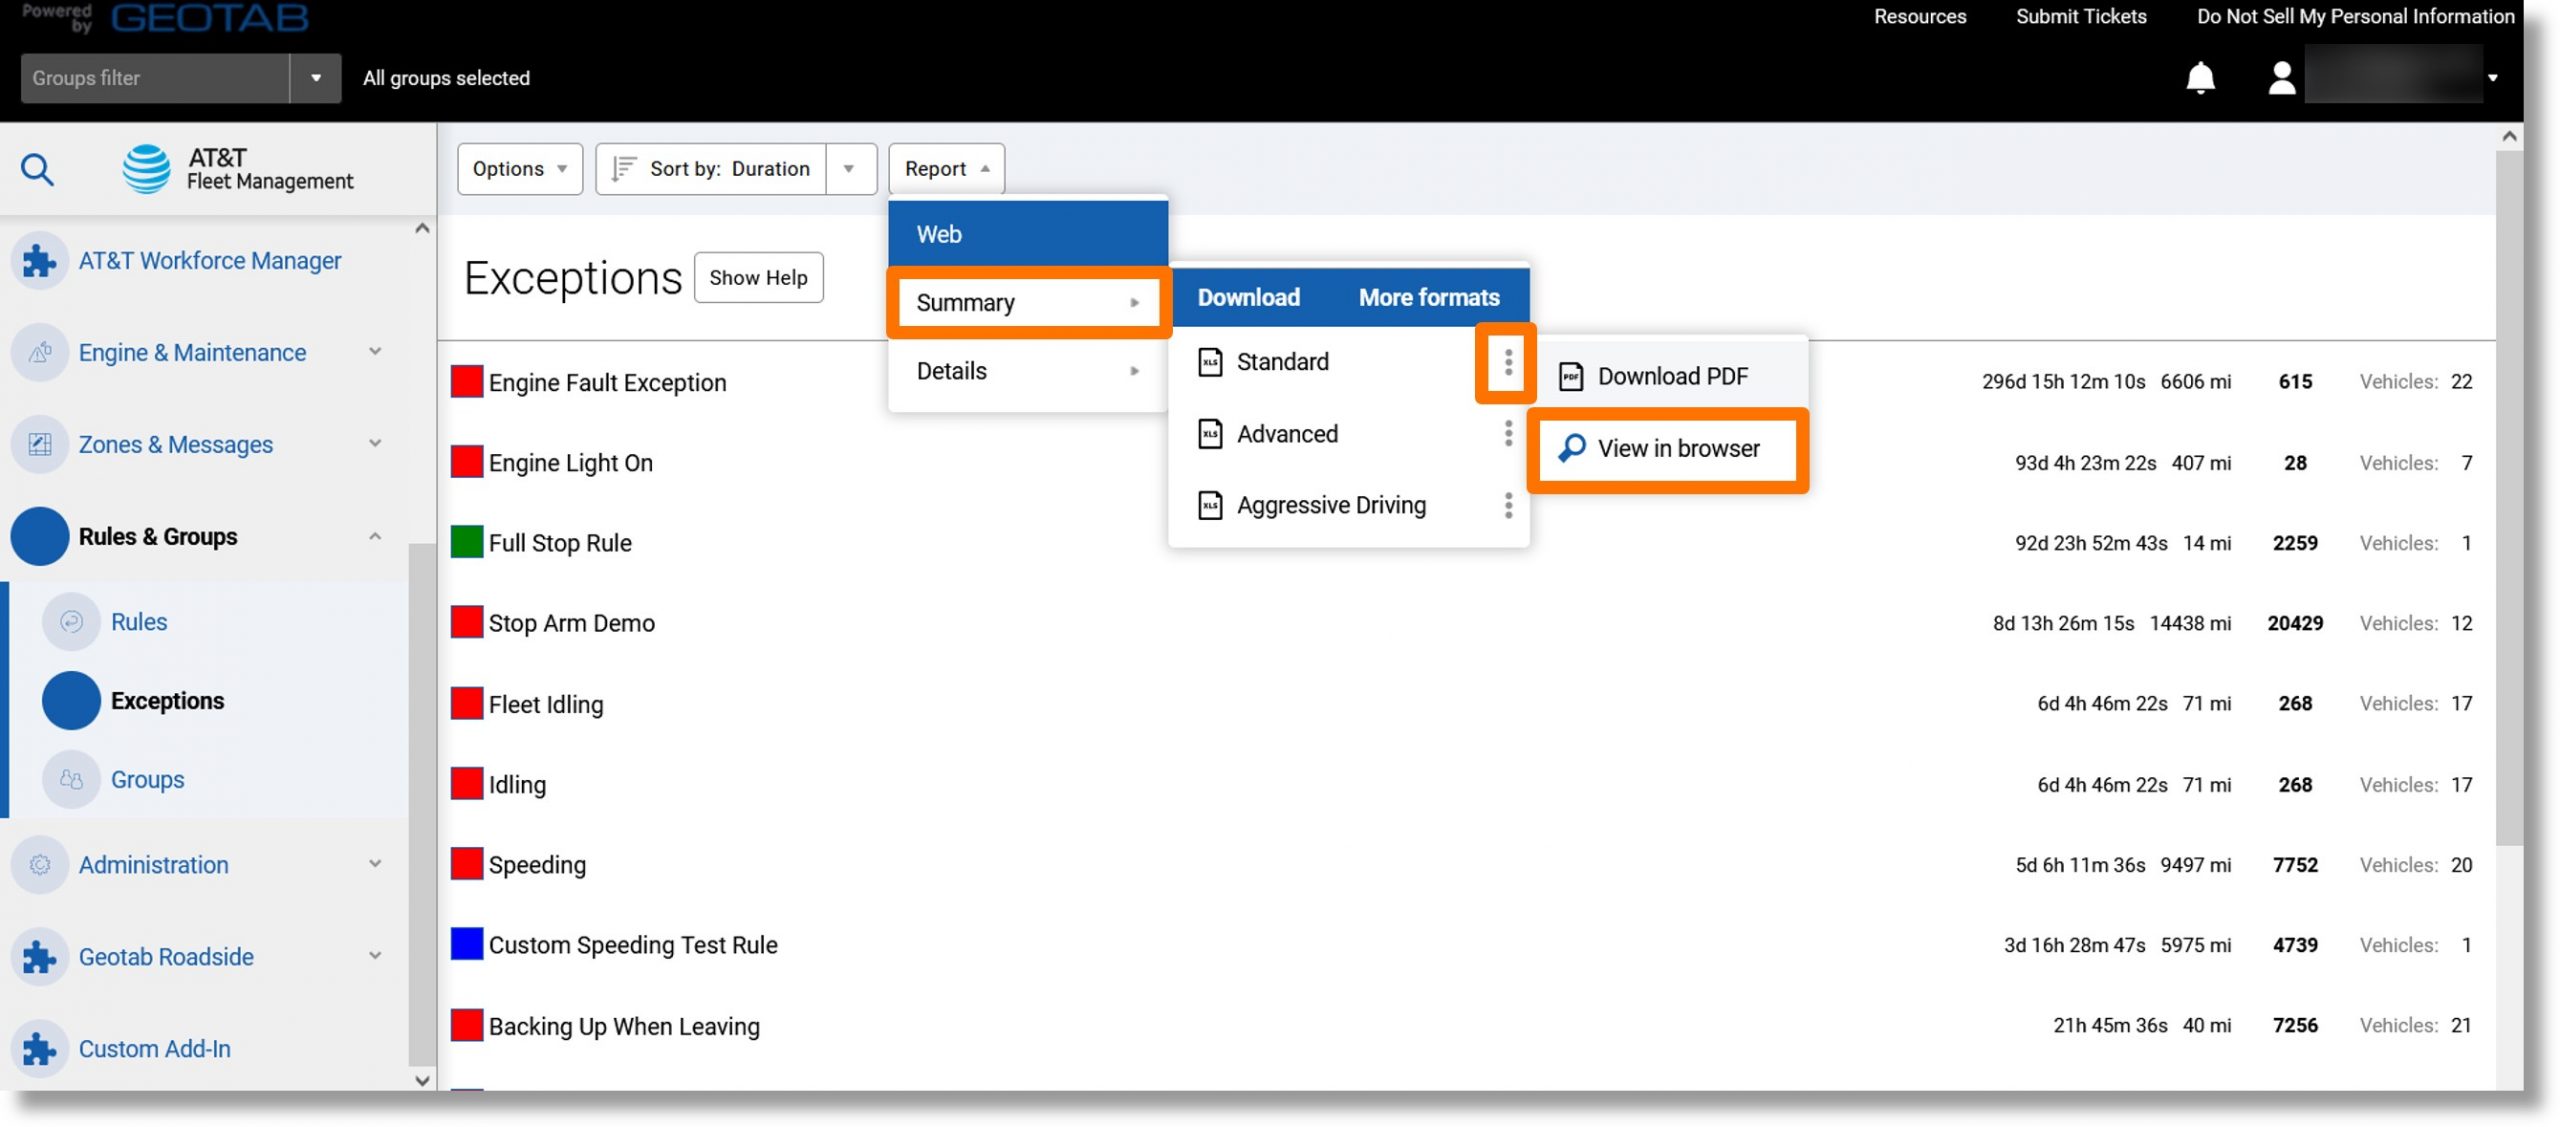
- The Exceptions report displays.
Top
Audit Log Report
Use: Track changes in the database when multiple users have administrative access as well as monitoring system usage.
Information included: Database items viewed or changed, username, audit details, date and time
Accessing the report:
- Scroll down to “Administrator” on the left side of the database.
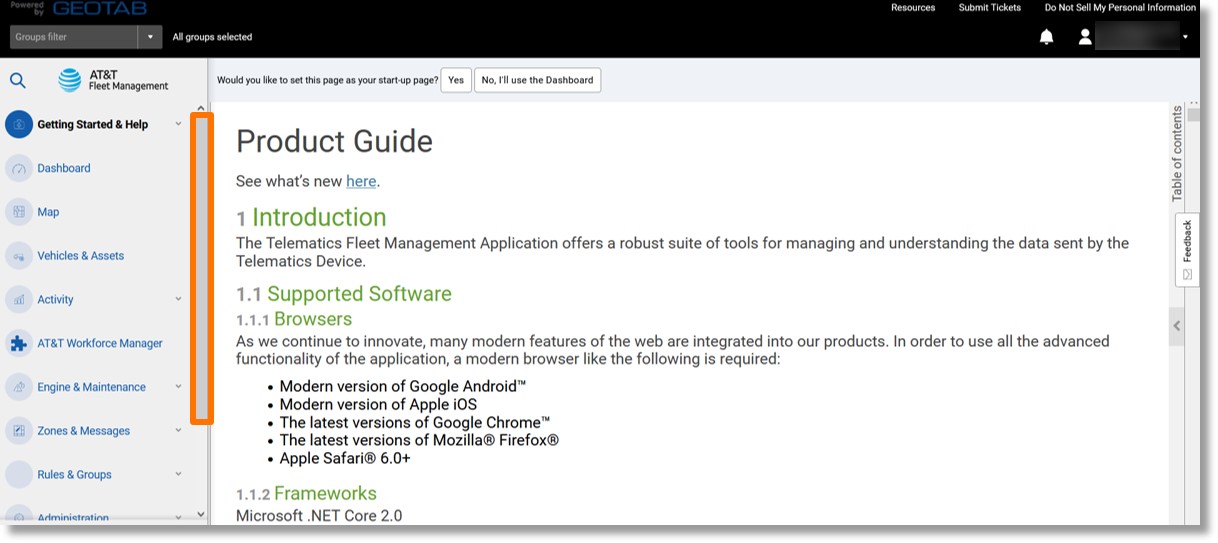
- Click on Administrator and scroll down.
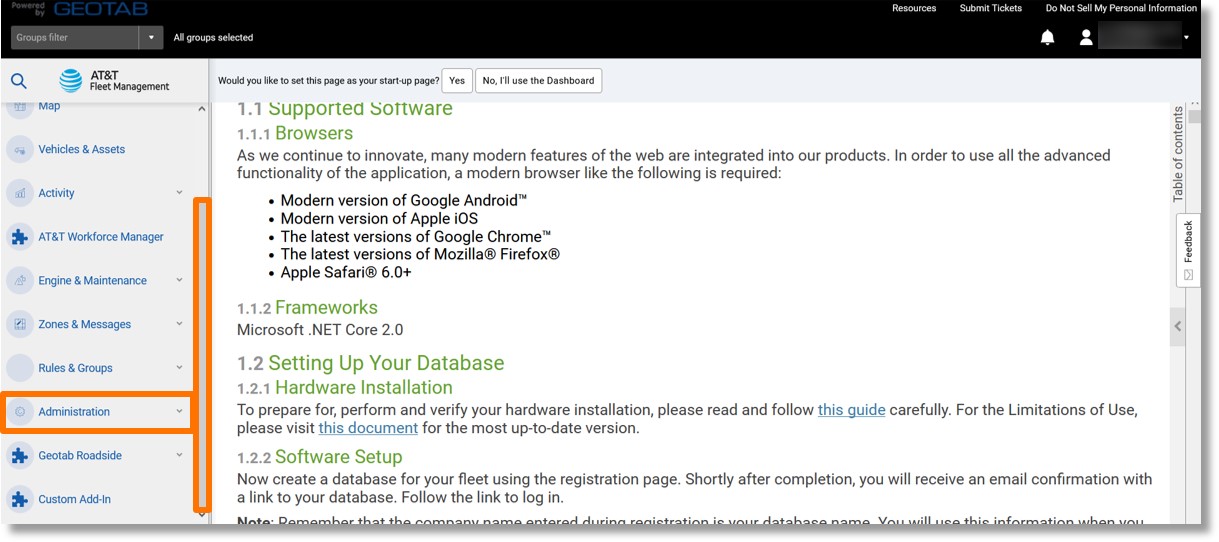
- Click on System… and then on Audit Log.
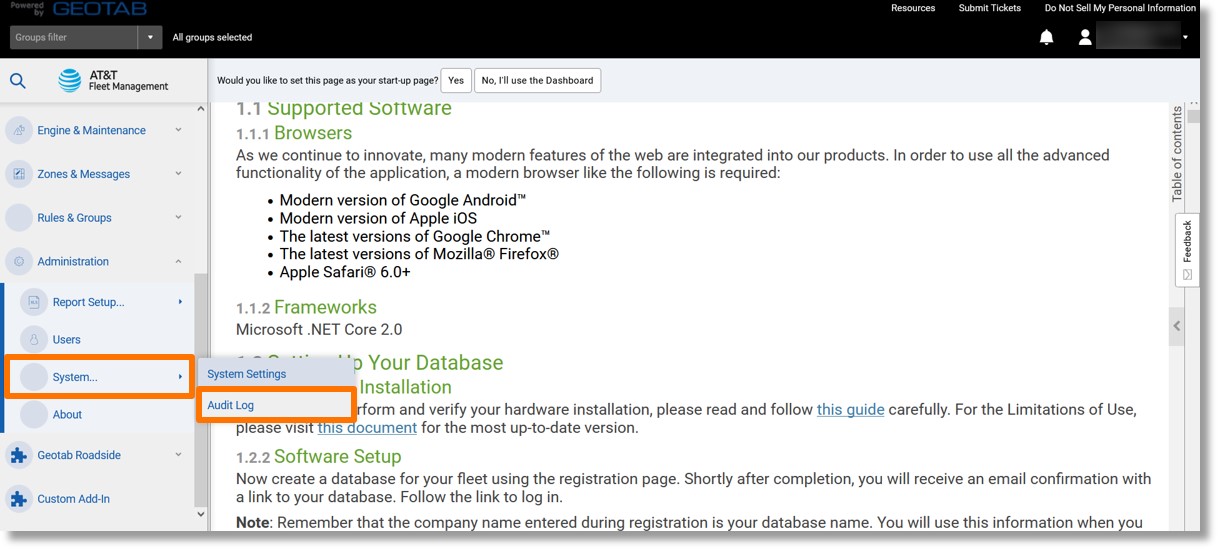
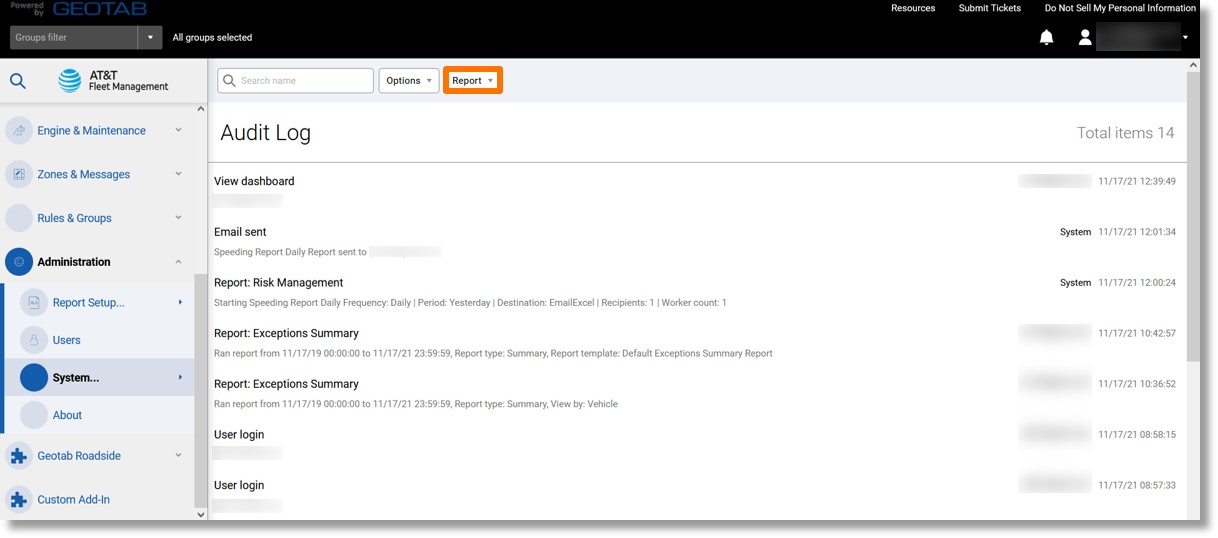
- The most recent systems actions display.
Note: You can use the search field above the log to search for a specific user. You can also click on the Options dropdown to set a specific timeframe.
- Click on the Report dropdown box.
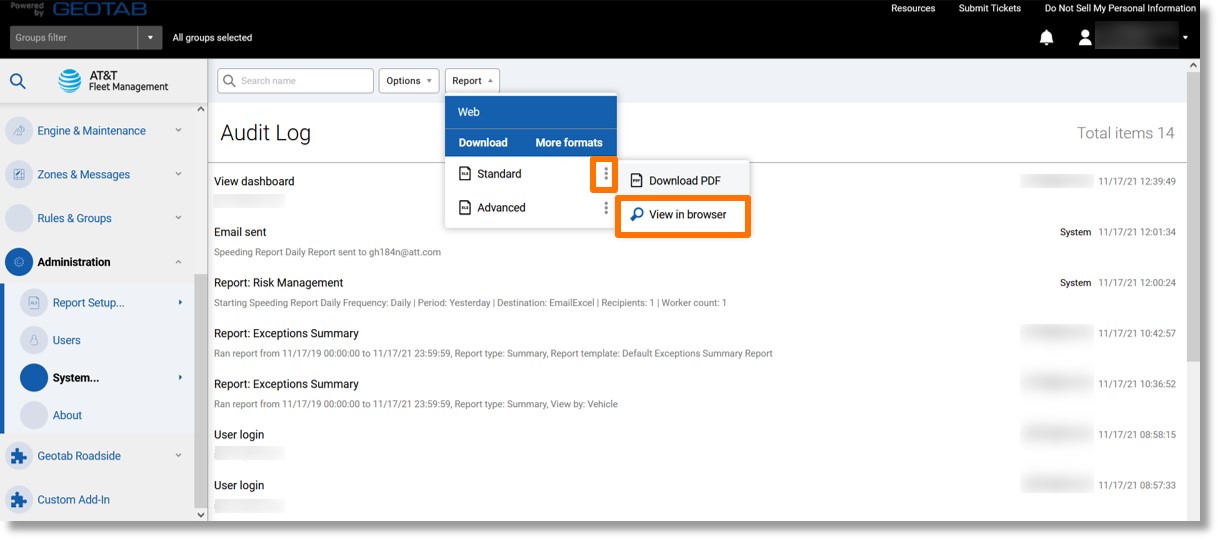
- Click on the ellipsis icon
 to the right of either “Standard” or “Advanced”.
- Click on View in browser.
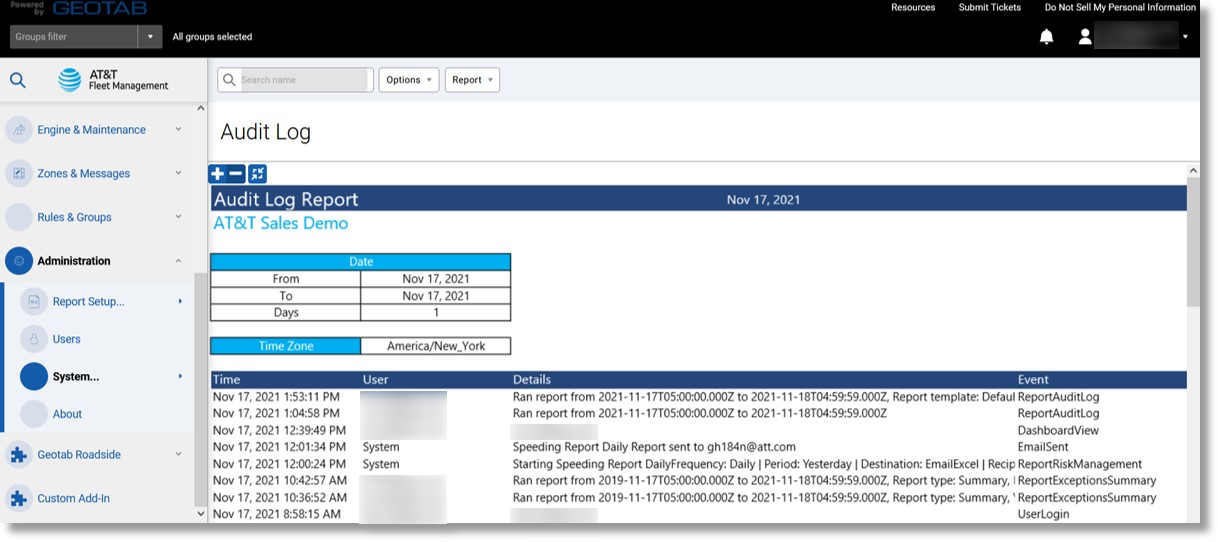
- The audit log displays.
Top
Log Data & Collisions Report
Use: Detailed report with information that can be used for collision reconstruction.
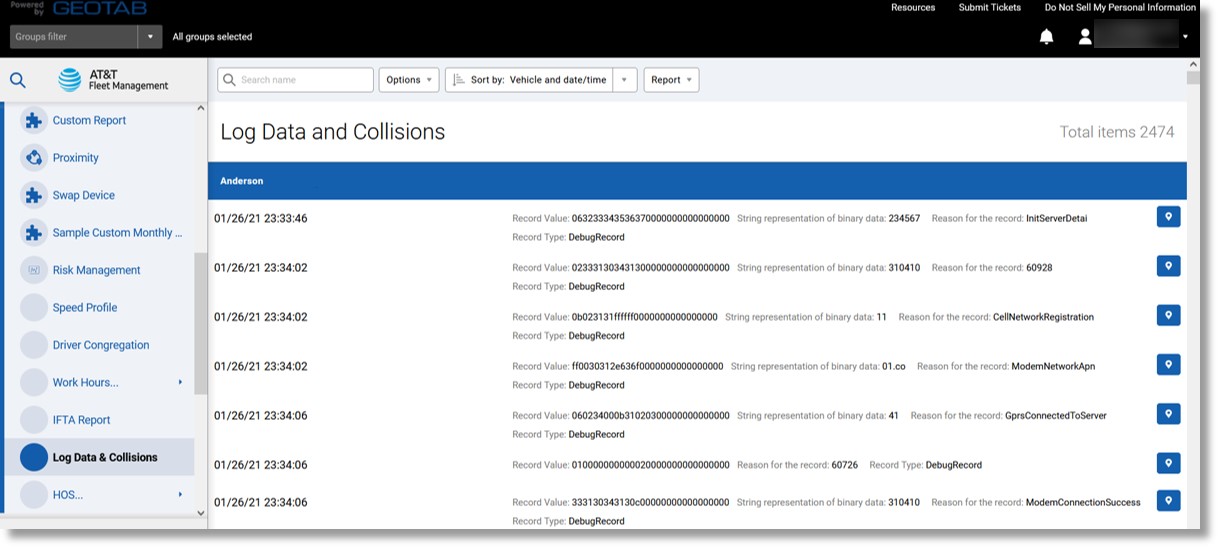
Information included: Displays the data captured for a vehicle from the engine or the device. For example, GPS coordinates, accelerometer, engine RPM, gear position, and cranking voltage.
Additional Information when exported: Log reason, ignition status, etc.
Accessing the report:
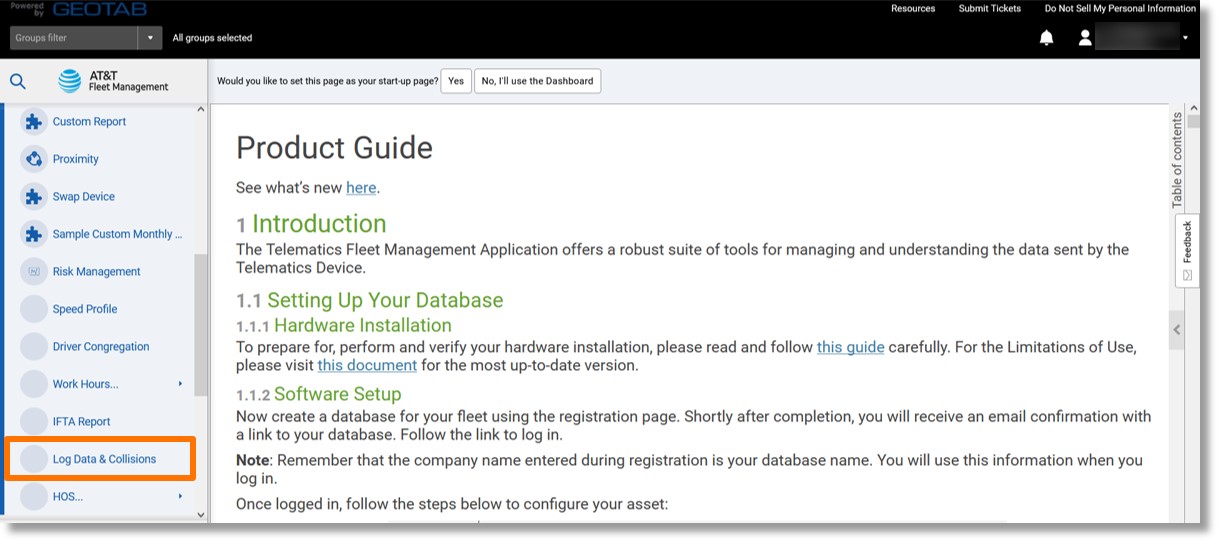
- Click on Activity in the column on the left and then scroll down.
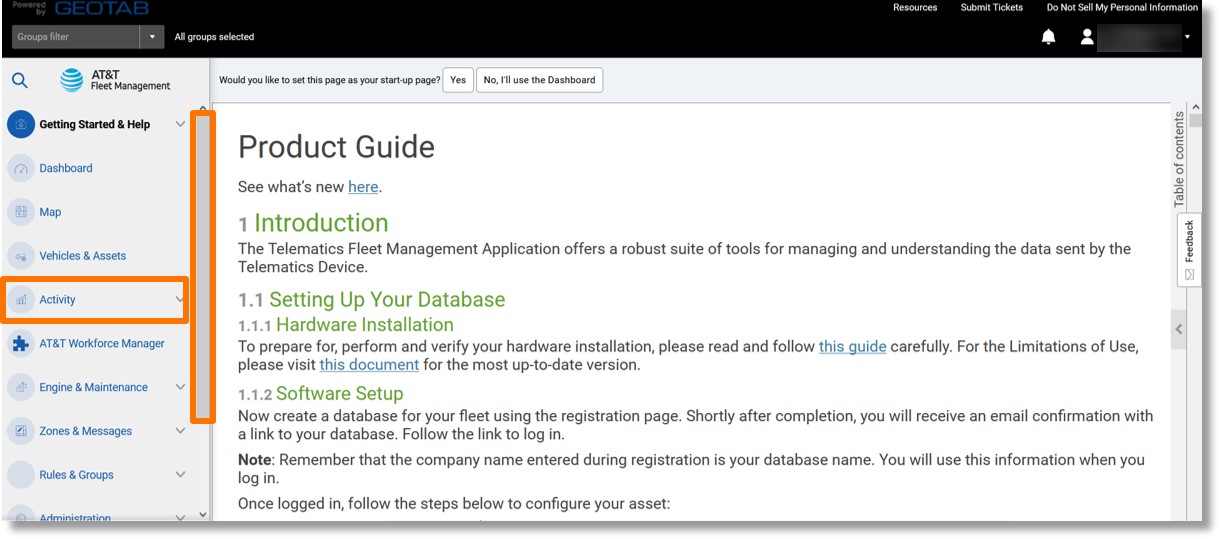
- Click on Log Data & Collisions.
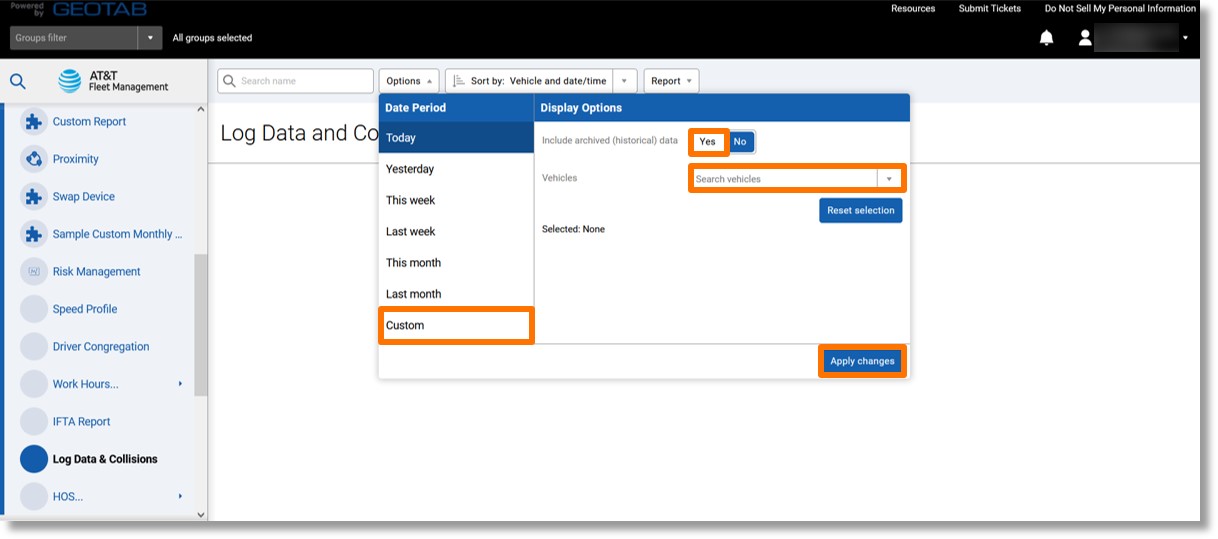
- Click on the desired date range under “DATE PERIOD”.
- Click the Yes or No button to the right of “Include historical data”.
- Click on the dropdown menu to the right of “Vehicles” and select the desired vehicle(s).
- Click the Apply changes button.
- The Log Data and Collisions display.
Top
HOS Violations Report
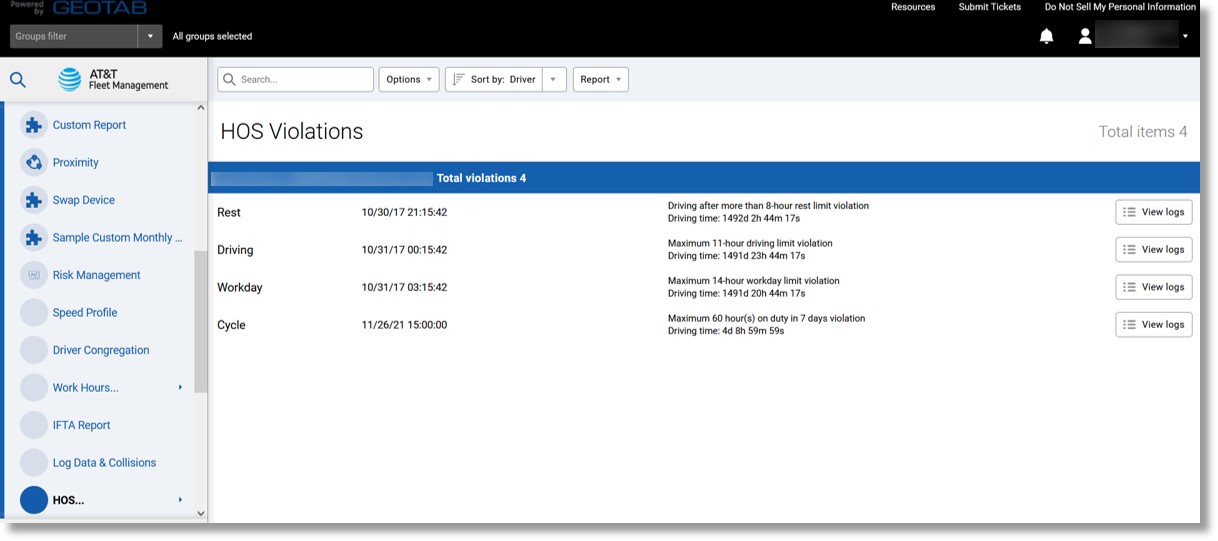
Use: Provides the rule set violations that occurred for each driver.
Information included: Driver name, violation type and reason, duration of violation, violation date, start and end time.
Accessing the report:
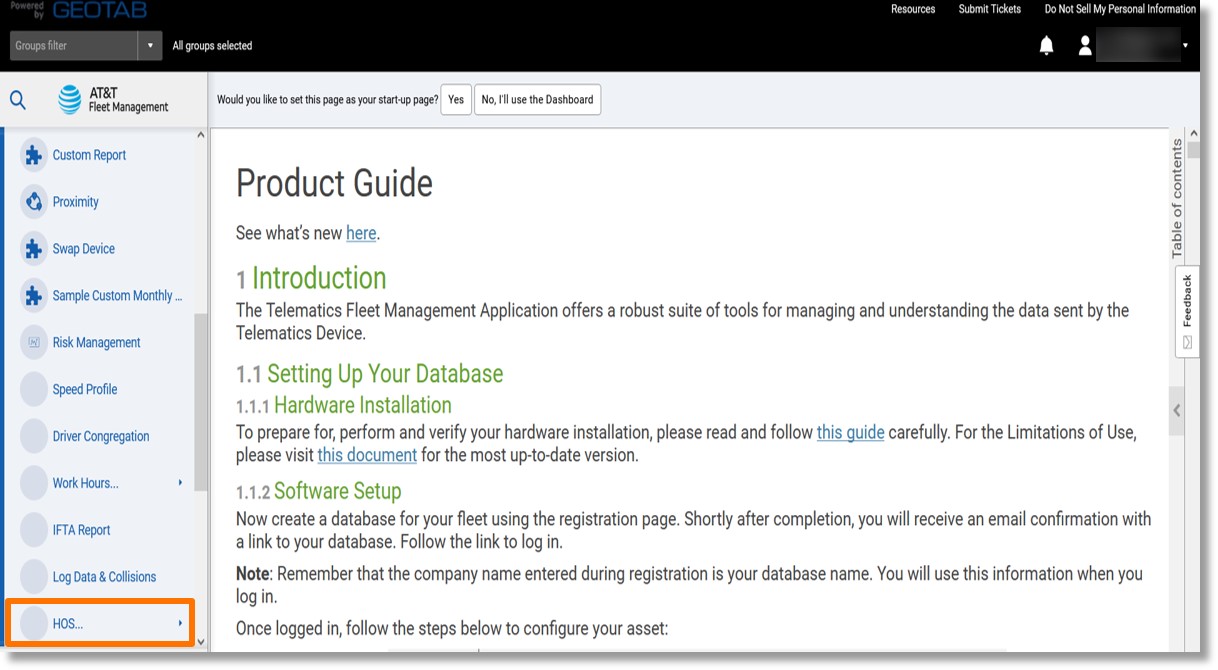
- Click on Activity in the menu on the left and then scroll down.
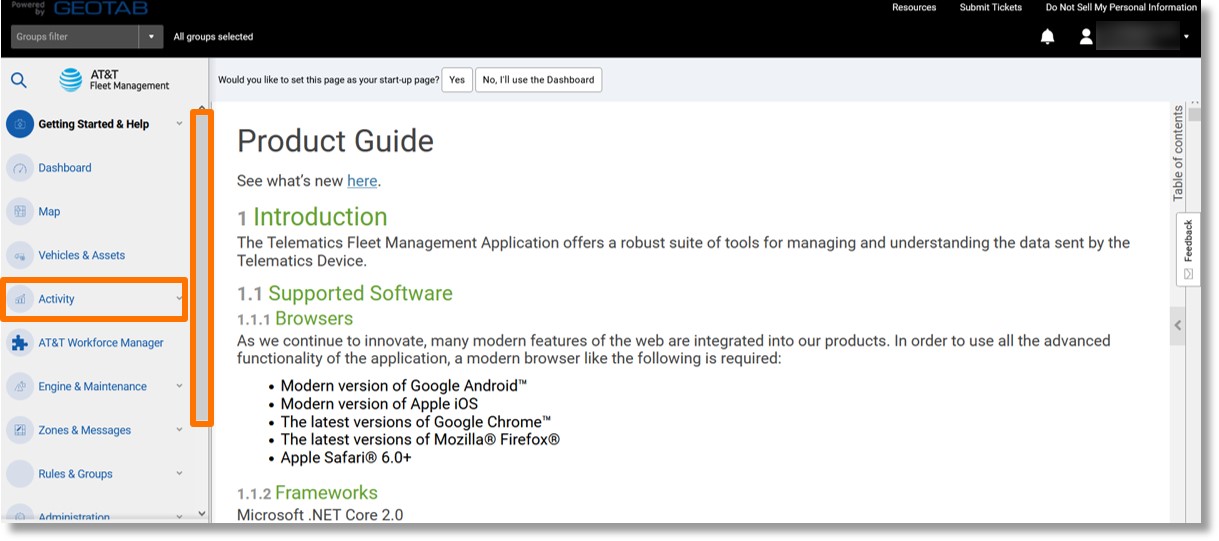
- Click on HOS….
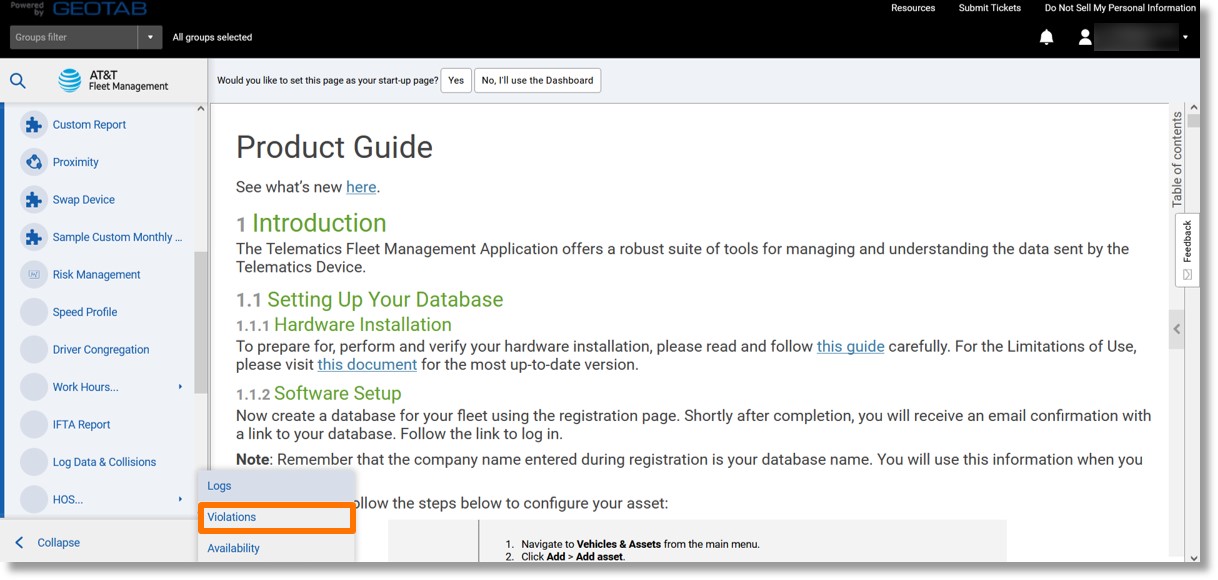
- Click on Violations.
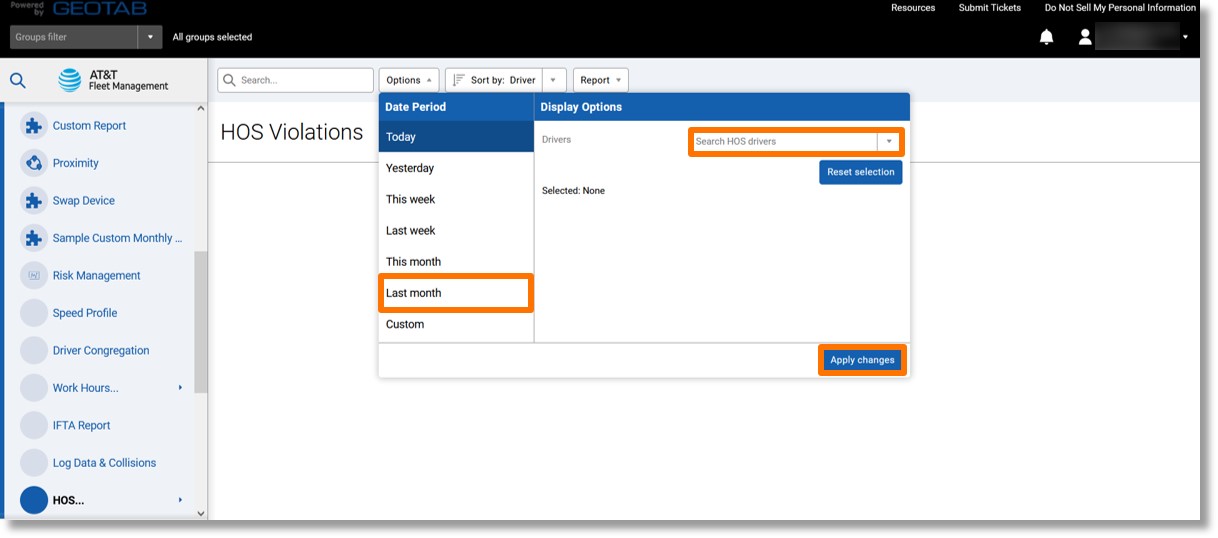
- The “Options” menu displays.
- Select the desired date range under “DATE PERIOD”.
- Click on the dropdown to the right of “Drivers” and select the desired driver(s).
- Click the Apply changes button.
- The list of violations displays.
Note: You can click on the “Sort by: Driver” dropdown to sort the list by driver or type.
Top
Route Directions Report
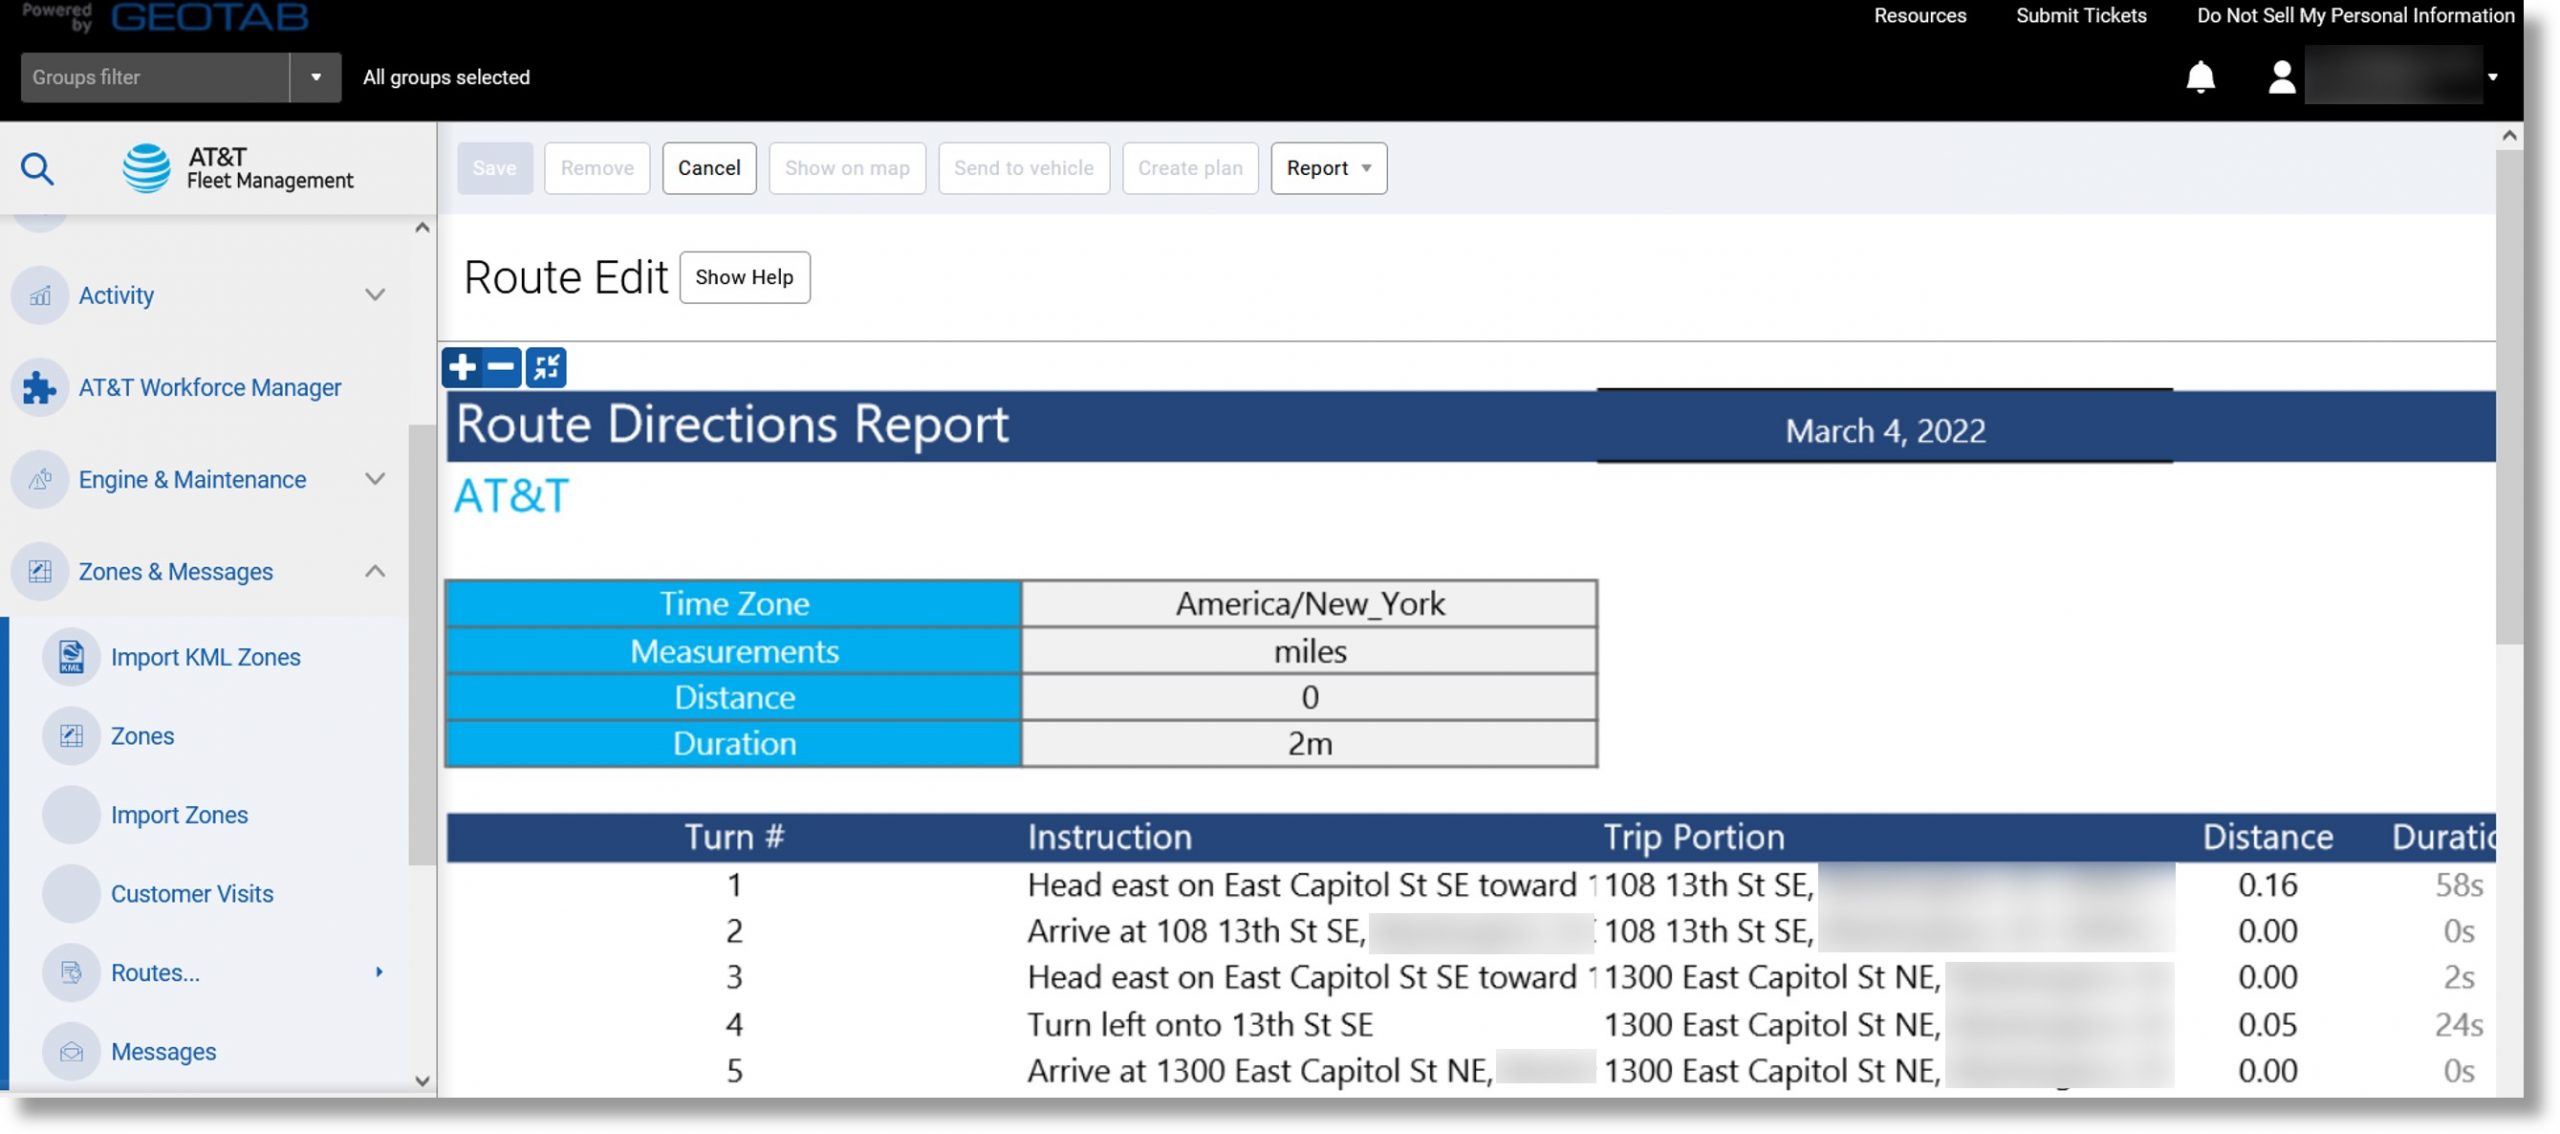
Use: Turn by turn directions that can be printed
Information included: Turn number, instruction for a turn, Trip portion, Distance, Duration
Accessing the report:
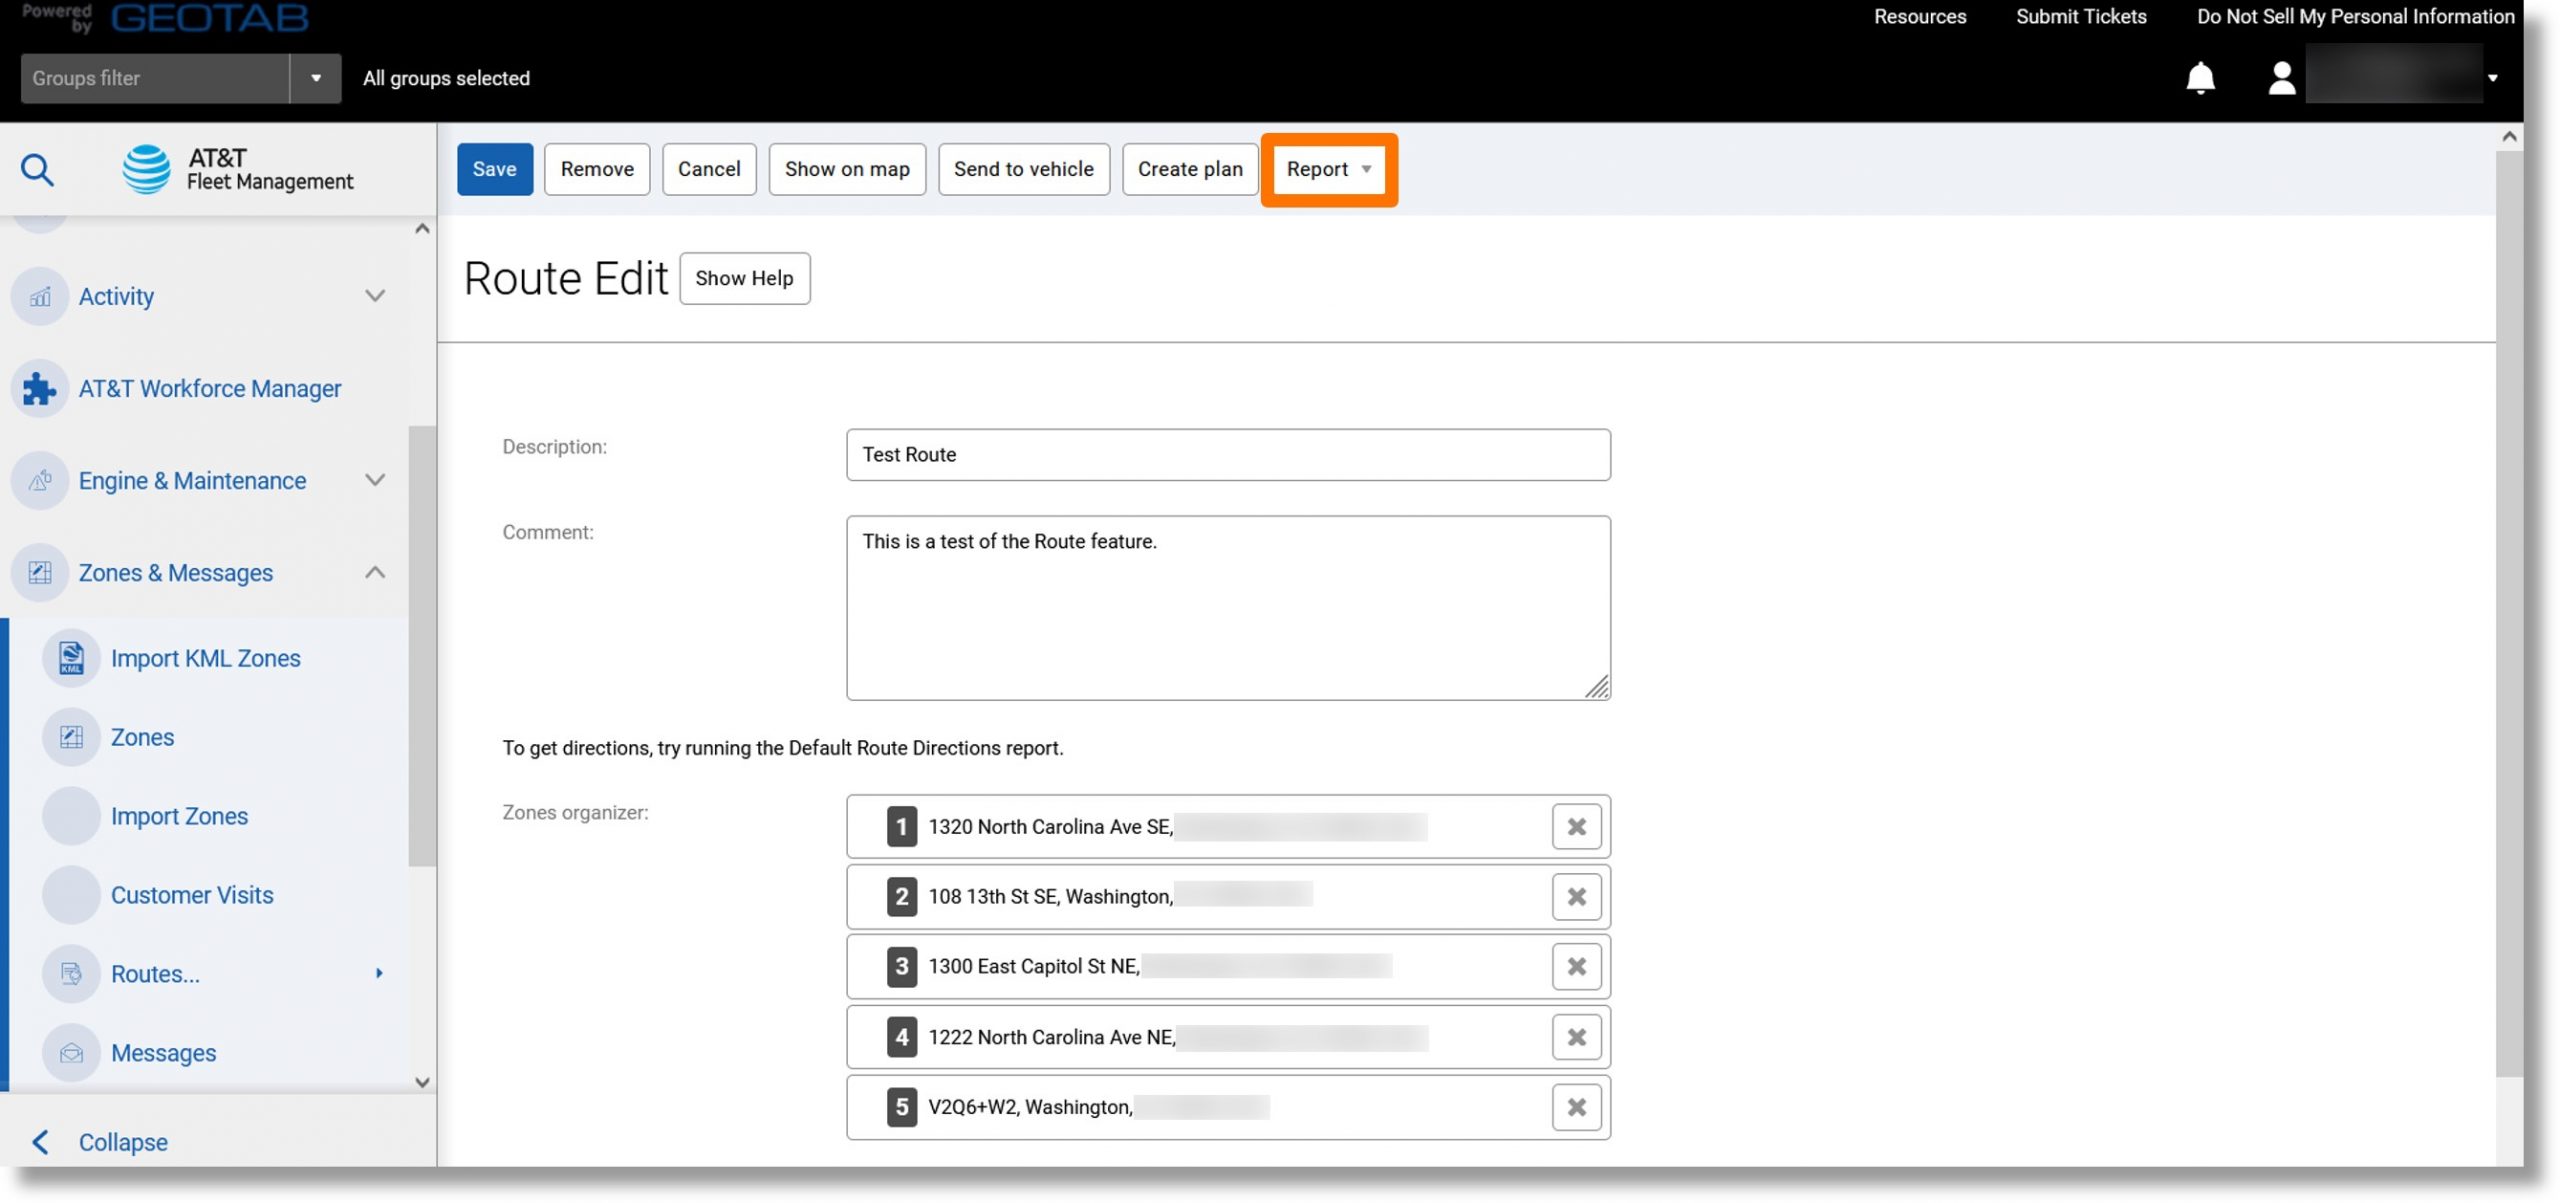
- Click on Zones & Messages in the menu on the left and then scroll down.
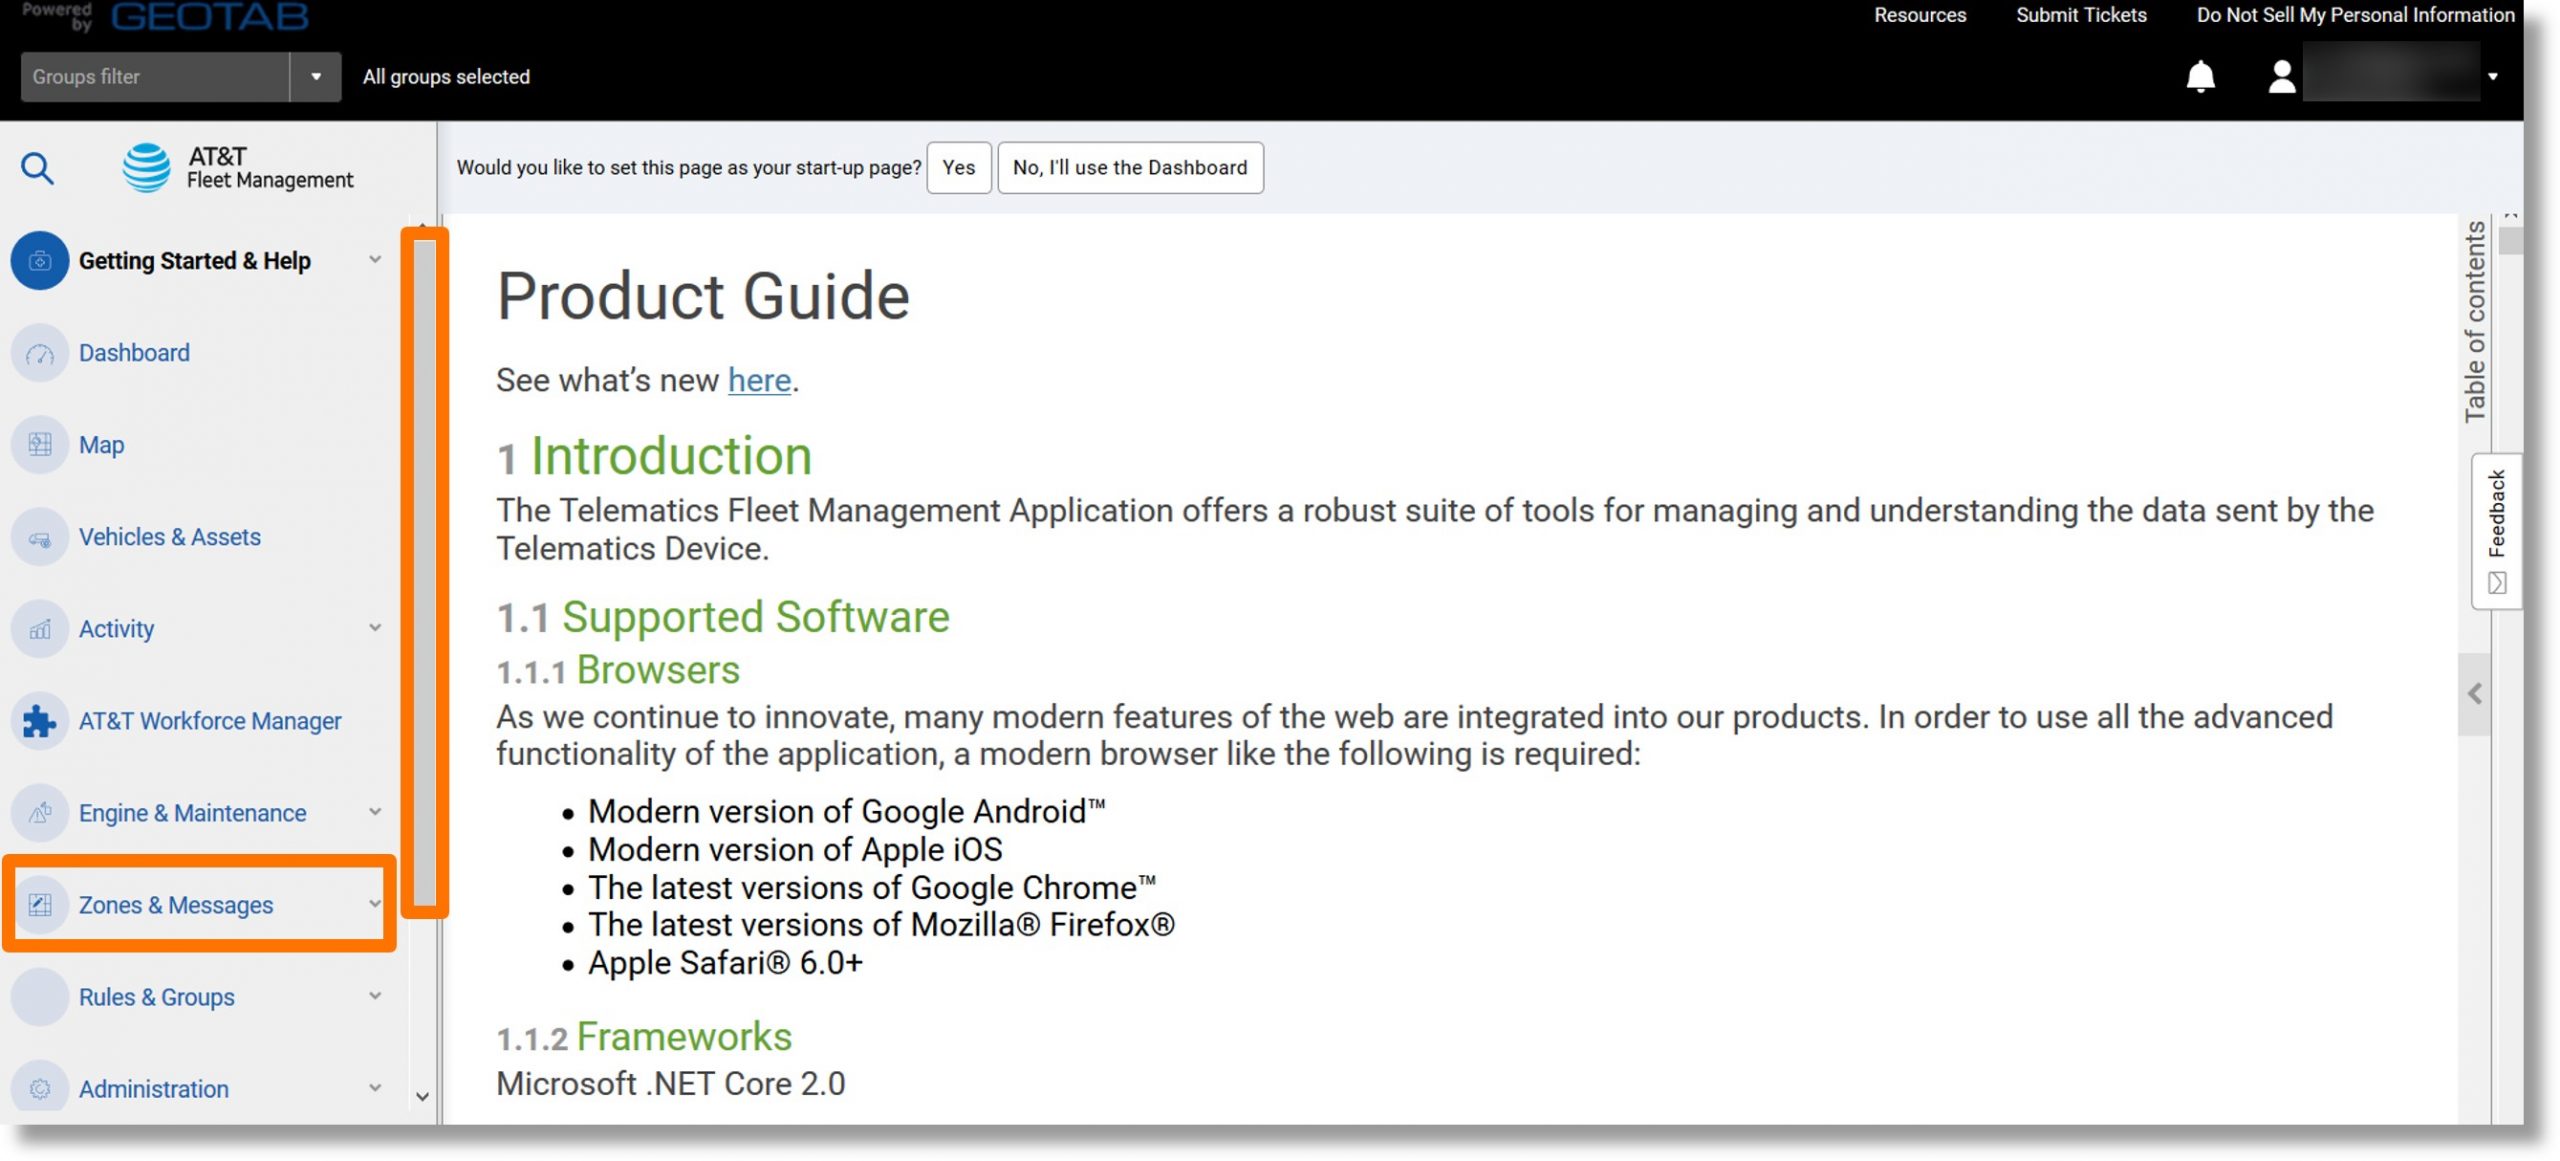
- Click on Routes….
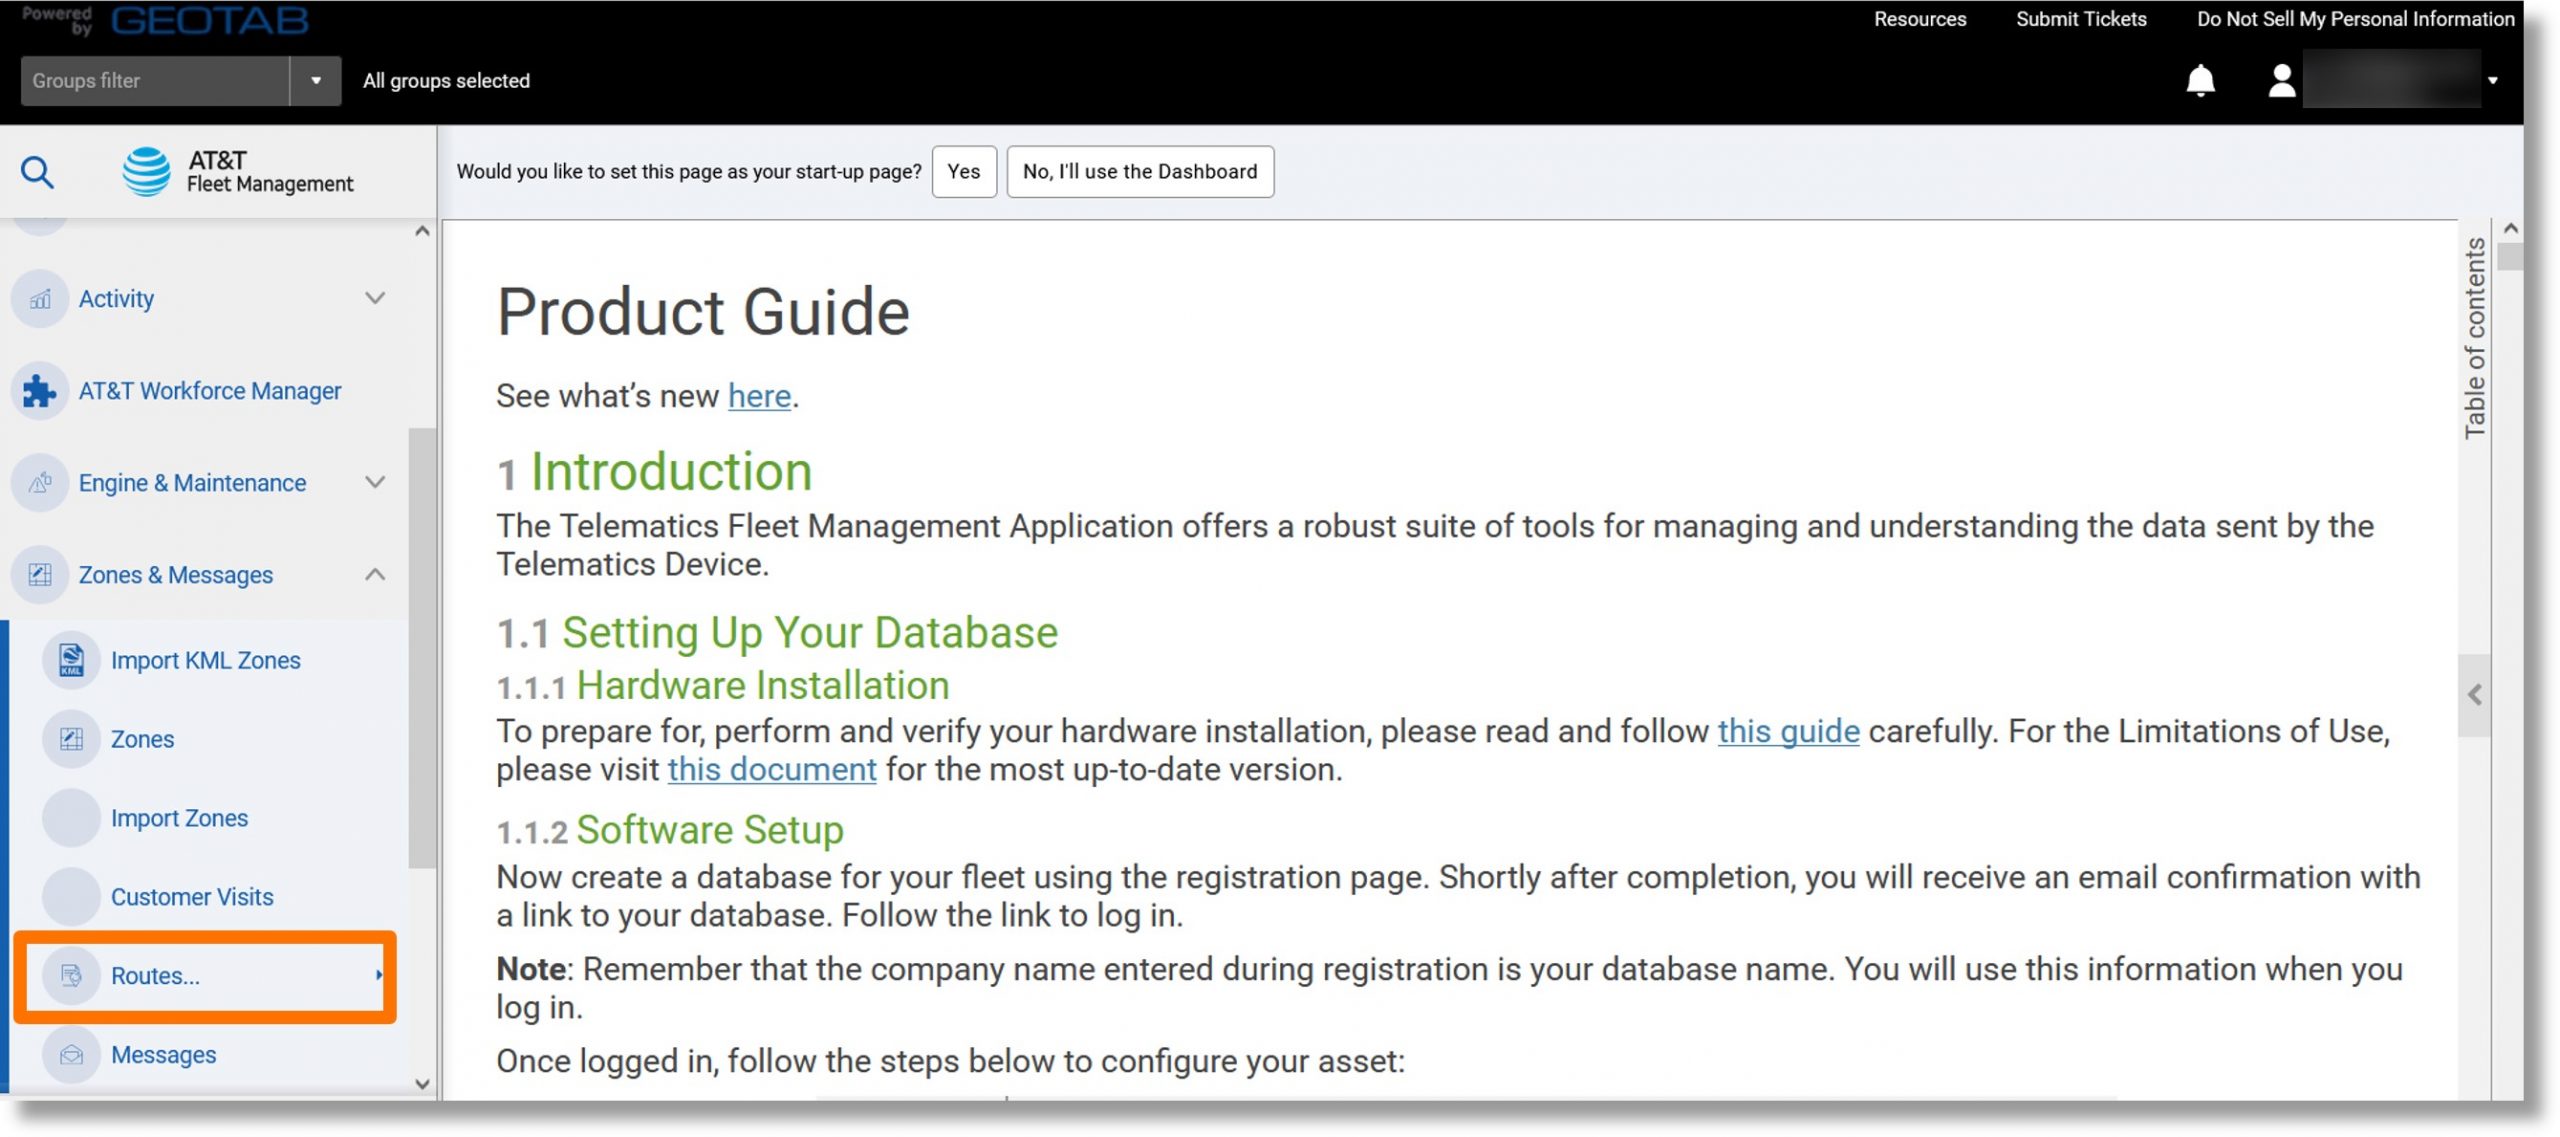
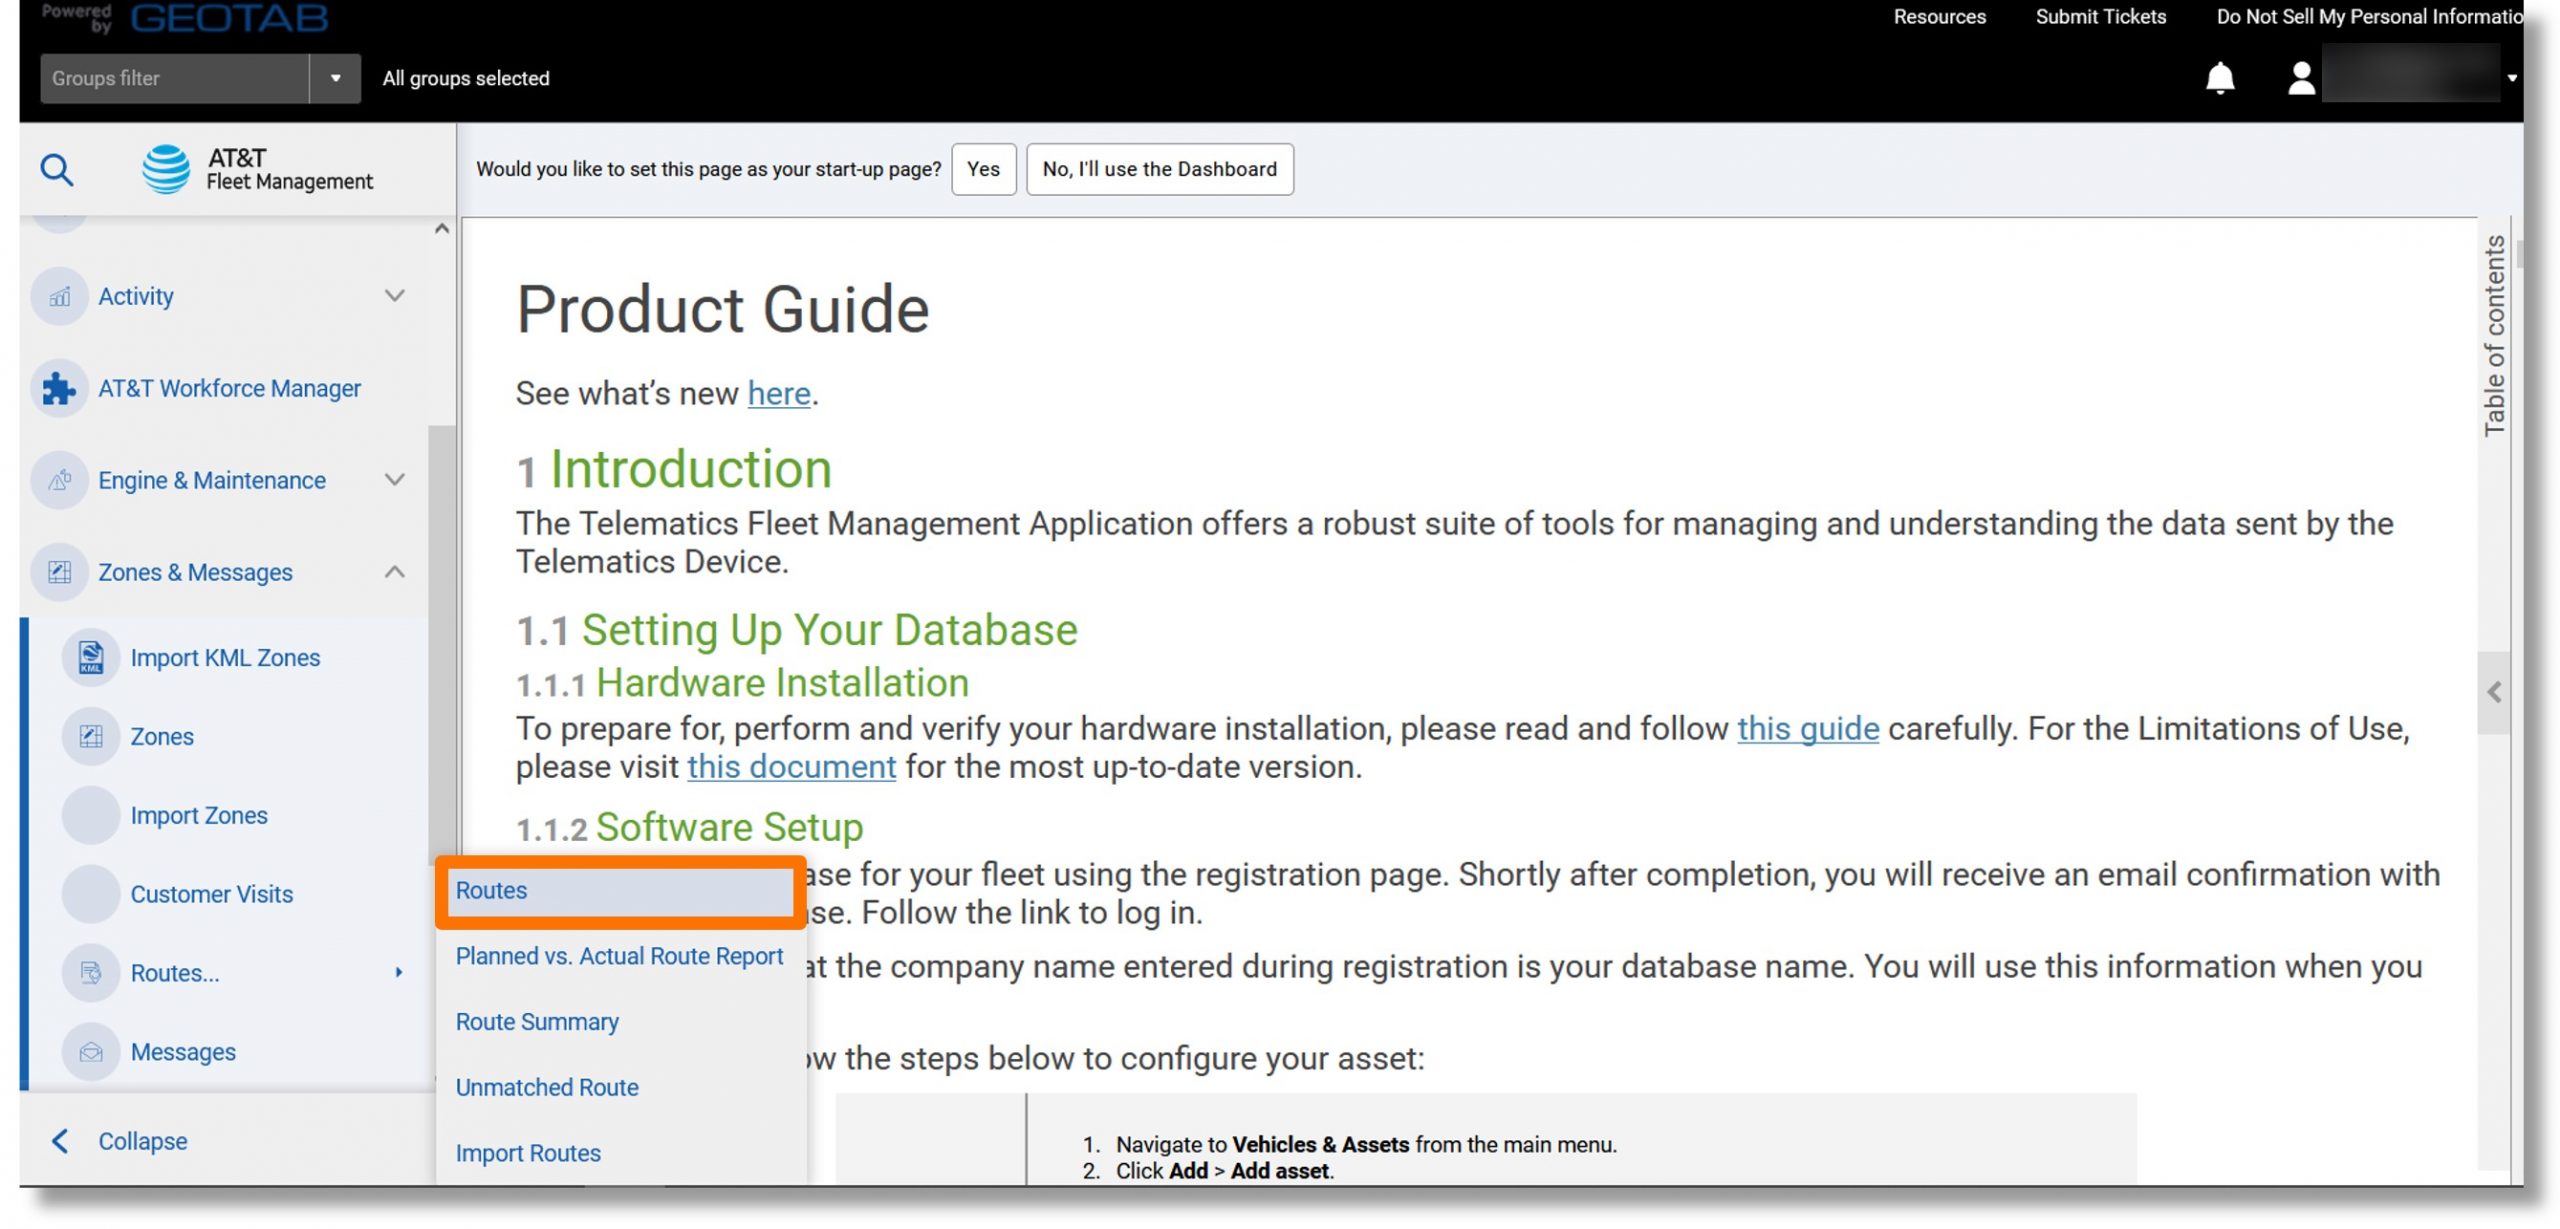
- Click on Routes.
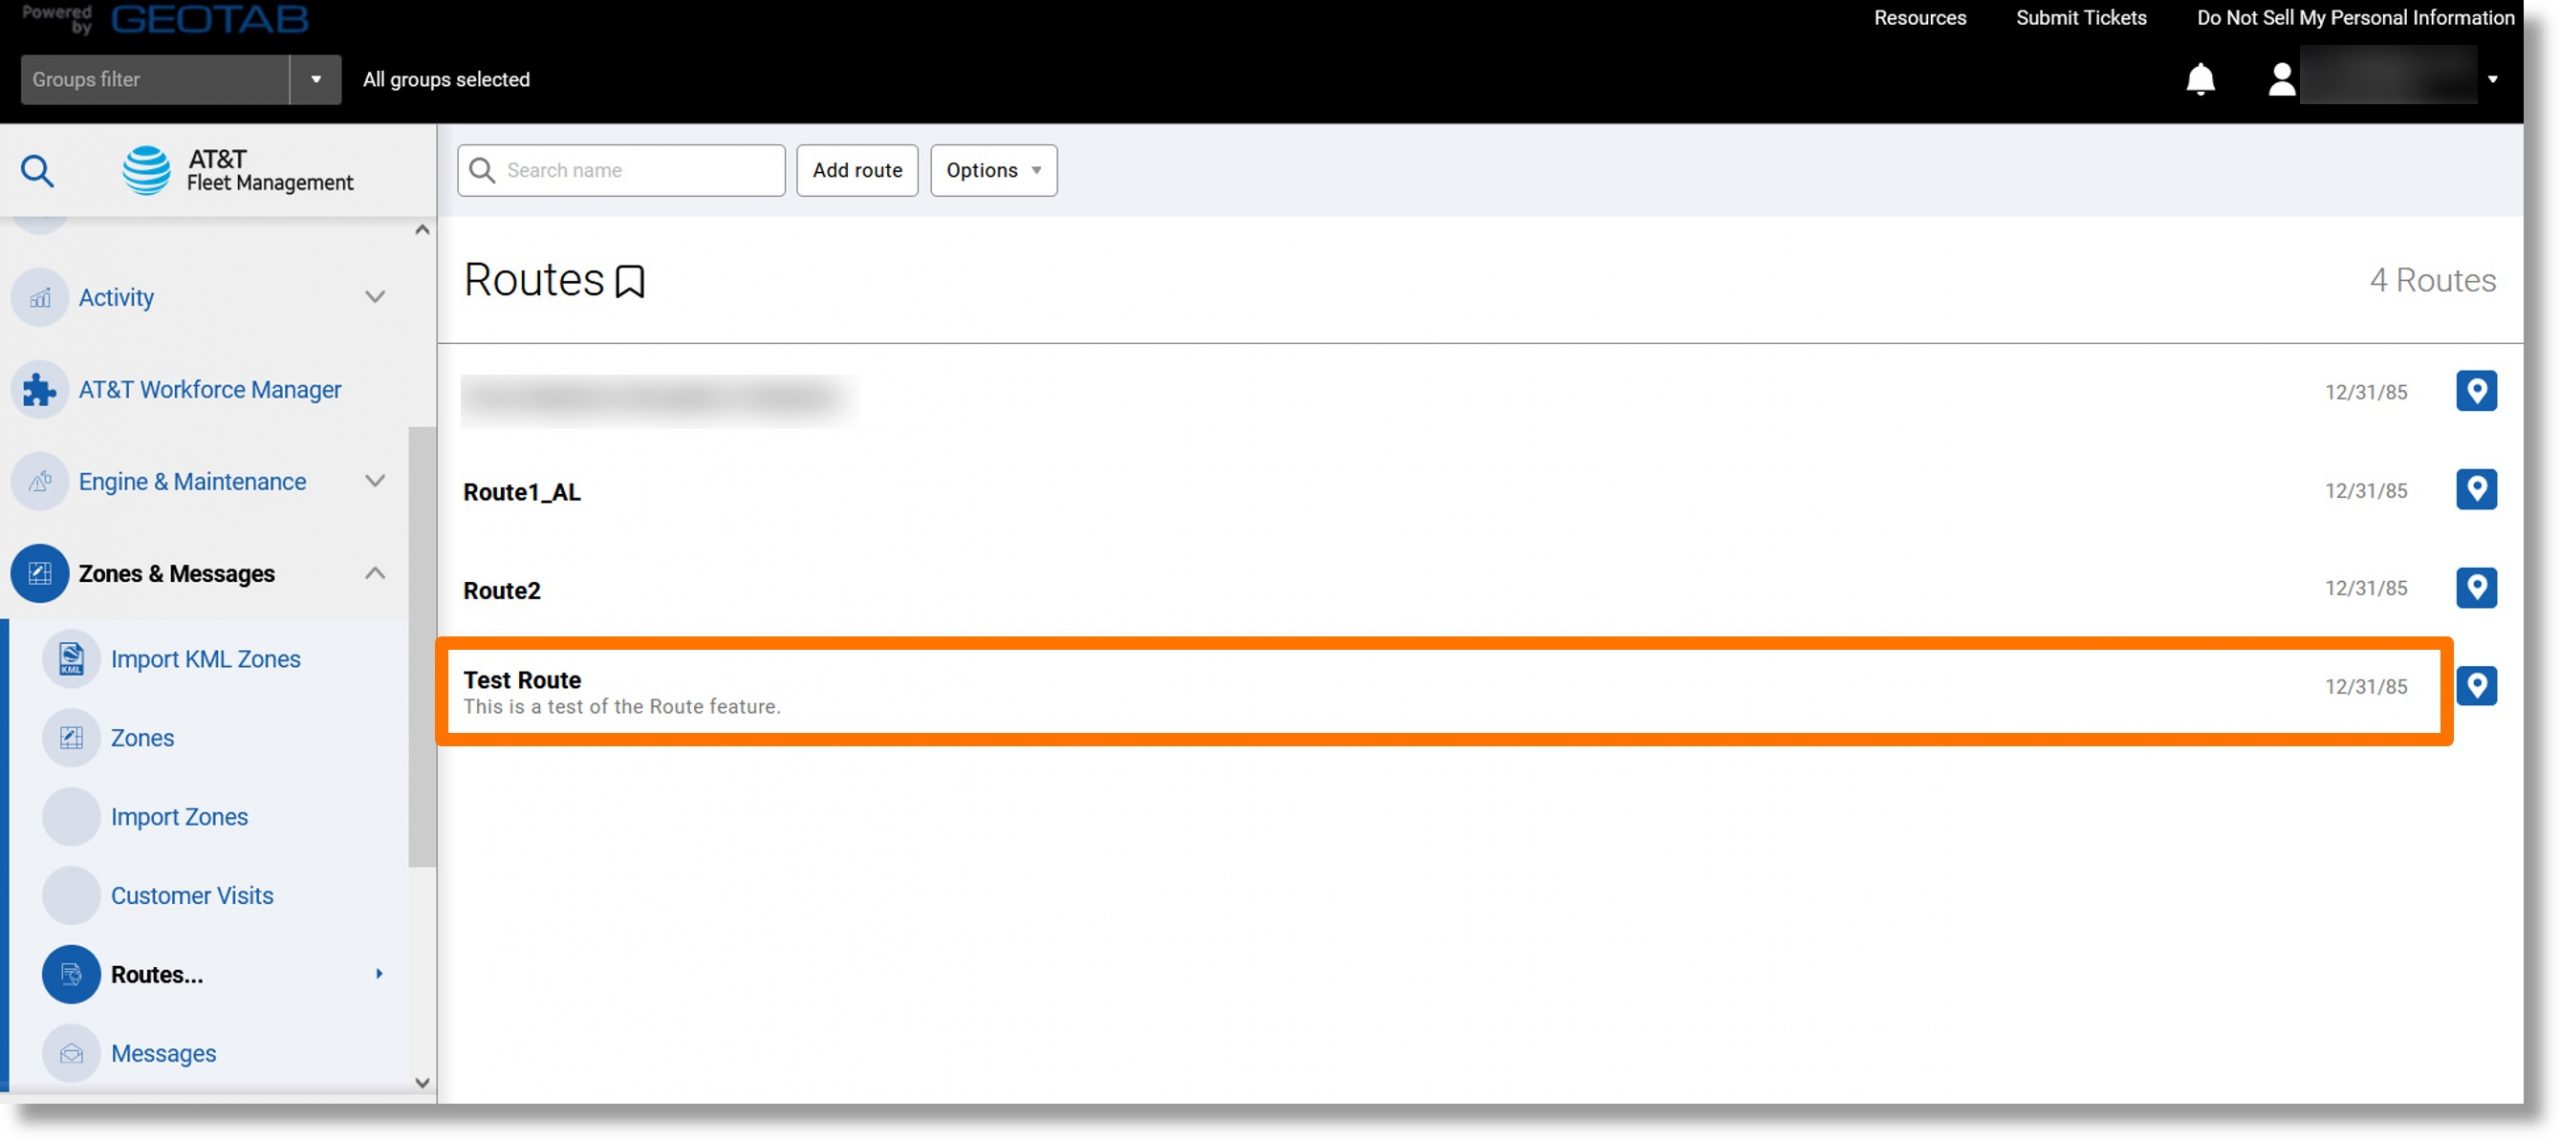
- Click on the desired route.
- Click on the Report dropdown.
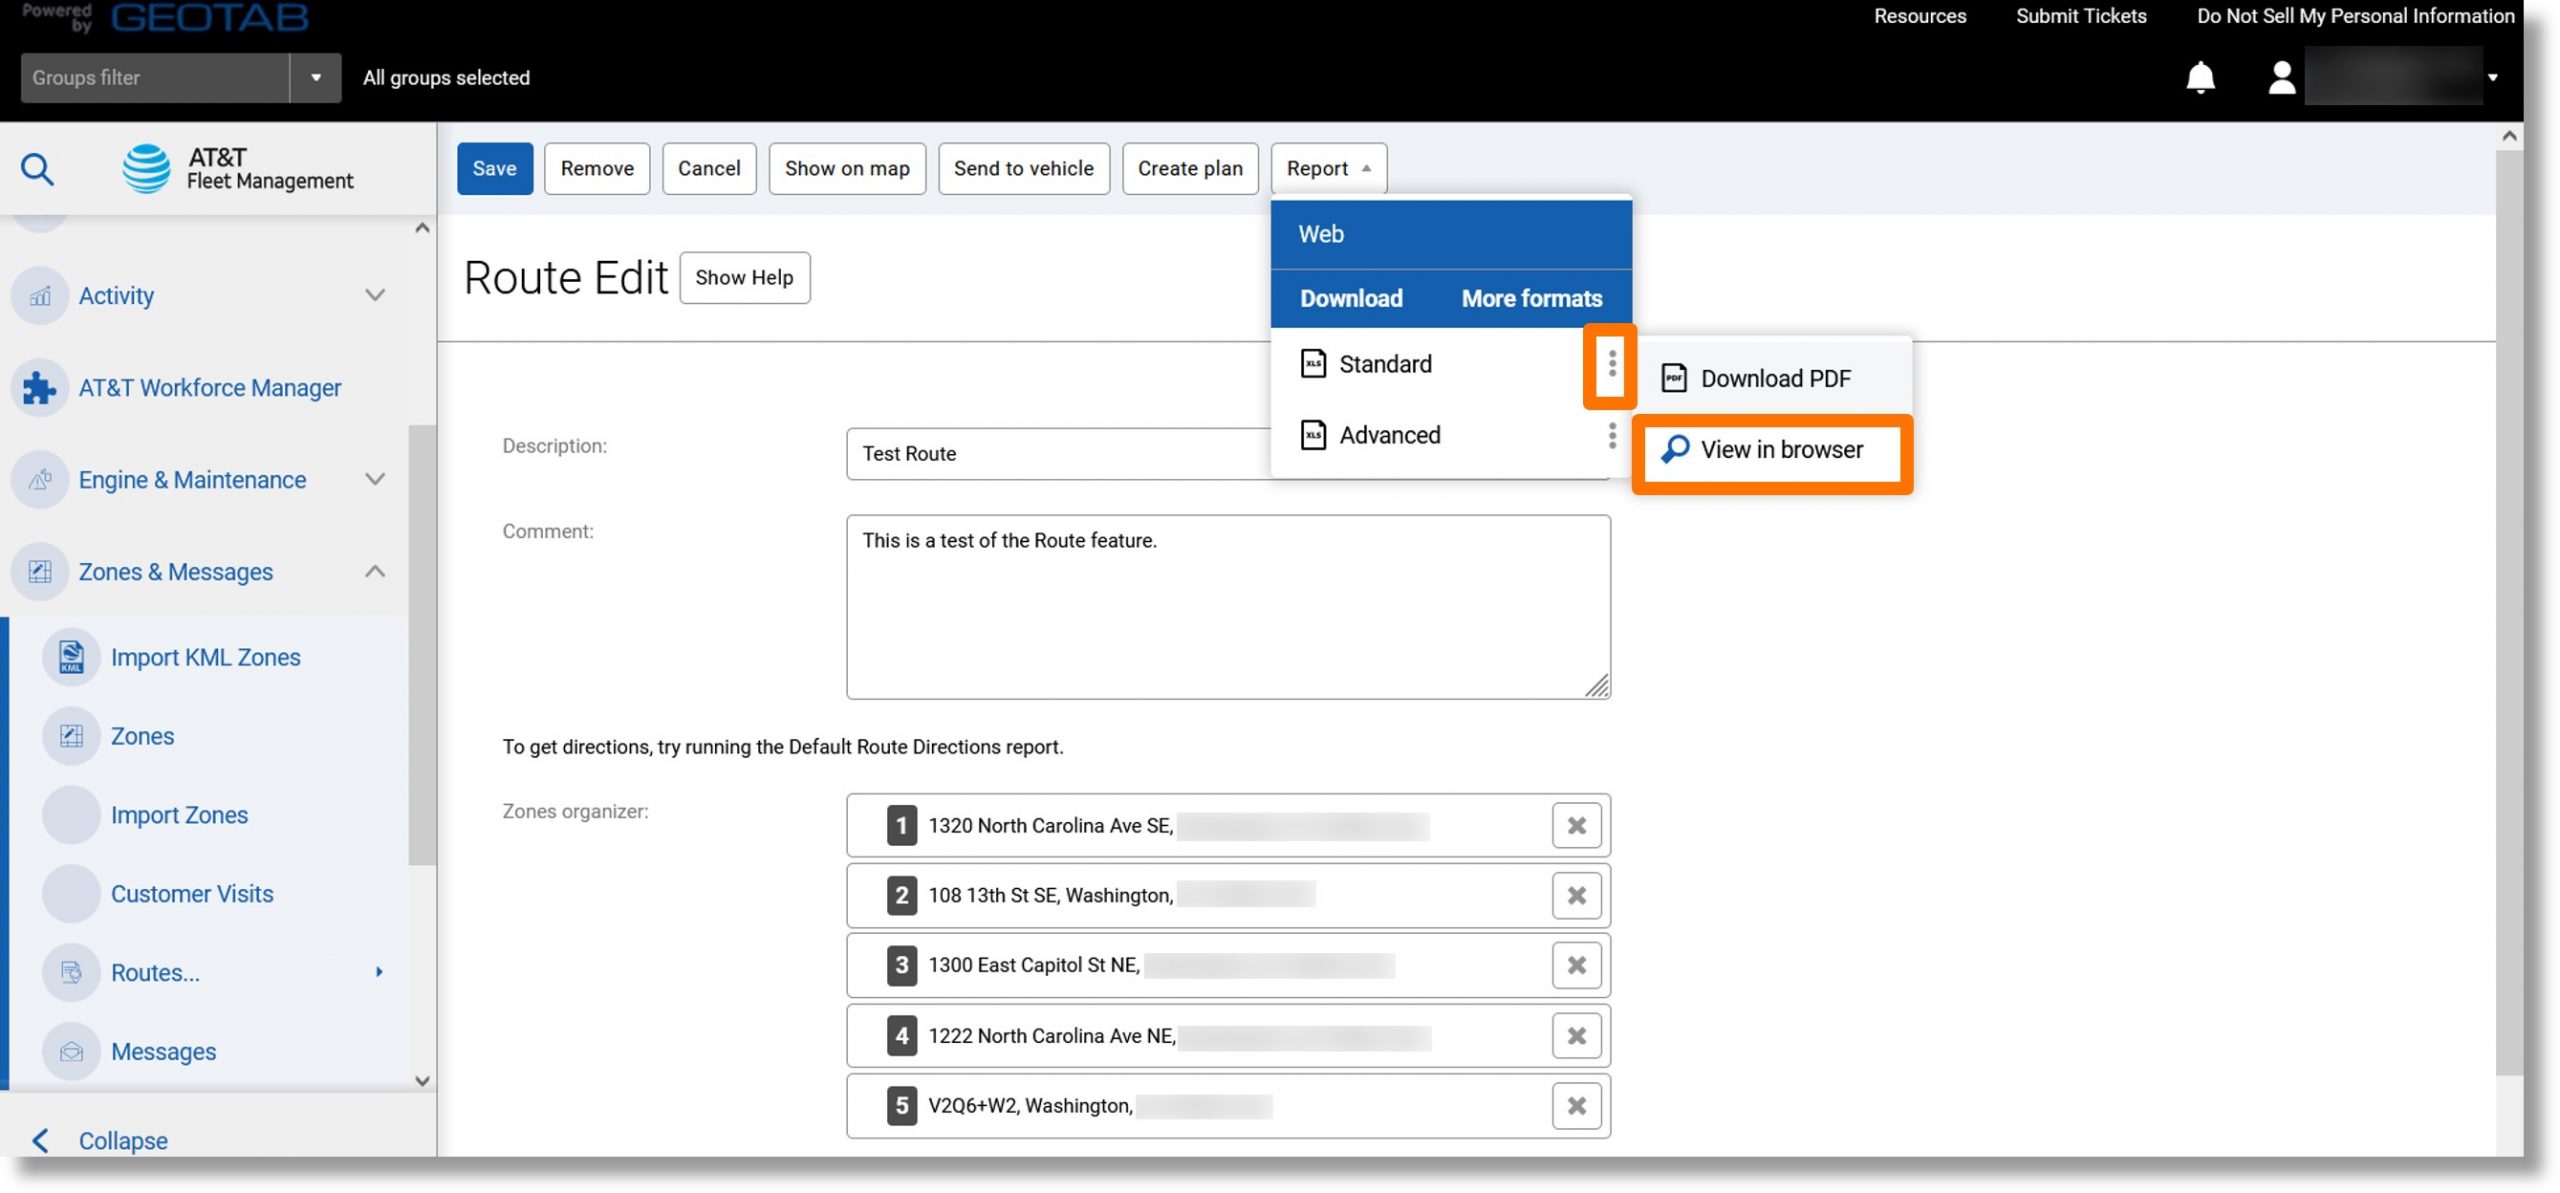
- Click on the ellipsis icon
 to the right of “Standard” or “Advanced” and then click on View in browser.
- The route directions display.
Top
Unassigned Route Report
Use: Determine the distance traveled that was not included in the assigned route.
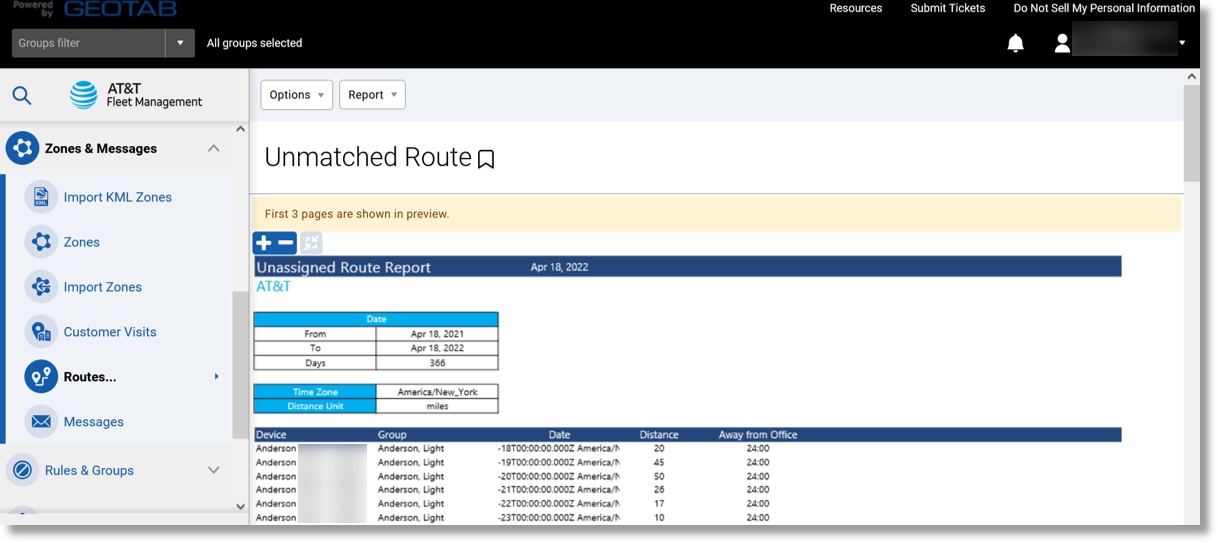
Information included: Device, group, date and time, distance traveled.
Accessing the report:
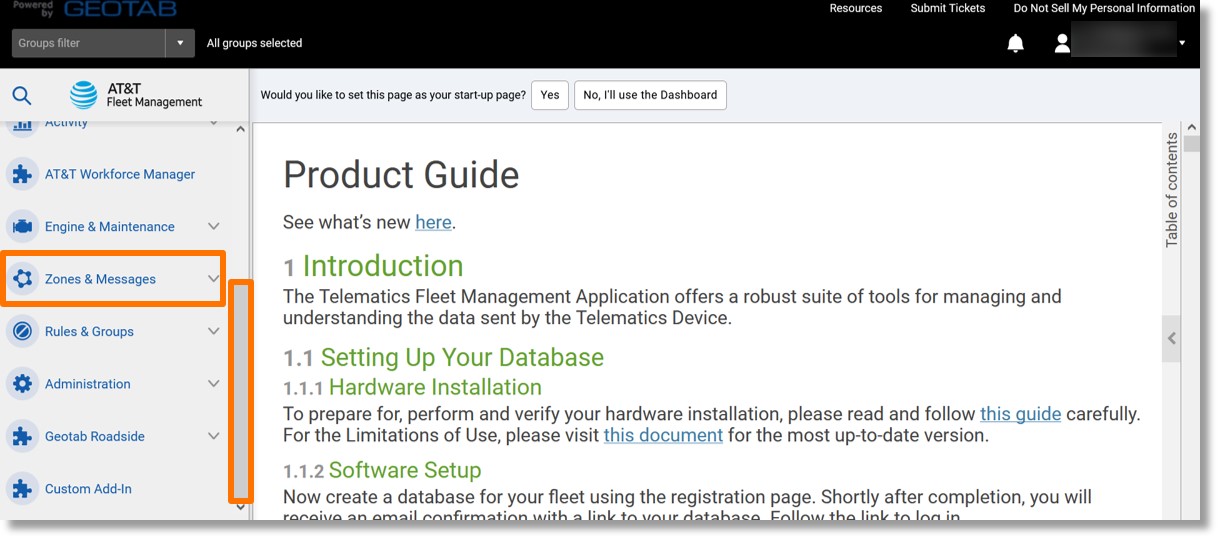
- Scroll down to “Zones & Messages” in the menu on the left.
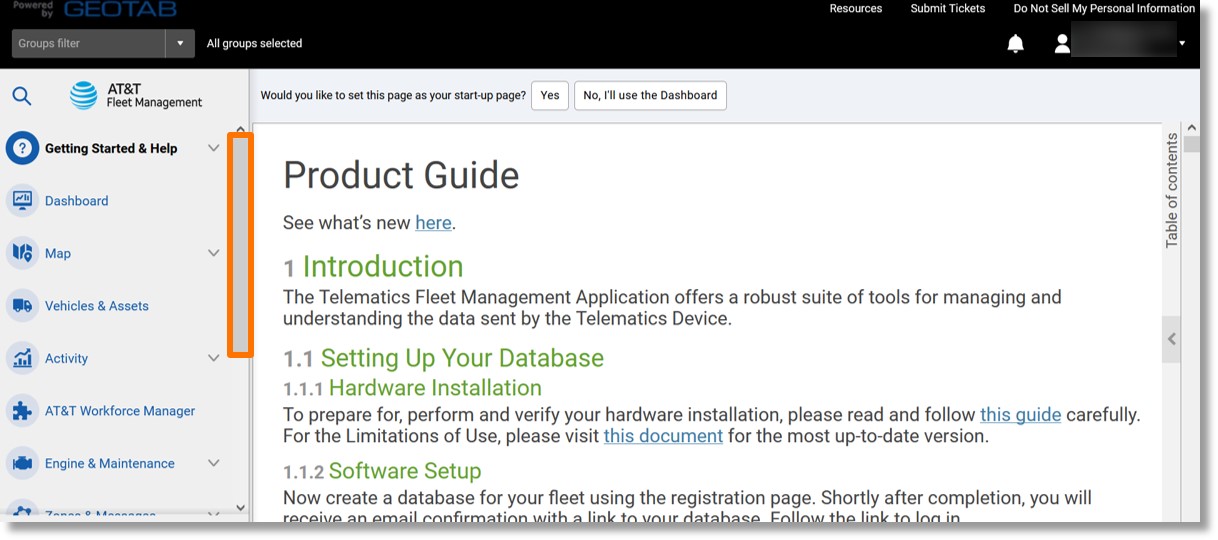
- Click on Zones & Messages and then scroll down.
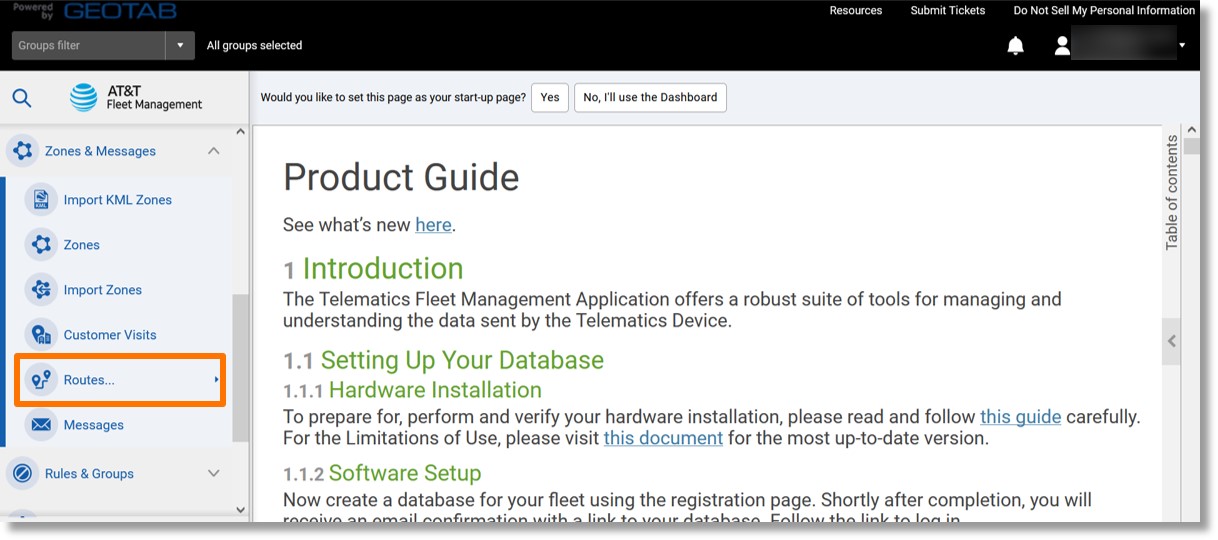
- Click on Routes….
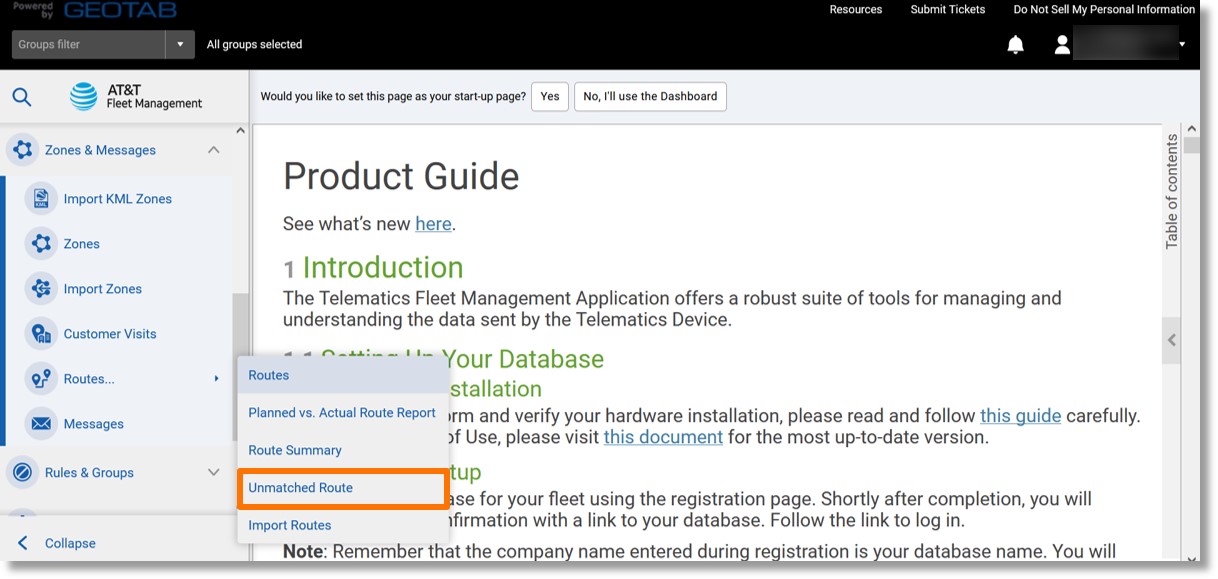
- Click on Unmatched Route.
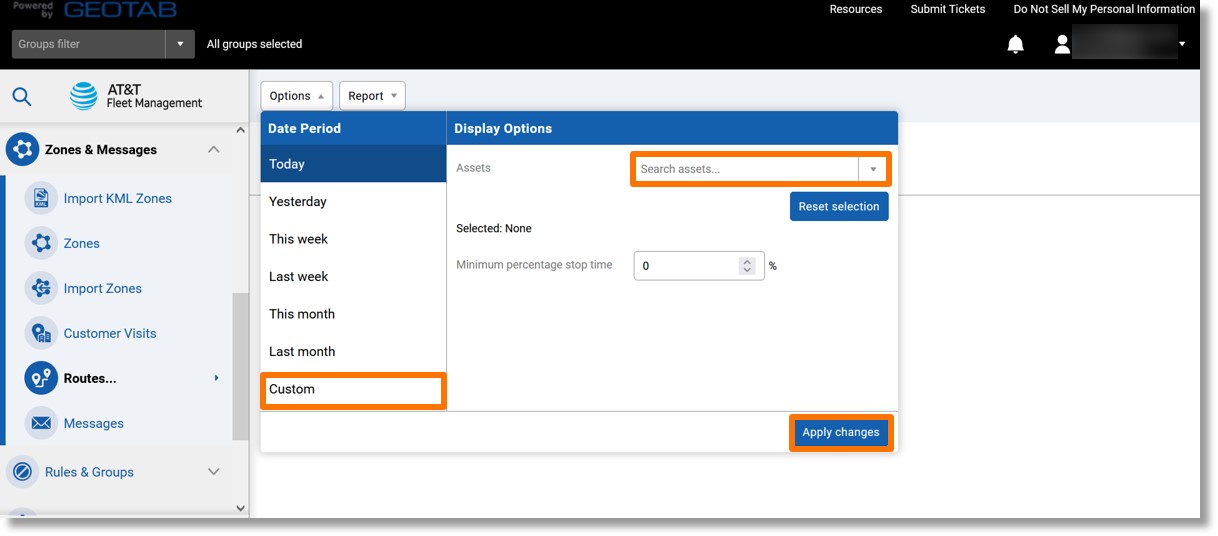
- Select the desired parameters and then click the Apply changes button.
- Click on the Report dropdown.
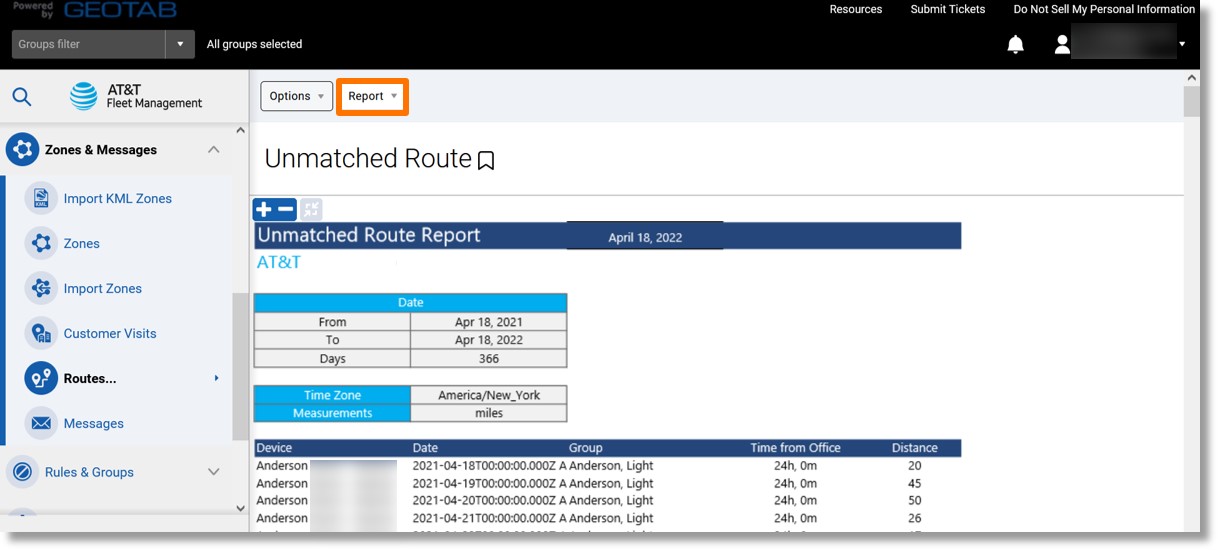
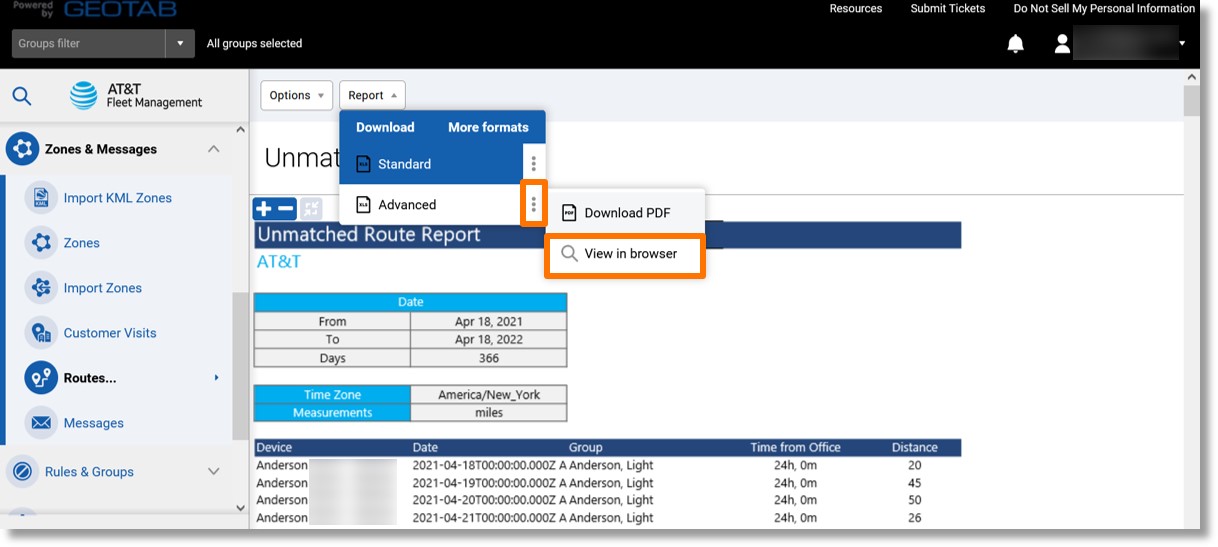
- Click on the ellipsis icon
 to the right of either “Standard” or “Advanced” and then click on View in browser.
- The Unassigned Route report displays.
Top


