AccessMyLAN Dashboard Overview
The dashboard includes a quick way to see information on connections, data usage, device locations and more.
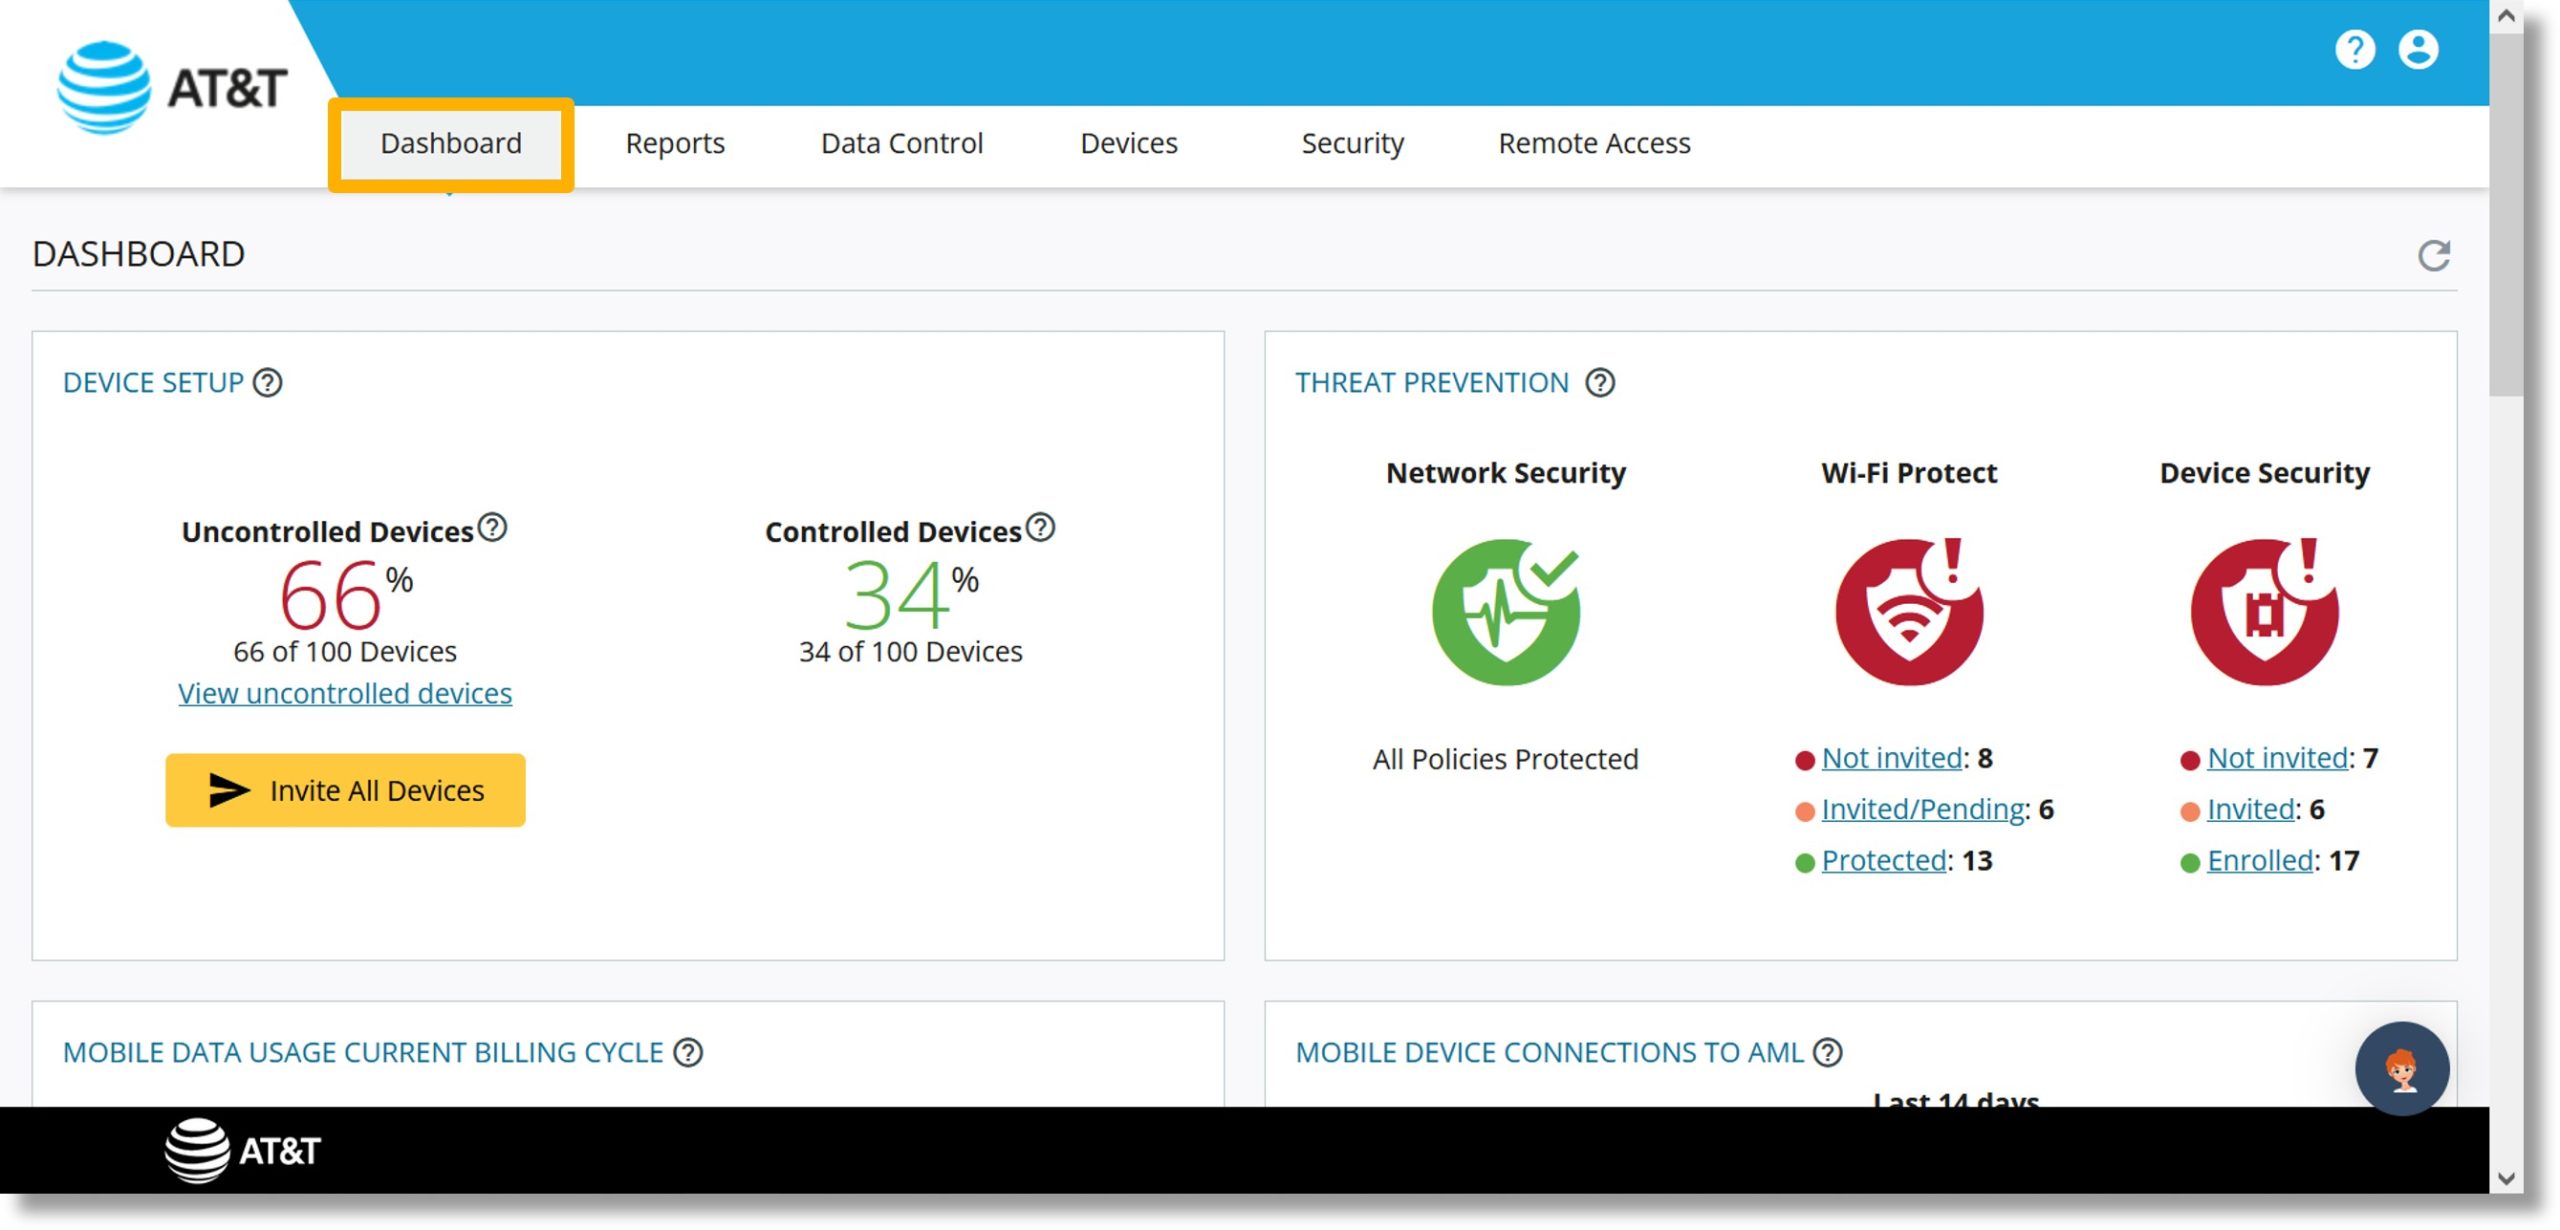
Device Setup
- Click on the Dashboard tab at the top of the page.

- Scroll to the “DEVICE SETUP” tile.
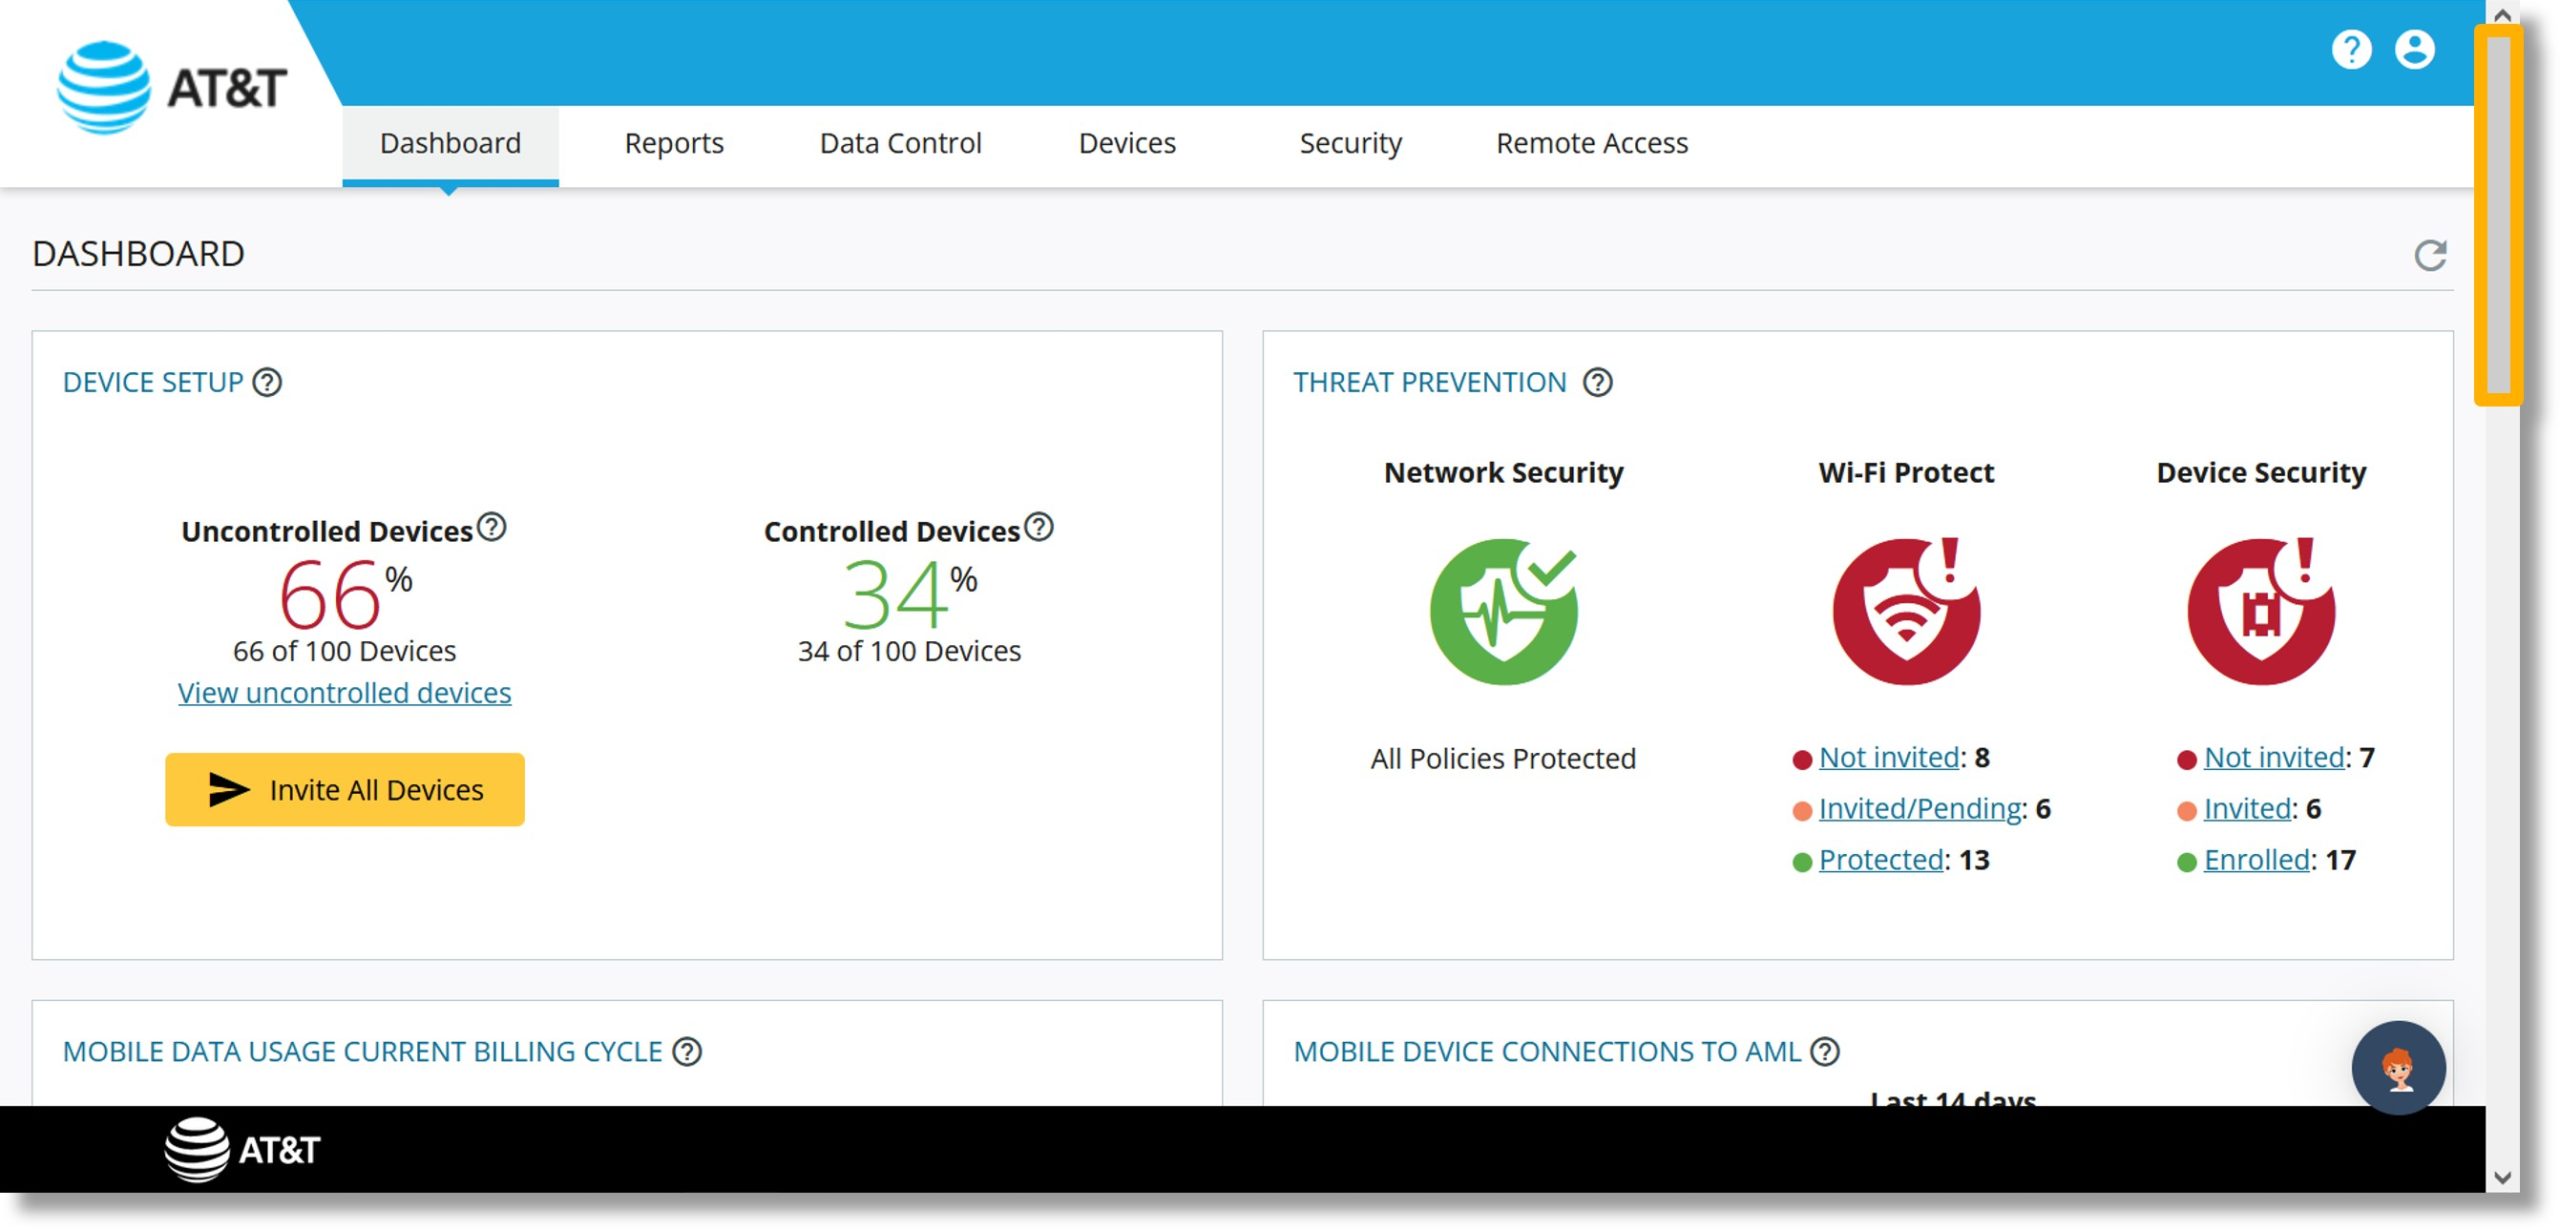
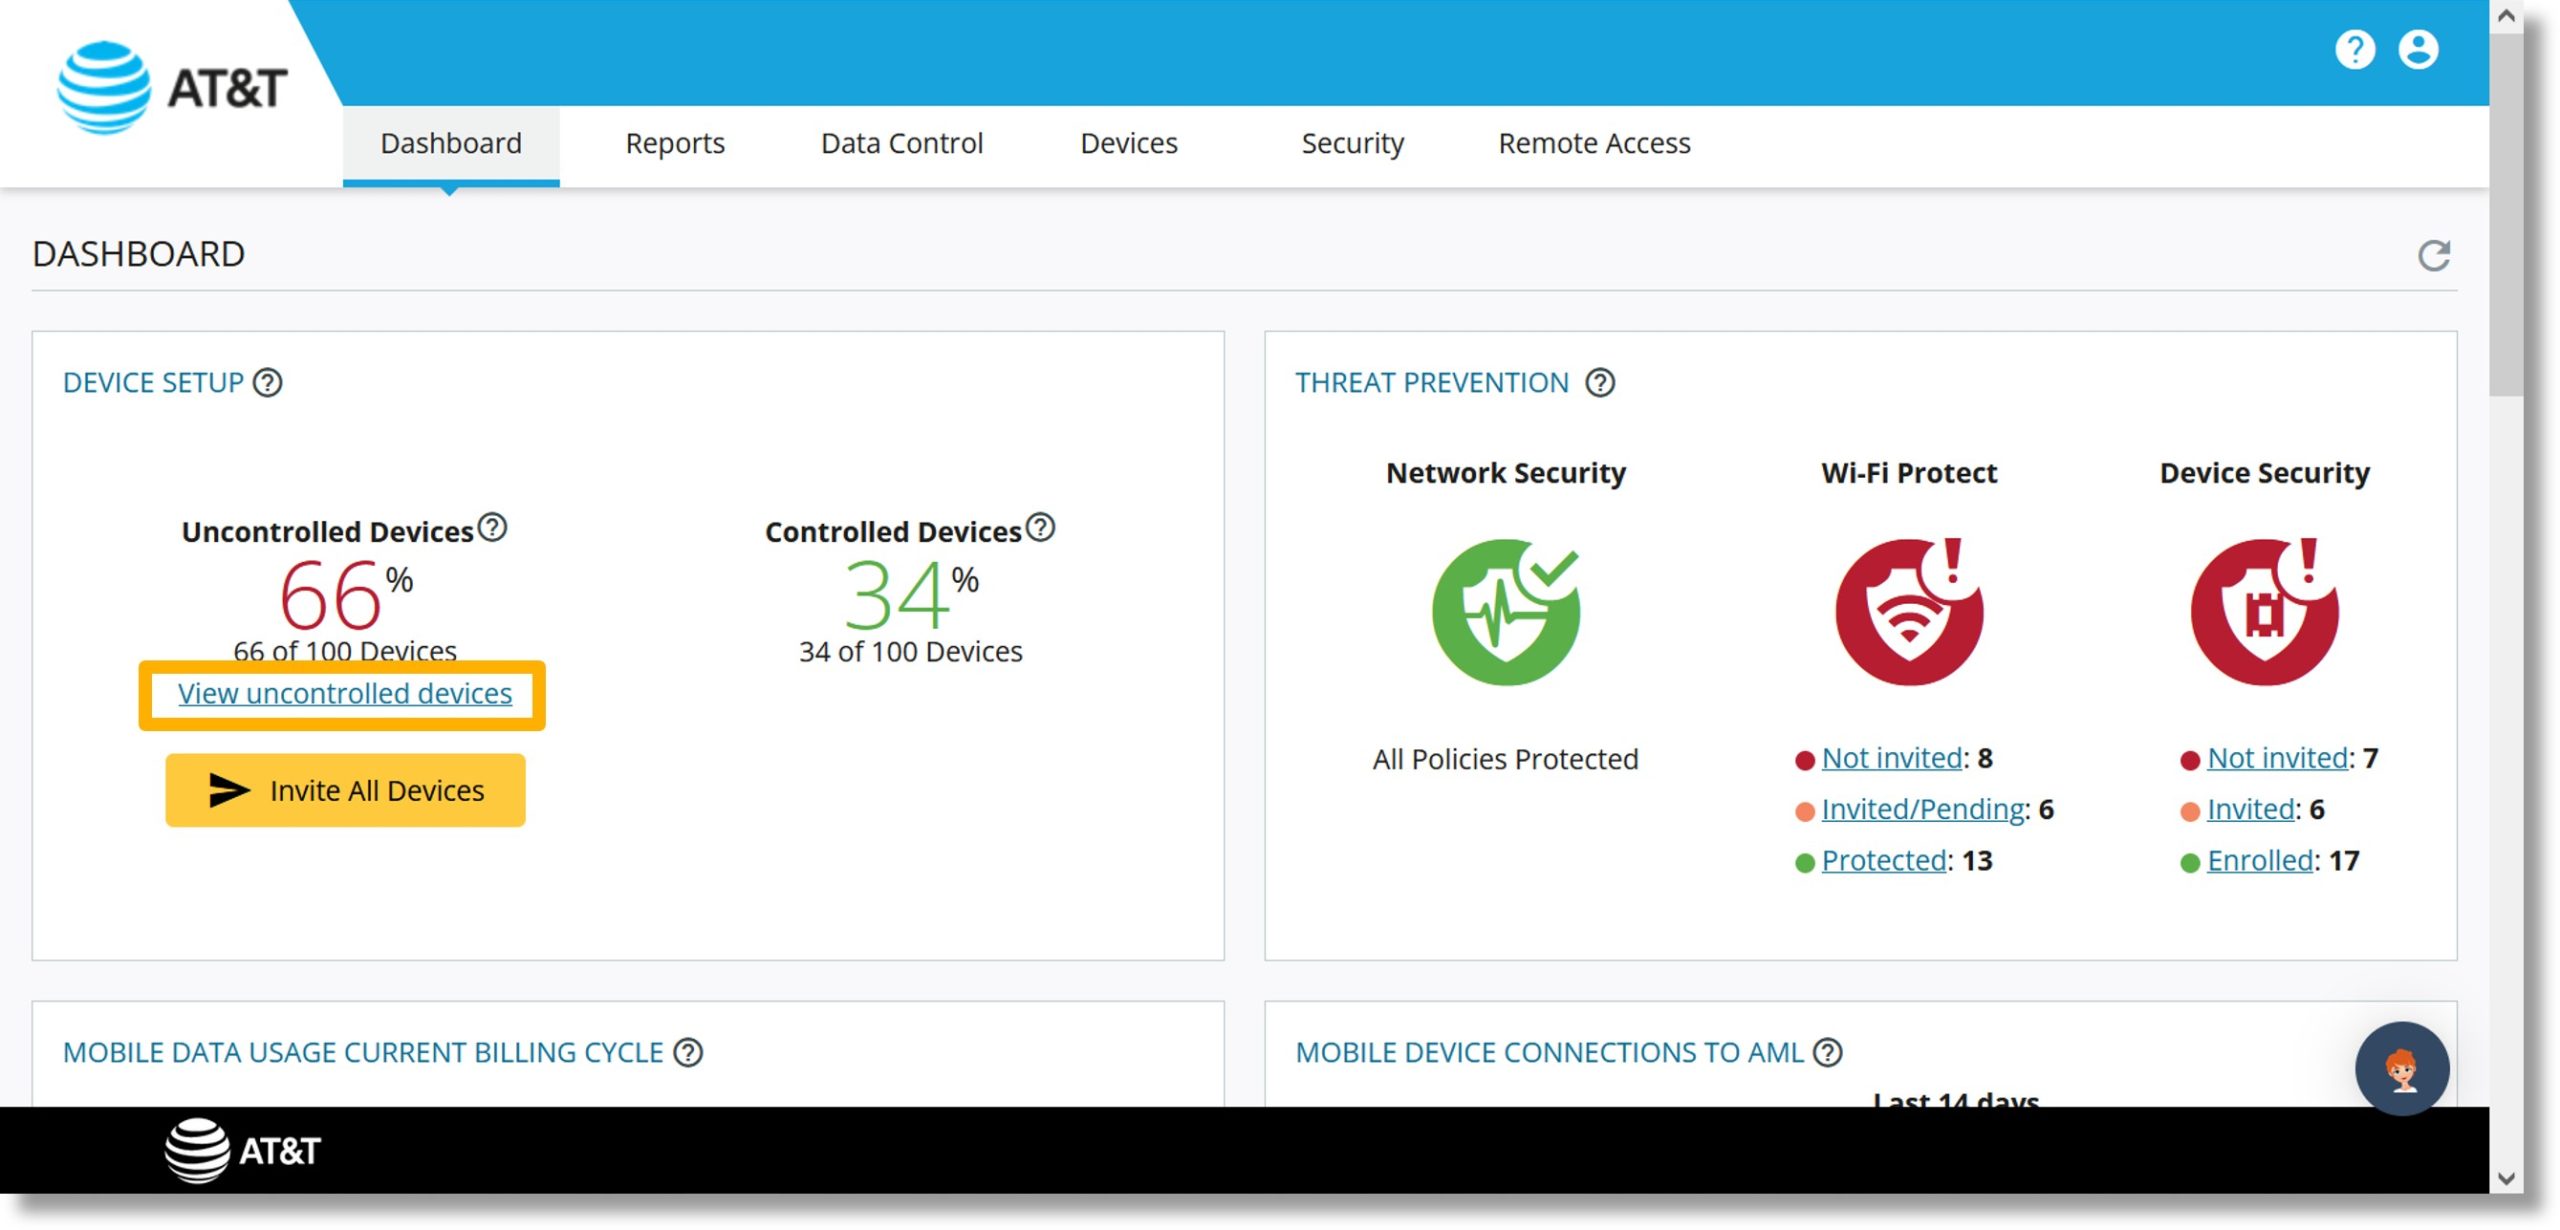
- The tile lists the Uncontrolled Devices and Controlled Device percentages.
- Click on the link under Uncontrolled devices.
Note: you can also click on the Invite All Devices button.
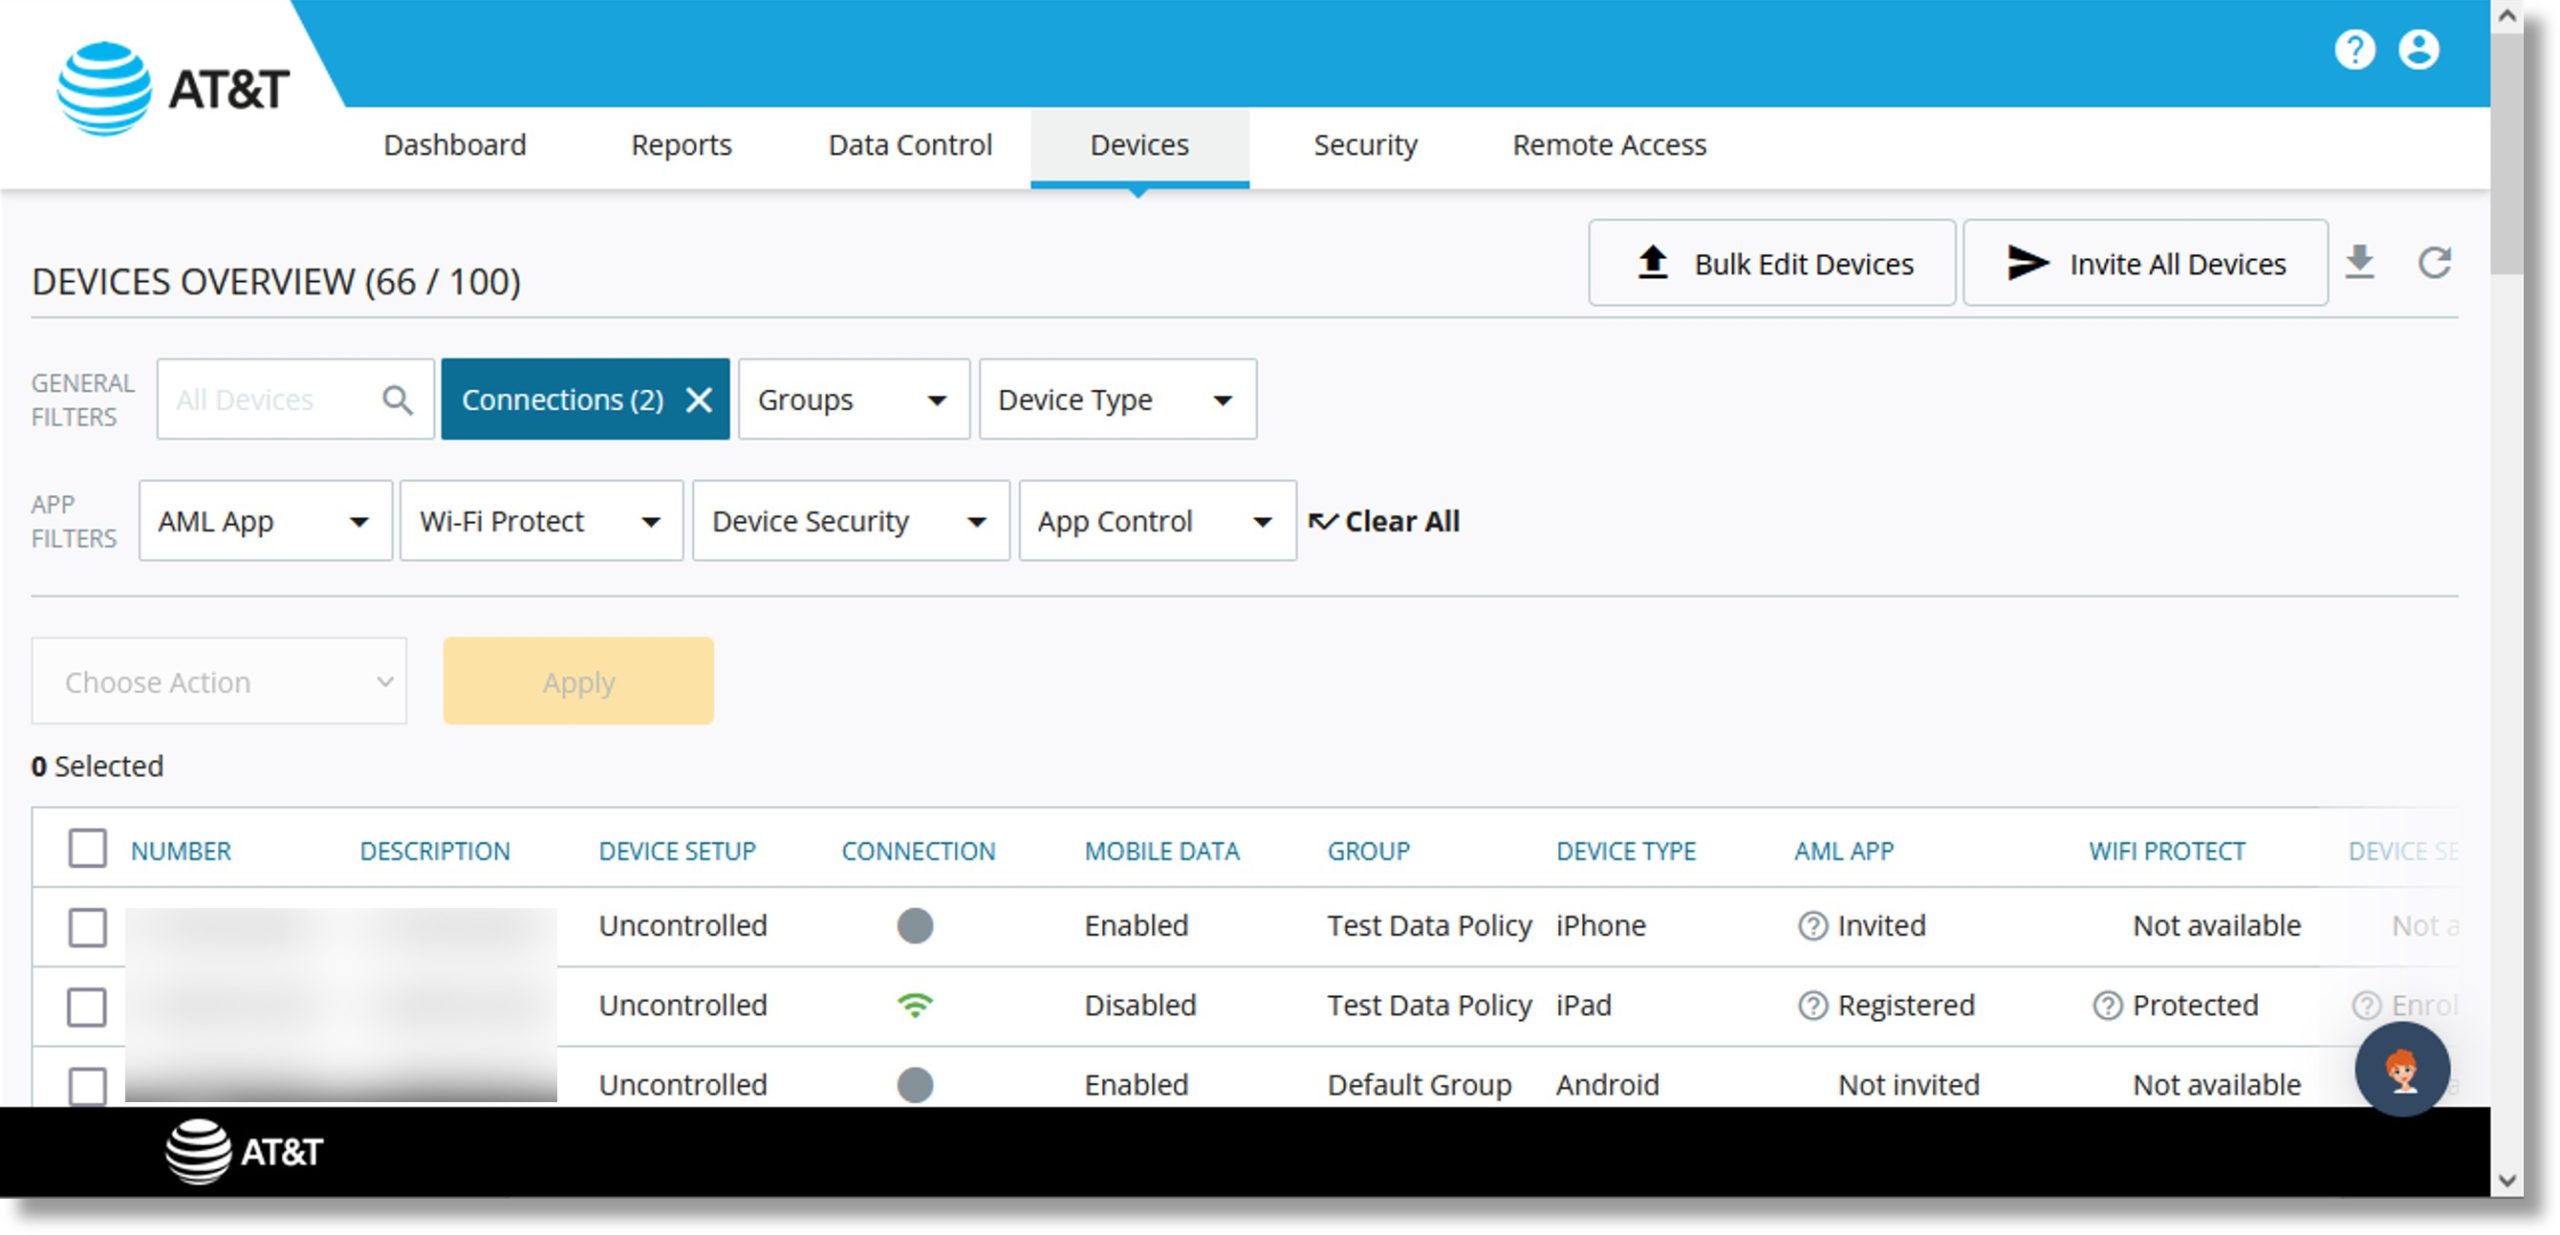
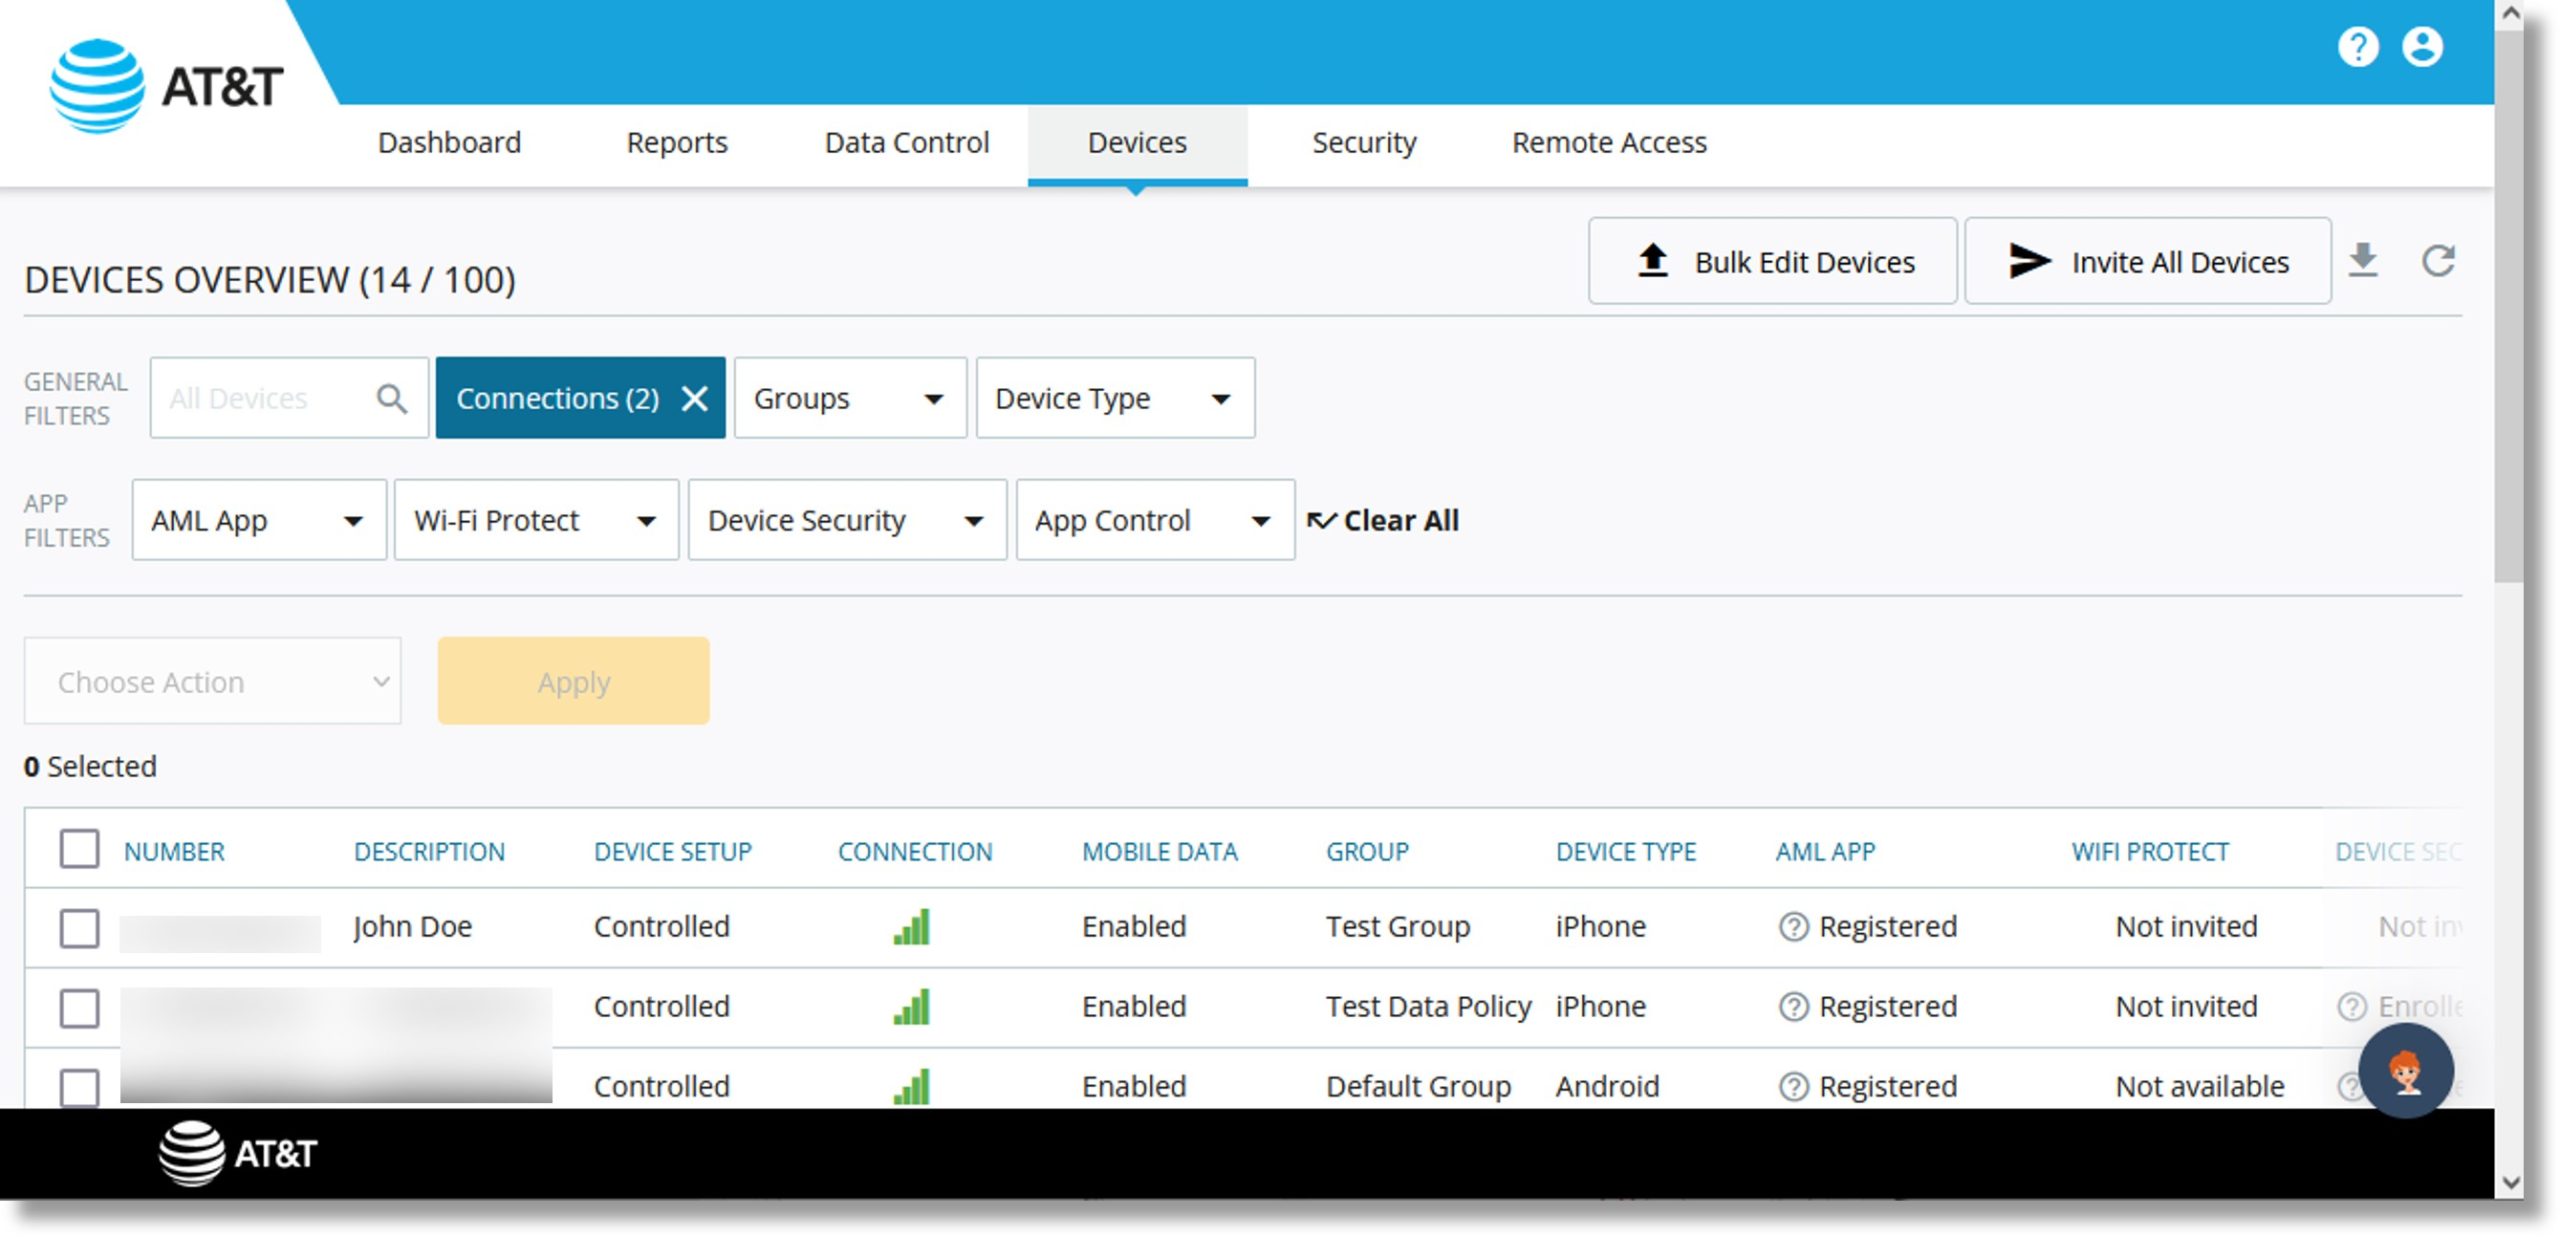
- The device list displays, and you can take the desired actions.
Threat Prevention
- Click on the Dashboard tab at the top of the page.

- Scroll to the “THREAT PREVENTION” tile.

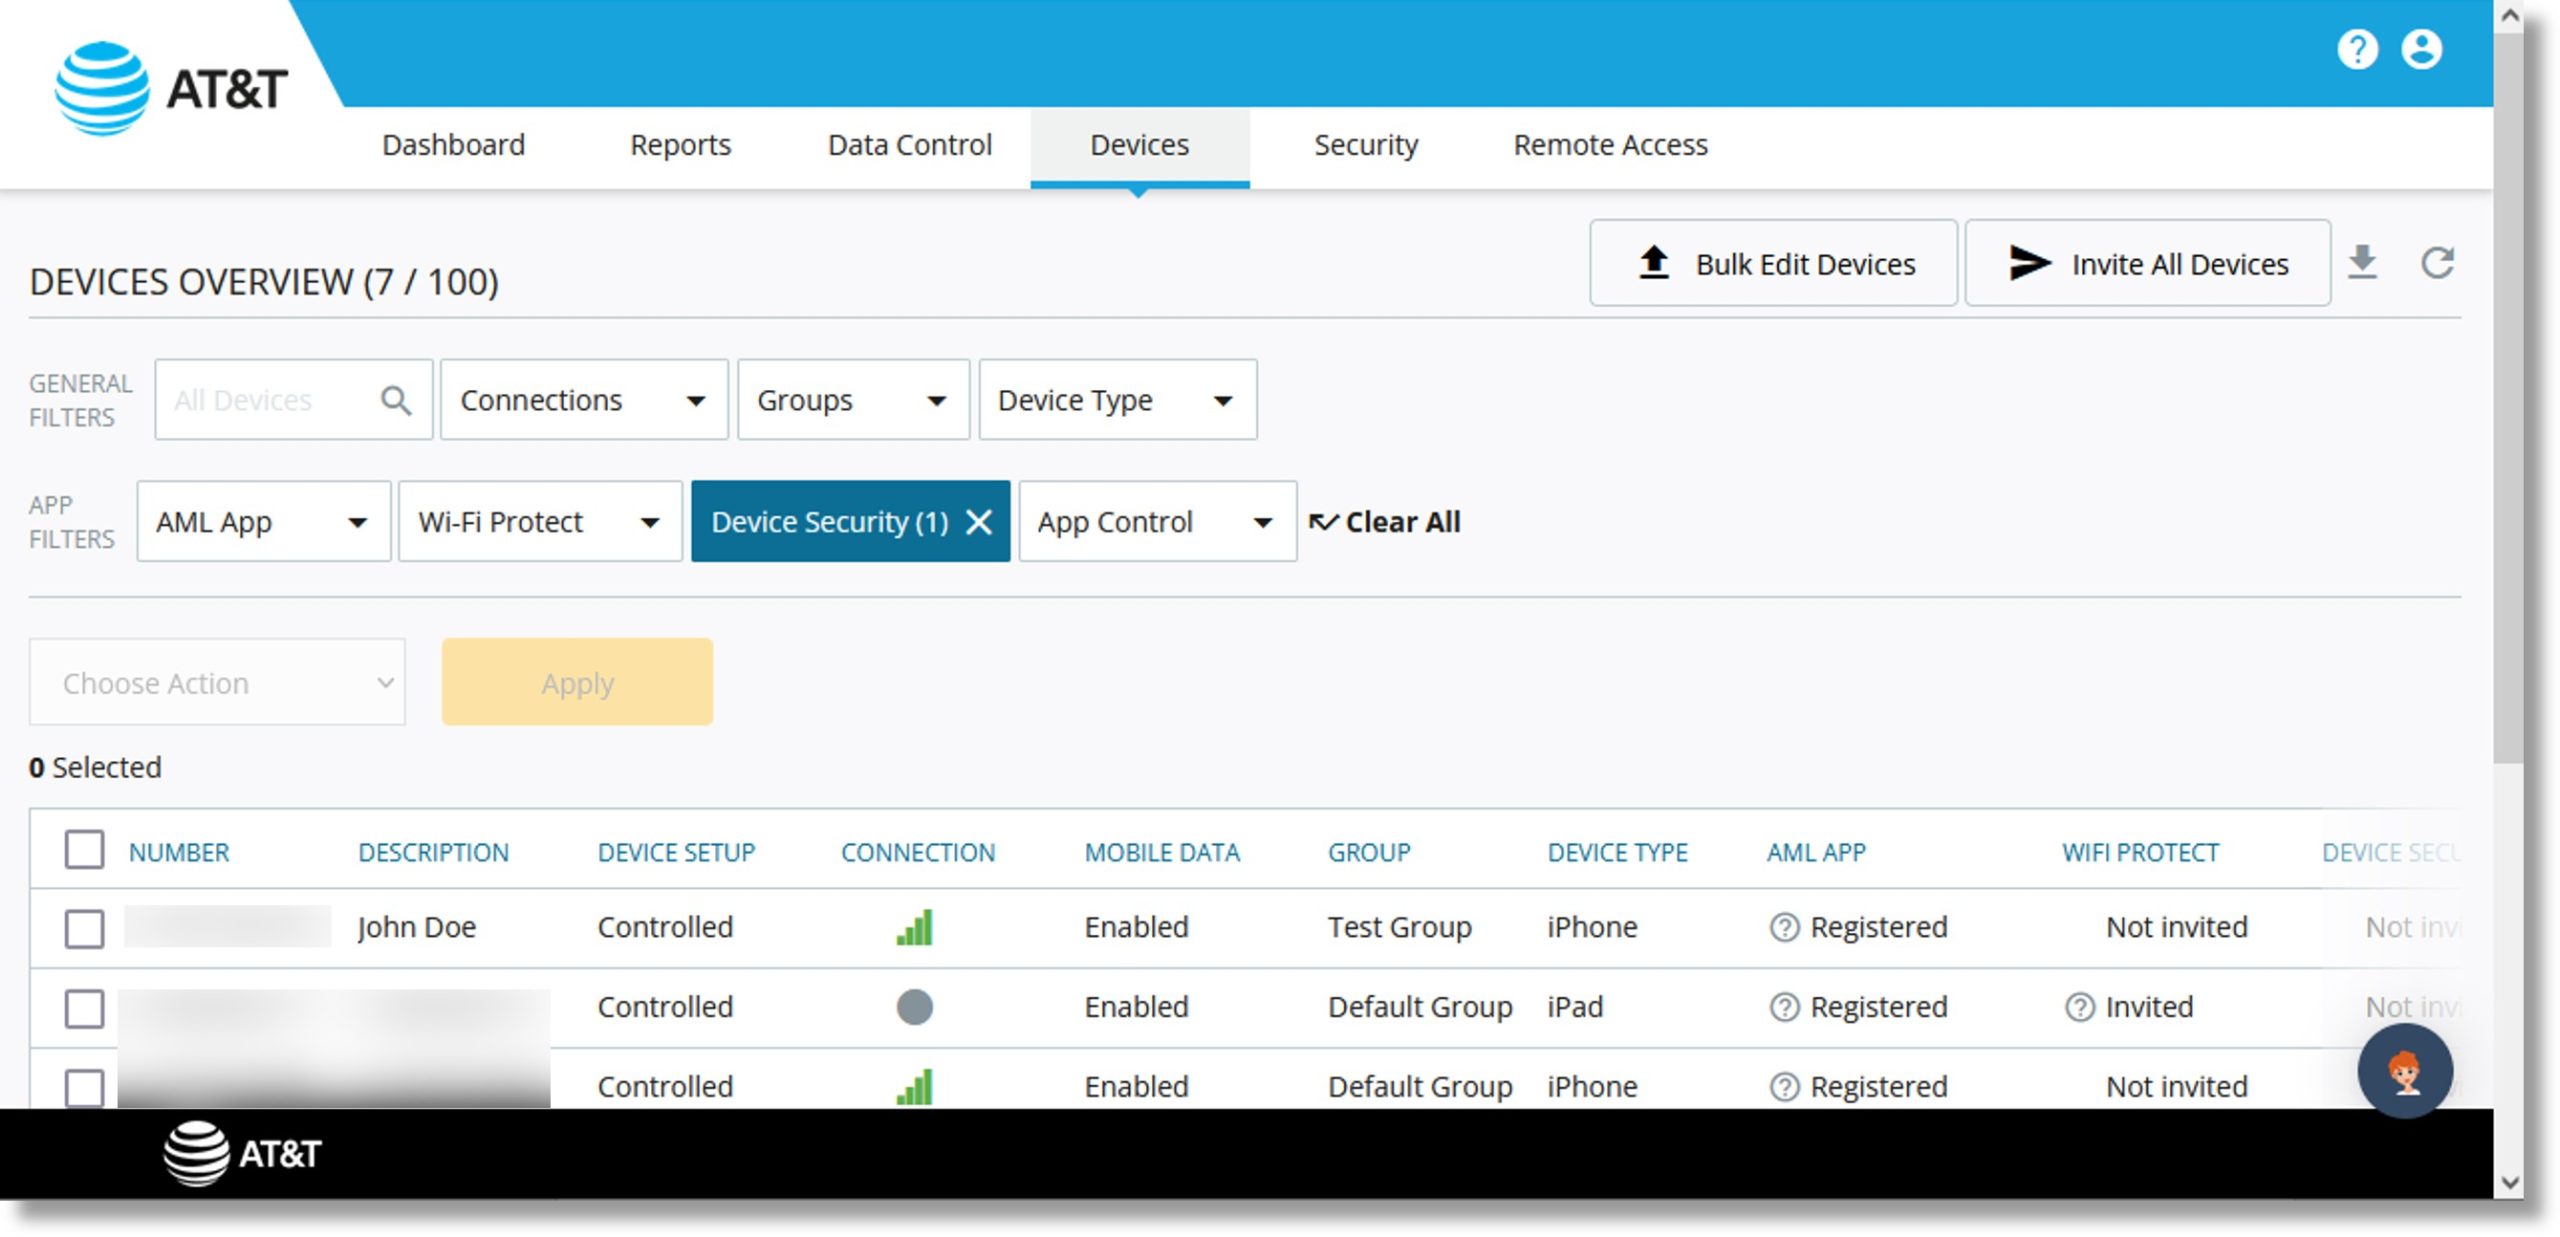
- The report displays “Not invited”, “Invited/Pending”, “Invited”, “Protected”, and “Enrolled”.
- Click on the link for the desired device category.
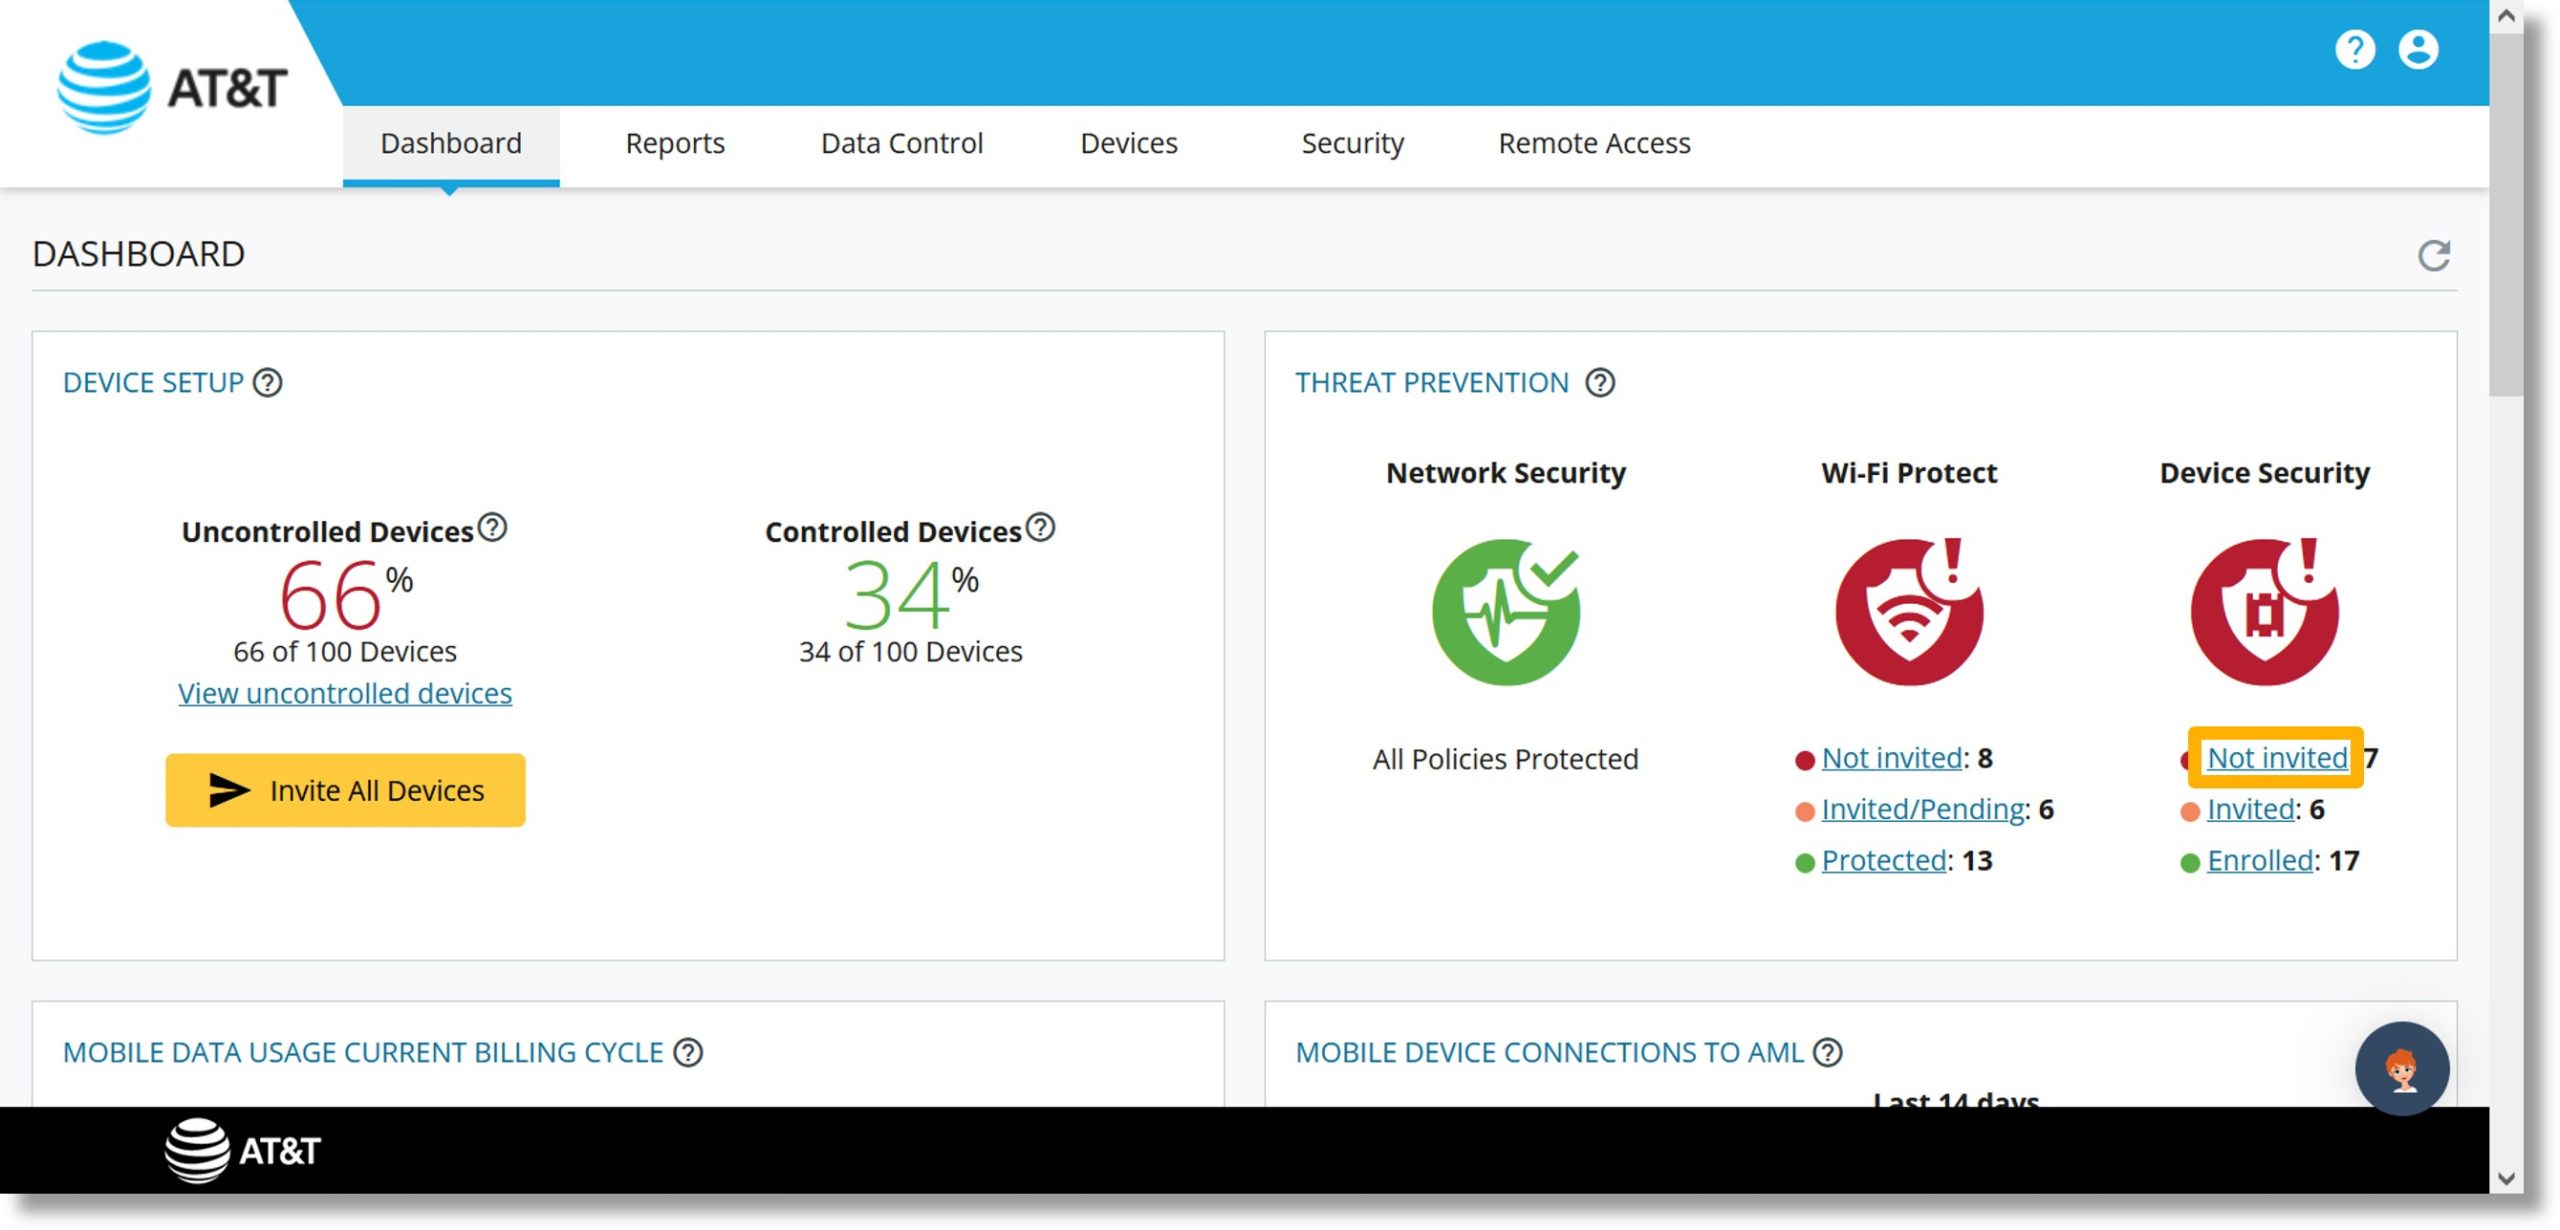
- The device group details display, and you can take the desired actions.
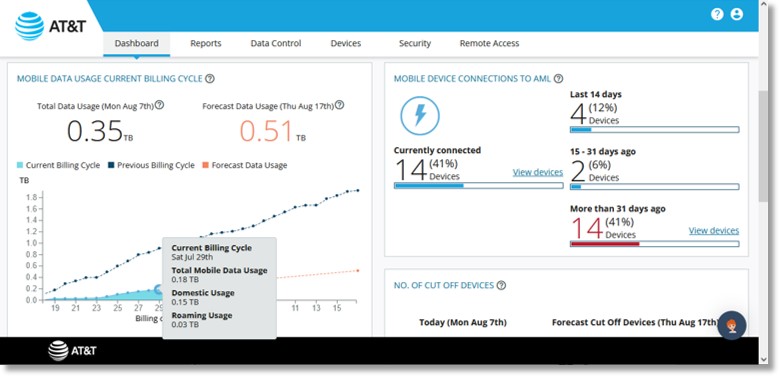
Mobile Data Usage Current Billing Cycle
- Click on the Dashboard tab at the top of the page.

- Scroll to the “MOBILE DATA USAGE CURRENT BILLING CYCLE” tile.

- The tile displays the Current billing cycle, Previous Billing Cycles, and a Forecast of Data Usage.
- Hover over the desired point in the Previous Billing Cycle line.

- The details of the previous data usage are displayed.
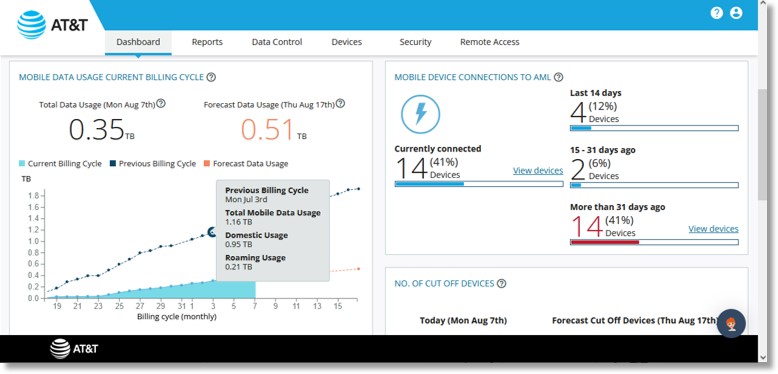
- Hover over the desired point in the Current Billing Cycle line.
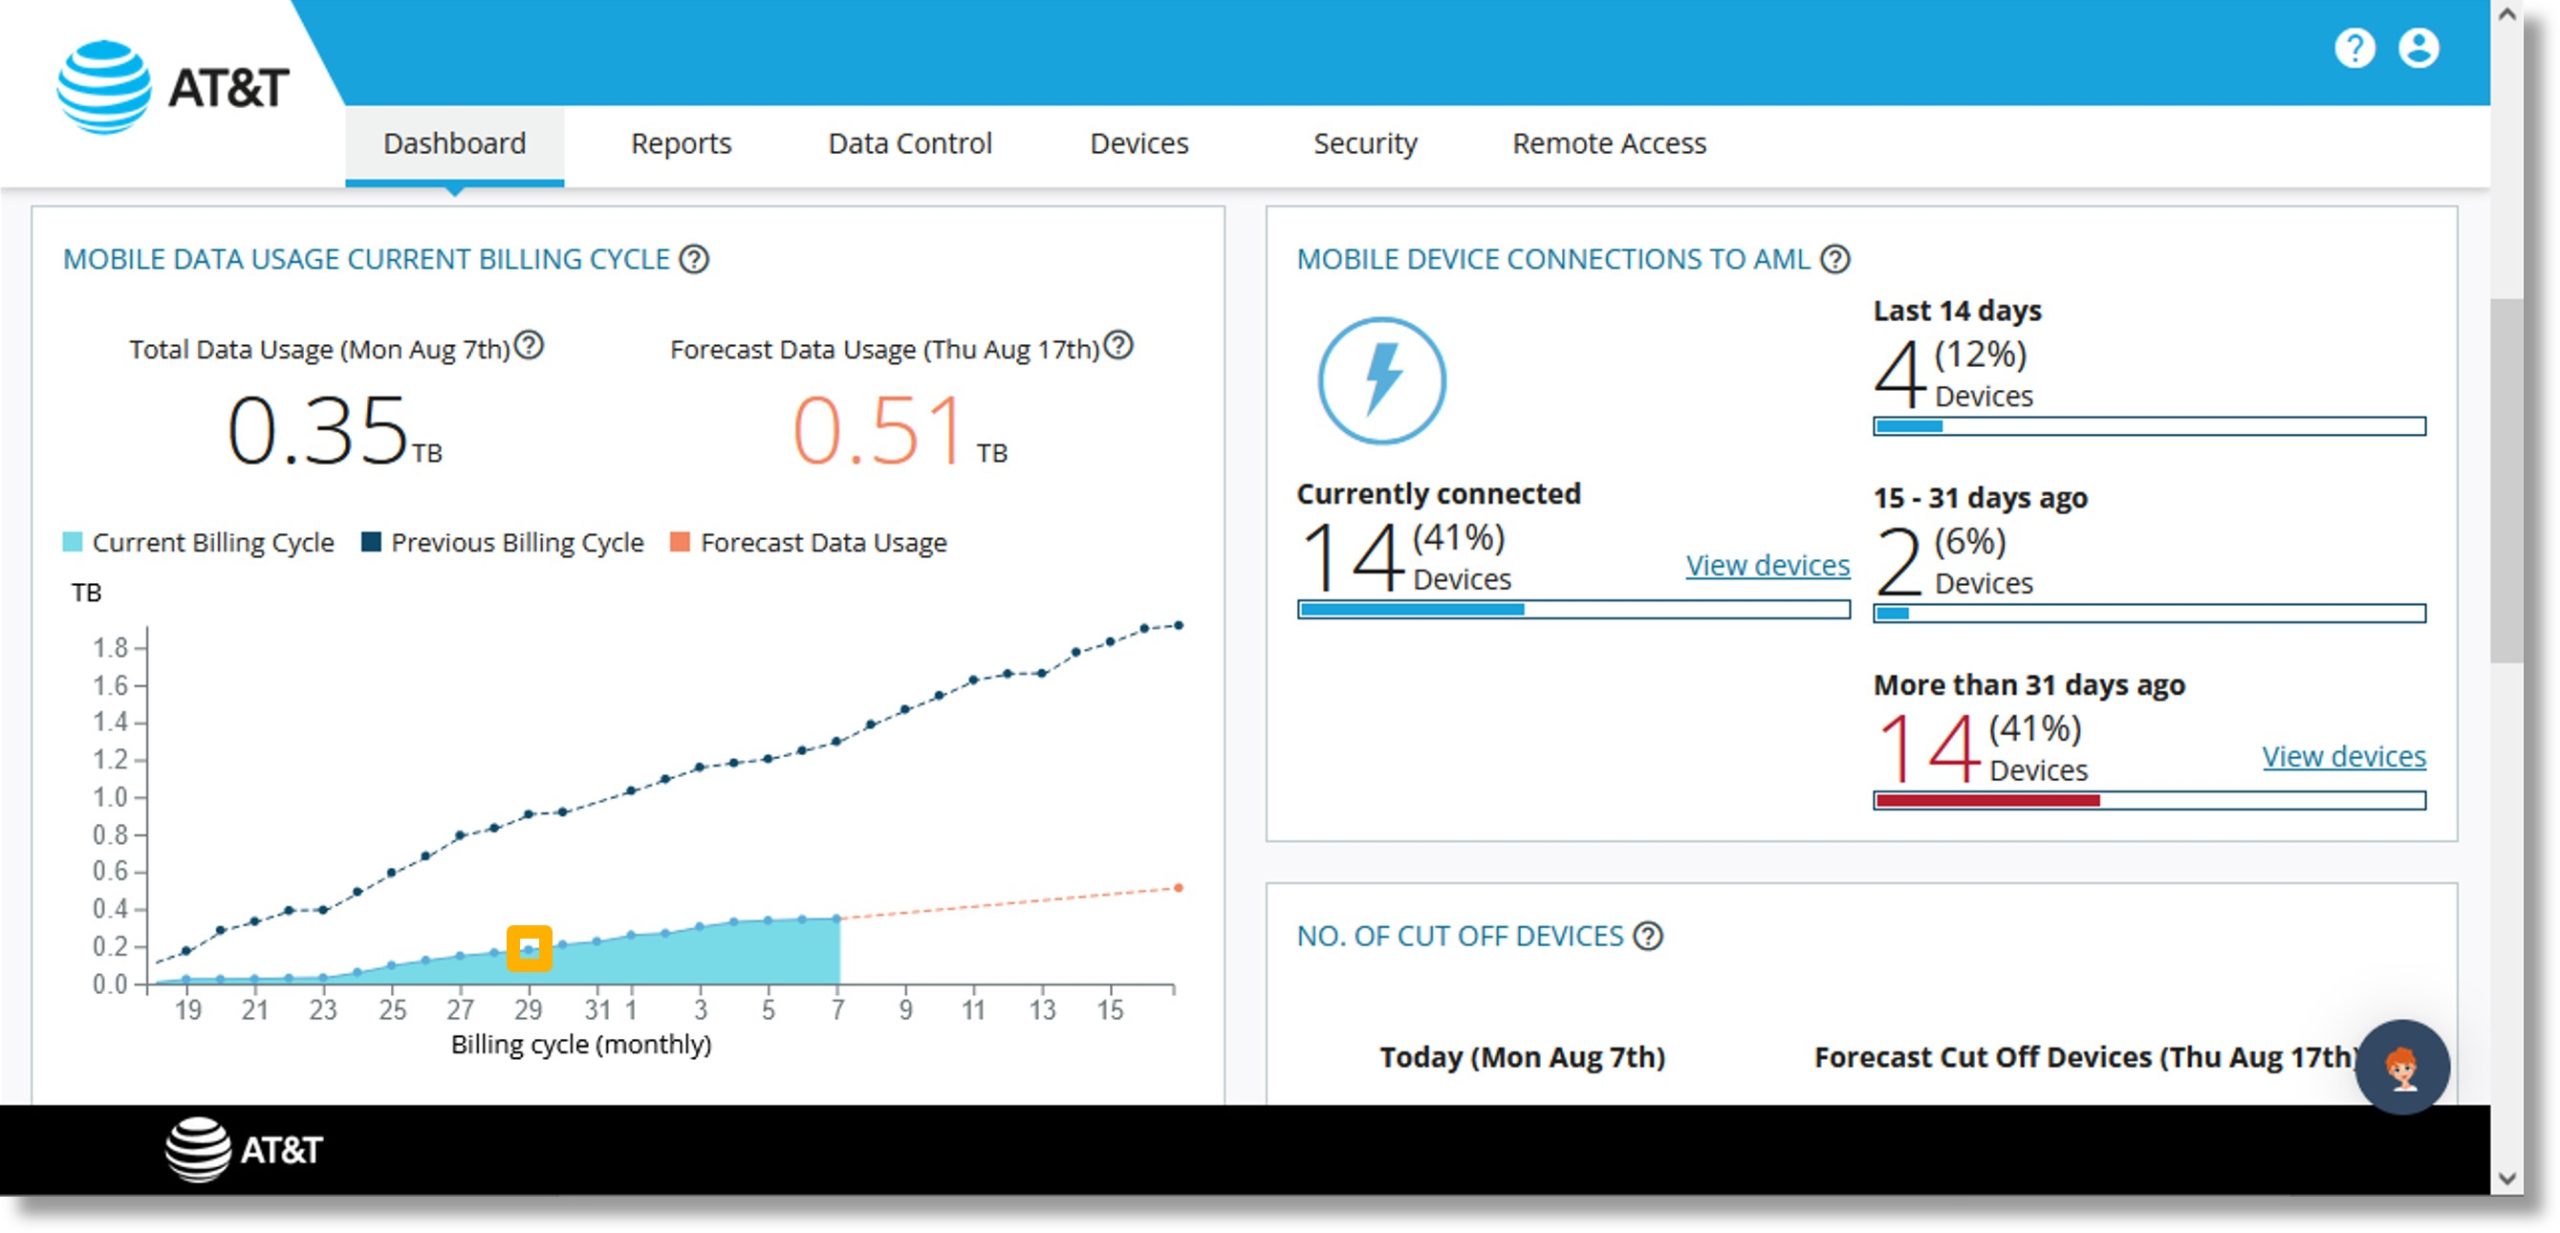
- The current data details are displayed.
Mobile Device Connections to AccessMyLAN
- Click on the Dashboard tab at the top of the page.

- Scroll to the “MOBILE DEVICE CONNECTIONS TO AML” tile.

- The tile displays the number of devices currently connected and the connections for the last 14, 30, and over 31-day timeframe.
- Click on the View devices link to the right of the desired connection timeframe.
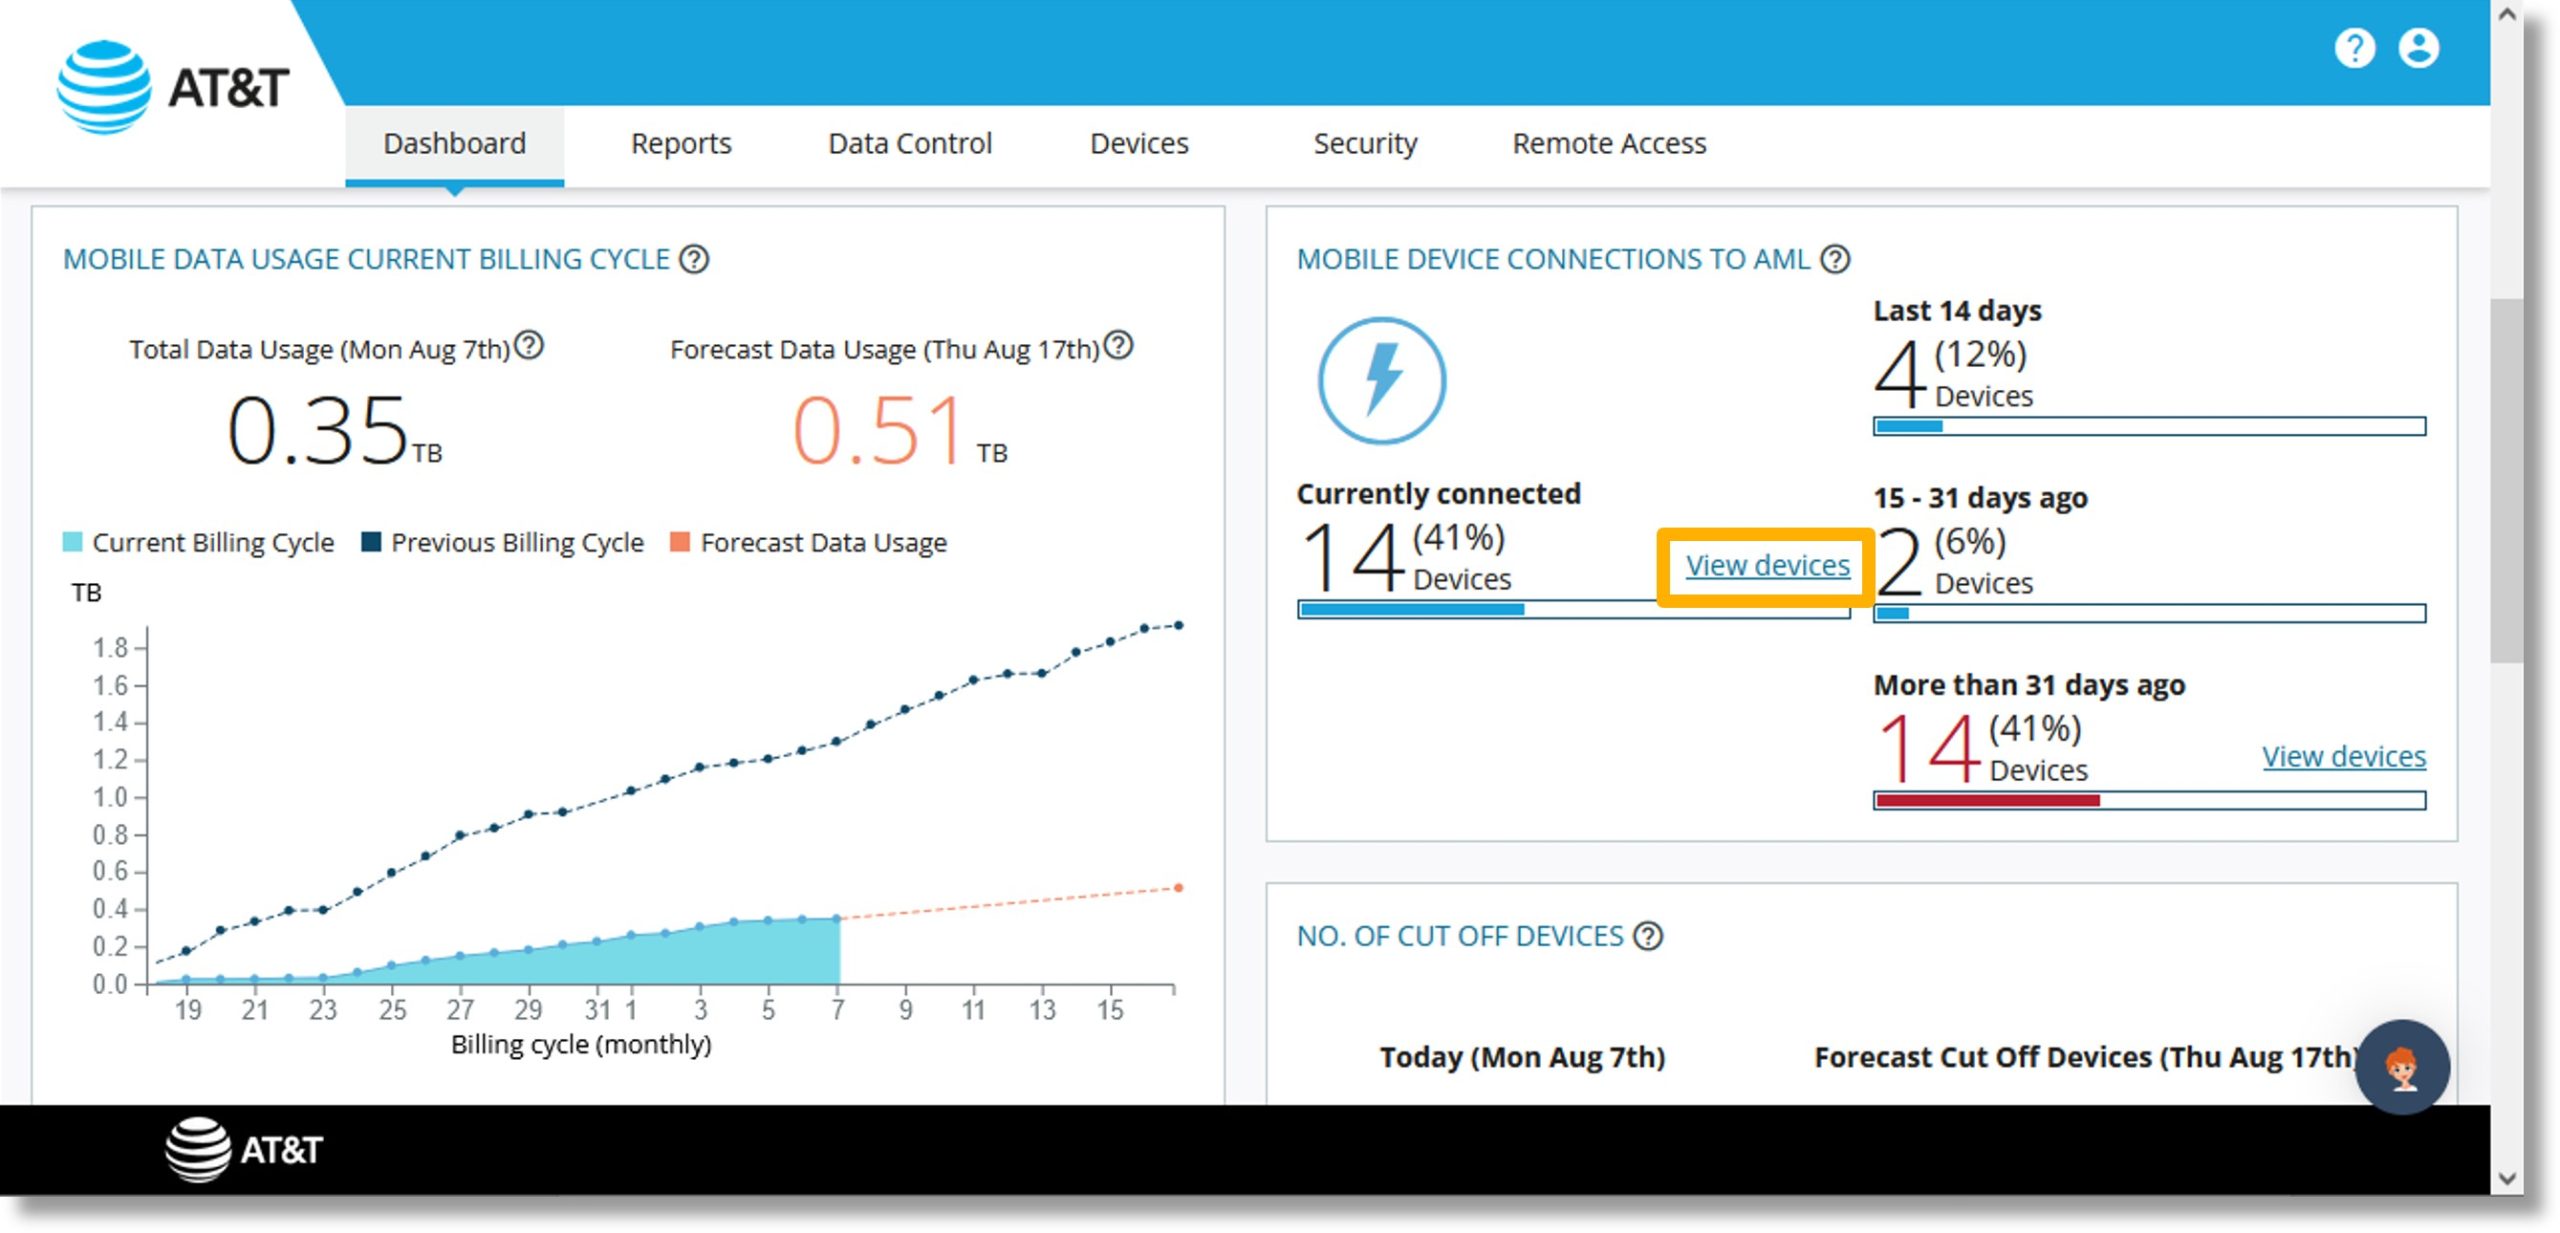
- The corresponding device list displays.
Number of Cut Off Devices
- Click on the Dashboard tab at the top of the page.
- Scroll to the “NO. CUTOFF DEVICES” tile.

- The tile displays the number and percent of devices cut off from data today and a projection for devices to be cut off by a specific date.
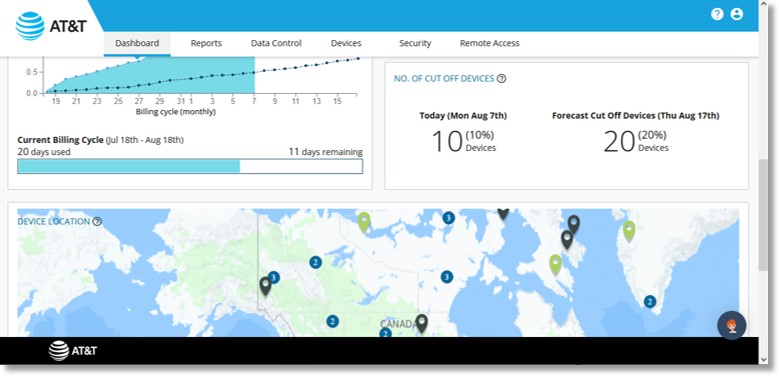
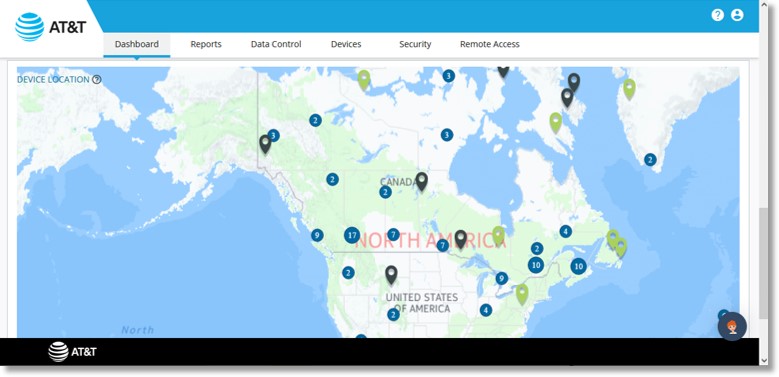
Device Locations
- Click on the Dashboard tab at the top of the page.

- Scroll to the “DEVICE LOCATIONS” map.

- The map displays the current device positions.
Note: A number displays if there are devices close to one another.